Muttart, Fisher, Knodler, Pollatsek
1
Driving Simulator Evaluation of Driver Performance during Hands-Free Cell Phone Operation in a Work Zone: Driving without a Clue. By: Jeffrey W. Muttart Department of Mechanical & Industrial Engineering University of Massachusetts Amherst, MA 01003 Telephone: 413-545-3393 Fax: 413-545-1027 Email:
[email protected] Donald L. Fisher Professor Department of Mechanical & Industrial Engineering University of Massachusetts Amherst, MA 01003 Telephone: 413-545-1657 Fax: 413-545-1027 Email:
[email protected] Mike Knodler, Ph.D., Assistant Professor Department of Civil and Environmental Engineering University of Massachusetts at Amherst Amherst, MA 01003 Telephone: 413-545-1657 Fax: 413-545-1027 Email:
[email protected] Alexander Pollatsek Research Professor Department of Psychology University of Massachusetts Amherst, MA 01003 Telephone: 413-545-2650 Fax: 413-545-1027 Email
[email protected]
Submitted for Transportation Research Board Annual Meetings Length of Paper: 6157 words, 5 figures @ 250 words each, 7407 equivalent words. Length of Abstract: 242 words
TRB 2007 Annual Meeting CD-ROM
Paper revised from original submittal.
Muttart, Fisher, Knodler, Pollatsek
2
ABSTRACT Crashes continue to be a problem in work zones. Analyses have indicated that rear-end and sideswipe crashes are the most frequent. Investigators have hypothesized that distractions are often the cause of both types of crashes. These distractions will only increase as more drivers attend to other tasks, such as cell phone conversations. In order to address this issue, virtual worlds that reflect various work zone geometries were developed for an advanced driving simulator. These worlds contained 32 virtual work zones, and 38 drivers navigated through these worlds. On one portion of a trip, the drivers were asked to respond to a series of short sentences, which mimicked a hands-free cell phone conversation; on the other portion of the trip, no sentences were read to the drivers. A lead vehicle ahead of the participant driver braked occasionally in the work zone activity area. Braking scenarios involved either the lead vehicle stopping after an advanced clue that traffic ahead was going to stop or the lead vehicle stopping for no apparent reason, most often after passing a roadside obstacle (potential distracter). Drivers not engaged in a cell phone task were able to reduce their speed earlier in response to a slowing lead vehicle than were drivers engaged in the cell phone task. Drivers on the cell phone were also more likely to brake hard and less likely to make a mirror glance when changing lanes. The results strongly suggest that cell phone use reduces driver awareness and will increase the two major types of crashes in work zone activity areas, which are rear end and sideswipe collisions.
Keywords: cell phone, rear end crash, vehicle following, simulation, eye tracking
TRB 2007 Annual Meeting CD-ROM
Paper revised from original submittal.
Muttart, Fisher, Knodler, Pollatsek
3
INTRODUCTION There are a significant number of crashes, injuries, and fatalities in work zones. Approximately 37,000 injuries occur in work zones in the U.S. each year (1). Moreover, approximately 1,000 work zone fatalities occur annually (1). In simple terms, on average, three people are killed and 160 injured every day in work zones in the country (2). Significantly, Raub, Sawaya, Schofer, and Ziliaskopoulos (3) found that these rates were under-reported because some of the work zone related accidents occurred outside the defined limits of the work zone. For example, when traffic is backed up due to an upcoming work zone, a rear-end crash may occur prior to the work zone. Although this accident is not considered to have occurred inside the work zone, its cause is clearly work zone related. Therefore, the work zone problem is probably even greater than it first appears. Also, there is an increased danger within work zones (4), both to the workers and to the drivers (3). Thus, it is important to determine what can be done to mitigate the problem. Zhao and Garber (4) investigated crashes that occurred throughout Virginia between 1996 and 1999. They found differences between the types of collisions that occurred inside and outside of work zone areas. A higher proportion of work zone crashes involved multiple vehicles. They also found that the proportion and types of collisions varied by work zone region. The highest proportion of work zone crashes occurred within the activity area and the most common type of crash was a rear-end crash. This was not surprising given that there are often few opportunities for escape within the work zone area. Further, there were significantly more sideswipe collisions within the transition area than in the advance warning area. Raub et al. (2001) found much the same pattern in Illinois. In particular, they found rear-end collisions to be common in Illinois work zones, particularly in the activity area where there are often limited chances or no chance for escape. Several reasons have been proposed as explanations for each type of crash and are discussed below. Rear-End Crashes. Raub et al. (3) found that driver distraction within the work zone activity area was a significant contributing factor to such crashes. Perhaps the most obvious distraction is the activity within the work zone itself. Drivers distracted by this activity may behave in ways that are unexpected (e.g., slowing or stopping when not necessary). It is plausible that the increased use of in-vehicle technologies such as cell phones may increase the extent to which work zone activity is itself distracting (5). There was a time when drivers only had radios to tune and air conditioners to adjust. In recent years, we have added cellular phones, collision warning devices, televisions, and navigation systems, among others, all of which require portions of a driver’s attention. The effect of cell phone use during driving has been a topic of considerable interest to researchers in transportation engineering. In an influential study that led to the ban of driver cell phone use in Japan, Ishida and Matsuura (6) compared driver performance with a handheld cell phone, a hands-free unit, and with no cell phone use. They found that even when a hands-free cell phone was used, driver performance was significantly disrupted. There have been a number of studies yielding similar results here in the United States. For example, it is known that drivers using cell phones take longer to respond to red lights, that it disrupts their visual scanning pattern, and that they are less likely to notice information in their environment even though they are looking directly at it (7). If the use of a cell phone significantly interferes with driving under normal circumstances, it is likely that this interference would be magnified within a work zone where additional driver attention is required. Part of the
TRB 2007 Annual Meeting CD-ROM
Paper revised from original submittal.
Muttart, Fisher, Knodler, Pollatsek
4
problem could be that drivers may not realize the need to pay close attention because they are just driving straight ahead and may have already slowed. Thus, if the driver is paying attention to the cell phone conversation and, in addition, is distracted by activity in the work zone area, the driver may have few resources left for processing events directly in front of him or her which may need a quick response. In either case, the effects of cell phone use in work zones have yet to be measured. Side-Swipe Crashes Next, consider causes of the second major type of crash in work zones, the sideswipe. Not surprisingly, Raub et al. (3) have shown that vehicle conflicts during merging lead to the sideswipe collisions. Clearly, drivers who wait until the last moment to change lanes in response to the transition lane will reduce the likelihood of a smooth shift of traffic by creating more of a bottleneck. Drivers who remain attentive to their surroundings may be more likely to prepare for a work zone transition earlier which will reduce the likelihood of two vehicles vying for a single lane at the end of a transition. Cell phone usage may cause an increased number of drivers to fail to respond in a timely manner to advance warning signs. Thus, if driver distraction is at the root of the problem, cell phones (and other in-vehicle technologies) are likely to exacerbate the problem. Research Goal and Hypotheses In summary, there are an increasing number of collisions in work zones and the majority of such collisions are either rear end or sideswipe crashes. Cell phones may be a contributor to these crashes. Our long term goal is to determine whether processing communications such as occur on the cell phone does indeed lead to an increase in these two very different types of crashes in the work zone. Our goal for the research reported below was to determine whether such processing leads to behaviors that are likely to increase the number of crashes. To answer this research question, we had participant drivers maneuver work zones in a virtual world either engaged or not engaged in a mock, hands-free cell phone task. Their eye movements were monitored throughout. On the basis of the available literature, we have three specific research hypotheses. The first two bear on rear end collisions, and the third on sideswipe collisions. First, we hypothesize that drivers have more centrally focused search patterns when multitasking. For example, because drivers have been shown to have fewer glances to mirrors and the speedometer (8), fewer glances at billboards (9) and decreased horizontal scanning while conversing over a cell phone (10) and furthermore, even when looking ahead, they may not be mentally processing what they are looking at (9), we hypothesized that the hands-free mock cell phone task would cause these drivers to miss the available peripheral cues to stop ahead and thus will respond slower than drivers who are not engaged in this task. Second, we hypothesize that because drivers using cell phones fail to detect problems in a timely manner, they would be more likely to brake hard than drivers who are not using a cell phone. Third, we hypothesize that due to the resource demands required by a hands free cell phone task, these drivers would be more likely to fail to look into any of the rear view mirrors prior to a lane change. METHOD The nature of rear end and sideswipe crashes makes it very difficult to study them in the field. It is difficult to study both because the situations in which one is interested may put drivers at
TRB 2007 Annual Meeting CD-ROM
Paper revised from original submittal.
Muttart, Fisher, Knodler, Pollatsek
5
risk and because one does not have complete control over the factors that one wants to evaluate or over the data one would like to collect. Therefore, we utilized a driving simulator in the hopes of gaining information that we can use to compare to on-road studies and real life crash data in subsequent research, realizing that the generalization may not be perfect from the simulated to the real world. Briefly, the drivers maneuvered a total of 32 work zones in the virtual world, 16 while engaged in a mock cell phone conversation and 16 while not so engaged. All work zones involved closure of one of the two lanes in a highway. The driver followed a lead vehicle (LV), which would, on occasion, slow, to a stop or near stop. The stop was either clued in advance (activity downstream of the lead vehicle could be used to infer that the lead vehicle would need to stop) or unclued. Advance clueing refers to situations where the subject had reason to believe that the LV would be slowing (in response to a second LV or a pedestrian intruding into the path of a LV). Unclued refers to situations where the LV stops for no reason, i.e., with no signal given to the driver that the LV would be slowing beforehand. Because we wanted to study drivers in situations that demanded their attention, we did not activate the brake lights of the lead vehicle as it slowed. Not only is this realistic (tail lights are often difficult to see in daylight conditions, either because of brightness levels or because of dim taillights or the taillights may not be activated), but it also allowed us to discriminate better between the advance clued and unclued conditions, an effect that would presumably have been attenuated if the taillights had been activated. Eliminating tail lights also removes the possibility that the subjects would simplify their workload by looking only for brake lights. Participants A total of 38 drivers, 20 men and 18 women, between the ages of 18 and 59 years participated in the experiment. The data of three others were not used because they suffered motion sickness and did not complete the experiment. The average age was 26.4 years. Drivers were allowed to participate only if they had a valid driver’s license and did not wear glasses. (The eye tracking glasses could be used by subjects wearing contacts, but not those wearing glasses.) The recruiting process for drivers was conducted in the Amherst, Massachusetts area using flyers posted around the campus and advertisements. Equipment A fixed-based driving simulator was utilized for this study (Figure 1Figure 1). The simulator makes use of a Saturn sedan and the forward driving scene is displayed across three screens that encompass a visual horizontal field of a 150-degree and a vertical field of 30 degrees. The images are displayed at a resolution of approximately 1024 X 768 dpi in each screen with a refresh rate of 60 Hz. The simulator also broadcasts road and engine noises with a Bose surround sound audio system. The ASL MobileEye eye tracker was employed to monitor eye movements of the driver. The MobilEye samples eye movements at 30 Hz. In the data files, a crosshair representing the direction of gaze of the driver is superimposed onto the forward scene view. Among other things, this allows one to determine whether drivers made glances into the rear view mirrors prior to attempting a lane change. The scene viewed through the rear view mirrors showed a series of stationary photographs depicting a road with no vehicles or a vehicle that was shown at a subtended visual angle that is similar to a vehicle that is 80 feet, 160 feet or 960 feet (1, 2 and 12 seconds) behind. The experimenter used a remote device to control the following vehicle
TRB 2007 Annual Meeting CD-ROM
Paper revised from original submittal.
Muttart, Fisher, Knodler, Pollatsek
6
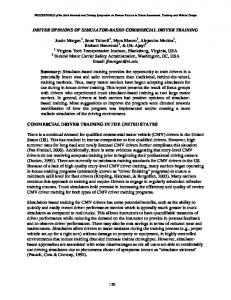
display. The scene was changed every time the subject changed lanes to depict the proper view (right or left lane view) to the rear.
Figure 1: University of Massachusetts at Amherst Driving Simulator. (Visual database and scenarios)
While driving 56 miles, each driver negotiated through 32 work zones and faced an emergency response situation 16 times. The entire 56-mile trip was divided into 4 blocks, each of which had 8 work zones. Each block consisted of a simulated drive on a four-lane divided highway (two lanes in each direction); a grassy median divider separated the lanes in each direction. In each block, signs directing the drivers to move into either the right or left lane were placed in such a way that there was an equal likelihood of a driver being in either the right or left lane and being faced with a work zone in the right or left lane. Therefore, half the time the driver had to negotiate a transition for the work zone and half the time they were already in the appropriate lane. Leading up to the work zone were three sets of signs (one on each side of the road). The first set warned of a work zone ahead. The second set, 500 feet away, advised the driver of either a right or left lane closure. The third set of signs, another 500 feet from the second set, were symbolic merge signs. There was at least 1 mile dividing the end transition of each work zone with the pre-construction signing for the next.
Figure 2: Work zone activity area and surrounding roadway environment.
The environment was a rural highway with rolling hills, embankments and trees along each side of the road (Figure 2Figure 2). The simulated environment was set to cloudy and 3:00 PM (traveling easterly) to improve the contrast with the signs and to reduce the possible confounding influence of glare or shadows. The road was straight with four 22.5-degree turns that had a radius of 270 m.
TRB 2007 Annual Meeting CD-ROM
Paper revised from original submittal.
Muttart, Fisher, Knodler, Pollatsek
7
In addition to the participant driver, there were other vehicles ahead of the driver, most notably a lead vehicle. This lead vehicle would occasionally slow down or stop (see discussion in Experimental Design). Channelization through the work zone was accomplished using 42-inch traffic cones to be consistent with the size of T-top cones and barrels that are used in real life work zones. When there is activity in the work zone, there is a 500 foot buffer space before the first worker. Half of the work zones had no activity and half involved activity. In those work zones with activity, there were three pieces of large equipment, five stationary workers and two moving objects in each work zone (see Figure 2Figure 2). One moving object was moving parallel to and the other perpendicularly to the direction of the participant driver. All stationary workers and equipment were placed in the same positions for all work zones (whether right or left closures). Moving workers on the left were placed 1 m further from the dashed lane line than when on the right to be sure they were at the same visual eccentricity for the participant driver. Hands Free Cell Phone Task The hands-free communication task (i.e., mock cell phone task) involved the subjects wearing ear buds and listening to a series of sentences that were similar to the grammatical reasoning (working memory) tasks used by Baddeley (11). Other studies have also used a similar task to replicate the cellular phone task (12, 13). The variation on the task is that the difficulty of the task was reduced slightly from that of Alm & Nilsson (12, 13). In the present experiment, the drivers heard a 5-word sentence every 10 seconds through a cell phone ear bud. After each sentence, the driver was asked if the sentence made sense or not. Seven seconds after the sentence began, the subject was asked, “Last word?” and was given an additional three seconds to answer. An example of the procedure is as follows. The driver was read, “The truck delivered the package.” In response the driver should answer “yes”. The experimenter would then ask “Last word? And the driver should respond, “Package”. An example of a sentence that does not make sense is “The octopus burned the onions”. Drummond, Brown, and Salamat, (14) investigated Baddeley’s grammatical reasoning test and found that asking participants to listen to longer sentences or recall the last word after several sentences may require drivers to tap portions of the brain that are not normally activated during sentences involving fewer words. Therefore, the hands-free mock cell phone task was intended to replicate a very casual cell phone conversation that does not require mental rehearsal or recall intervals of greater than 3 seconds. During pilot testing we learned that subjects made frequent glances toward the handsfree speaker phone (the source of the sound). To obtain information regarding driver performance due to a casual communication task alone, cell phone ear buds were used. Experimental Design Two sets of 16 scenarios were created. Four factors were varied orthogonally: (1) the activity in the work zone (present or absent), (2) the location of the work zone (left or right side), (3) the requirement to change lanes in order to move through the work zone (required or not required), and (4) the presence of a vehicle in the left side view or rear view mirror when a lane change is required (present or absent). This combination of conditions led to two base sets of 16 scenarios (Blocks A and B). The manner in which the 16 work zones were presented to participants was counterbalanced across scenarios so the approach (right or left), work zone location (right or left), activity within the work zone (equipment within the work
TRB 2007 Annual Meeting CD-ROM
Paper revised from original submittal.
Muttart, Fisher, Knodler, Pollatsek
8
zone or an empty work zone), and whether there was a following vehicle or not, all seemed to vary randomly. Each participant drove four 14-mile blocks: they did the simulated cell phone task in two of the blocks and didn’t do it in the other two blocks. Half of the participants did the cell phone task in the first and third blocks; the other half in the second and forth blocks. Additionally, in 16 of the 32 scenarios, the lead car slowed. In eight of each group of 16 scenarios (unclued), the lead car braked without warning (presumably because of unforeseeable hazards). In the other eight scenarios the participant driver was given clues that they would be stopping ahead (advance clue). Specifically, in these eight scenarios with an advance clue the simulated driving environment was set up in such a way as to give the drivers clues that can be easily seen by an attentive driver that indicate they need to stop ahead. Such clues would be pedestrians crossing the road several vehicles ahead, a stopped (taller) vehicle ahead, or a vehicle emerging from the work zone ahead of a lead vehicle. The cluing object never emerged from a point that was more than a 2 degree eccentricity from straight ahead. The advance clued and unclued scenarios occurred equally often in the right and left work zones and equally often in the work zones with and without activity. Procedure The participants drove the virtual car through the simulated sections of the highway. They were instructed to maintain a 2-second following distance (i.e., 4 dashed lines on the pavement) from a lead vehicle, while observing normal (safe) driving protocols. They were instructed to change lanes only when they felt it was appropriate and to observe highway signs. During half of the blocks, the participants were also asked to do the secondary communications task as they performed the driving task. After driving 14 miles and 8 work zones of one block (4 involving a braking hazard), the drivers were allowed a short break while another virtual world (block) was loaded onto the simulator. The entire drive time averaged 75 minutes; it varied slightly due to the speed at which the subject drove. At the beginning of a session, each subject signed an informed consent form. At the end of a session each subject completed a debriefing questionnaire where they were asked to give subjective ratings of the difficulty due to the following vehicle (rear view mirror task), mock cell phone task and negotiating through the work zones. Dependent Variables Participants were required to wear the eye-tracking device during all trials so that a measure of their eye movements could be obtained. In addition, behavioral information including following distance, vehicle speed, and merging procedure were recorded. Thus, we obtained information relevant to the likelihood of a sideswipe or rear end crash in a real driving situation. We report four indices of drivers’ behavior. The first is the response distance: the distance between a fixed trigger location and the first braking of the participant driver. The trigger location was a point on the road such that when the participant vehicle crossed it, a significant event occurred in the work zone activity area ahead of the participant vehicle. The second is whether the driver braked hard in the work zone activity area: the driver was scored as braking hard, if the car decelerated at a rate greater than 0.5 gs for longer than 0.1 second. (The 0.5 g threshold is equivalent to full braking on wet pavement and is approximately the point at which skid marks begin to appear in most cases.) The third is the response speed: the speed of the vehicle when it was within 15 m (49 feet) of the lead vehicle. We chose 15 m
TRB 2007 Annual Meeting CD-ROM
Paper revised from original submittal.
Muttart, Fisher, Knodler, Pollatsek
9
because we learned in our pilot testing that early and late responders were both traveling slow speeds when very near the rear of the lead vehicle. Fifteen meters was selected because it was typically near the middle of the deceleration curves and better showed the difference in the driver response (see Figure 3 as an example). Response speed was selected as a dependant measure because it accounts for reaction time, motor response and decisiveness of the response and for that reason it offers a much broader view of a driver’s response than does reaction time alone. Furthermore, RT does not in and of itself tell us anything regarding vehicle control or ability to avoid while distance from impact and speed offers greater insight. The fourth was the number of times a driver glanced at either the rear or side view mirrors. This was easily determined from evaluation of the crosshairs on the ASL MobilEye videotape, which indicated with 0.5-degree accuracy exactly upon what the driver was focused at each point in time. The glances had to occur 3 seconds or less before the driver changed lanes in order to count as an indication that the driver was checking for cars in the adjacent lane. Lane changes in response to signs, work zone transitions and slow moving vehicles were recorded. Lane changes immediately after leaving the work zone were not recorded because it could be argued that the driver knew nothing was approaching from the previously closed lane. Deceleration Profiles Late braking
Early braking then coasting
100
Km/H
80
Figure 3. Typical deceleration profiles of pilot subjects which show late responders and early responders who then coast up to the rear of the lead vehicle.
60 40 20 0
RESULTS AND DISCUSSION Analyses were undertaken of Distance to Contact (m) measures that had a bearing on rear end and sideswipe collisions. To begin, consider the measures used to determine the likelihood that a driver would be in a rear end collision. Specifically, an analysis was done to determine the influence of clues, work zone activity, and cell phone use upon, response distance, speed of the vehicle when within 49 feet (15 m) of the lead vehicle, and hard braking (greater than 0.5 gs). First, we analyzed the response distance (between the trigger location and the first braking activities). The mock cell phone users traveled 245 feet before braking as opposed to 226 feet for the non-cell phone users, a difference of 19 feet, t(31) = 2.58, p < .02. This indicates that the distraction from the cell phone usage caused drivers to delay their appropriate actions to slow down relative to the drivers not using the cell phone. However, this effect was modulated by whether there was a clue that the lead vehicle might stop. When there was such a clue, the difference between the groups was 34 feet, whereas when there was no clue, the difference was only 4 feet. This difference was reliable, F(1, 30) = 4.71, p < .05. This makes sense, as when there is no clear clue to stop, neither the cell phone users nor the no cell phone users have the necessary information to tell them to slow. Note that this did not need to be the case. Drivers not on the cell phone may look around more and therefore may have been more likely to miss the lead vehicle stopping. In fact, there may be a tradeoff when 51
45
39
33
TRB 2007 Annual Meeting CD-ROM
27
21
15
9
3
Paper revised from original submittal.
Muttart, Fisher, Knodler, Pollatsek
10
there is no advance clue that the lead vehicle is stopping that leads to the rough equivalence: drivers on the cell phone are more likely to be looking ahead, but less attentive; drivers not on the cell phone are more likely to be glancing at peripheral clues, but more attentive. When there is an advance clue, the tradeoff is in favor of drivers not on the cell phone. Second, this pattern was mirrored in the data on the speed of the vehicle (within 49 feet of the lead vehicle) when it began stopping. Overall, drivers in the cell phone task were traveling faster than the drivers in the no cell phone task (37.2 mph vs. 33.7 mph). However, this overall difference was not significant, t(31) = 1.40, p < .20. There was the same interaction as in the above data, as the difference was 8.0 mph for the advance clued condition but actually -1.0 mph for the unclued condition (see Figure 4). However, both the 8.0 mph difference for the advance clued condition and the interaction just failed to reach significance, t(31) = 2.11, p = .06, t(30) = 1.86, p < .10. Figure 4 Influence of cluing and mock cell phone use upon the ability of the subject to reduce his speed when within 49 feet of a stopped or slowing lead vehicle.
Clue No Clue Clued to Stop
Mean Speed_49ft
38.00
36.00
34.00
32.00
30.00 No Cell Use
Mock Cell Task
CellUse
A Initial Speed of the Subject Vehicle was Approximately 55 mph s a result of these late responses to the event in the work zone area, the cell phone drivers were much more likely to brake hard (greater than 0.5 gs deceleration). Drivers involved in the mock cell phone task decelerated sharply in 50.3% of the braking scenarios, while those who were not on the cell phone decelerated sharply in only 37.2% of the scenarios, t(31) = 3.50, p < .002 (see Table 1). However, unlike the prior two measures, there was little interaction with cluing condition, t(30) = .07. Unlike the other two measures, which assessed inattention due to the cell phone usage quite early in the epoch being studied, the hard braking measure would also reflect inattention later in the epoch. Thus, if a driver brakes hard later in the epoch, they probably have not seen the clue even if it was present, and its presence would not matter regardless of whether the driver was a cell phone user or not. Since there were
TRB 2007 Annual Meeting CD-ROM
Paper revised from original submittal.
Muttart, Fisher, Knodler, Pollatsek
11
different conditions (clued, cell use, work zone activity) and relatively few crashes there was not enough power to reach significance but there were 17% more crashes in the cell usage condition.
Crashes Hard Brakes Observations Percent Hard Brakes
Cell 21 119 278 50.3%
No Cell 18 77 260 36.5%
Table 1. Hard braking events expressed as a percentage of total braking events for cell and non-cell phone driving. Using the video recordings from the ASL MobileEye, a comparison was made of the rear view mirror glances by drivers when using the cell phone and when not on the cell phone. Mirror glances were recorded for lane changes in responses to other vehicles, to work zone transitions (the start of cones) and to signs directing them to move right or left. For example, consider the 454 lane changes (All, top row). In 77 of these lane changes, the drivers failed to look in their rear mirrors (17.2%) and 49 of the 78 failed glances were made while drivers were on the cell phone while only 29 of those who were not on the cell phone failed to glance. Moreover, in each of the three separate situations (signs, transition, cars), the majority of failed glances were made by drivers engaged in a cell phone task. The comparison of mirror glances was made using a Chi-Square analysis by comparing the number of times each driver failed to glance in the mirror when performing the cell phone task and when not on the cell phone. The null hypothesis was that cell and non-cell phone drivers would fail to check the mirror equally. The analysis rejected the null hypothesis in that cell phone drivers failed to check their mirrors significantly more often than did non-cell phone drivers ( 2 = 3.913; p = .048). Finally, drivers appeared to underestimate the influence of the cell phone task on their performance with only 29% of the drivers rating the task as difficult (none rating it as very difficult). Moreover, the ones who rated it as the easiest tended to be the worst performers (see Figure 5), which is consistent the hypothesis that many cell phone users are unaware of the extent to which the cell phone is capturing their attention to the detriment of their driving.
TRB 2007 Annual Meeting CD-ROM
Paper revised from original submittal.
Muttart, Fisher, Knodler, Pollatsek
12
Average Hard Braking Events
1.8
1.6
1.4
1.2
1.0 Very Easy
Easy
Difficult
Very Difficult
Subjective Difficulty of Cell Task
Figure 5 Subjective rating of the difficulty of the mock cell phone task and negotiating through the virtual work zones. CONCLUSIONS This research reports an analysis of the types of situations that are most associated with crashes in work zones. Because it was conducted on higher speed (simulated) roads, it may also be representative of the types of crashes that could lead to severe injuries or fatalities due to the greater impact speeds (issues of generalizability still need to be addressed). We found that the drivers using the cell phone were delayed in their speed reduction and then when they finally did brake, they did so more impulsively so that there were more hard brakes (but not necessarily more efficient braking). We infer that this is because drivers on the cell phone also missed critical information that was available to them both from the roadsides and from actions of downstream traffic. This would suggest a shrinking of the visual field in not only the horizontal but also the longitudinal direction. Due to the apparent need to gather information in the forward view, it was at the expense of information that was available in other areas, particularly toward the rear. Specifically, drivers using the cell phone failed to utilize their rear view mirrors 69% more than those who were driving without a cell phone task. Lacking peripheral glances in the forward view as well as missed mirror glances toward the rear view would likely relate to a greater exposure to potential side-swipe crash situations. This research corroborates the findings by Dingus et al. (15) related to cell phone use. They found that cell phone use (10%) was the most frequent secondary task contributor to forward roadway inattention for near crashes. We too found that it is likely that cell phone use contributes to crashes. Note that Dingus et al. found that long glances away from the forward roadway were also a major contributor to crashes. Cell phone use does not increase crashes because of increases in glances away from the forward roadway. Rather, it presumably does such because although looking ahead the driver is not attending as well when on the cell phone.
In summary, many of the braking scenarios involved advance clues that traffic ahead was going to stop. Drivers who were engaged in the mock cell phone conversation did not appear to pay as close attention to these clues, exhibiting more sharp decelerations (greater
TRB 2007 Annual Meeting CD-ROM
Paper revised from original submittal.
Muttart, Fisher, Knodler, Pollatsek
13
than 0.5 g) and taking longer to respond. Furthermore, they were 30% less likely to check their rear view mirror. These results strongly suggest that cell phone use reduces awareness of the user’s surroundings and will increase the two major types of crashes in work zone activity areas, which are rear end and sideswipe collisions.
ACKNOWLEDGEMENTS Portions of this research were funded by grants from the New England Transportation Consortium (Project Number NETC 04-2) and the National Science Foundation (Equipment Grant SBR 9413733 for the partial acquisition of the driving simulator). We would also like to thank Steve Socha and Lloyd Gibson.
TRB 2007 Annual Meeting CD-ROM
Paper revised from original submittal.
Muttart, Fisher, Knodler, Pollatsek
14
REFERENCES 1. Federal Highway Administration. (November 2002). Intelligent Transportation Systems in Work Zones: A Cross-Cutting Study. Integrated Work Zone Systems for Improving Travel Conditions and Safety. (No. FHWA-OP-02-025). Washington, DC: Federal Highway Administration. 2. International Road Federation. (Apr 2000). Safety for workers. World Highways, 9, 6162. 3. Raub, R. A., Sawaya, O., Schofer, J. L., & Ziliaskopoulos, A. (February 2001). Traffic Control Systems in Construction Workzones (No. ITRC FR 97-5). Evanston, Illinois: Traffic Institute, Northwestern University. 4. Zhao, M., & Garber, N. J. (May 2001). Crash Characteristics at Work Zones (No. UVA/29472/CE01/100). Charlottesville, Virginia: University of Virginia, and Washington, DC: Department of Transportation. 5. Harbluk, J.L., Noy, I., and Eizenman, M. The impact of cognitive distraction on driver visual behaviour and vehicle control. Rep. No. TP 13889E. Transport Canada, Ottawa, Canada. 2002.http://www.tc.gc.ca/roadsafety/tp/tp13889/en/menu.htm 6. Strayer, D. L., Drews, F. A., & Johnston, W. A. (2003). Cell phone induced failures of visual attention during simulated driving, Journal of Experimental Psychology: Applied, 9, 23-32. 7. Recarte, M.A. and Nunes, L. Mental workload while driving: Effects on visual search. Journal of Experimental Psychology: Applied, 9(2), 119-137. 2003. 8. Lam, L. T. (2001). Distractions and the risk of car crash injury: the effect of drivers’ age. Journal of Safety Research, 33, 411–419. 9. Ishida, T., & Matsuura, T. (2001). The effect of cellular phone use on driving performance. IATSS Research, 25, 6-14. 10. Strayer, D. L., & Johnston, W. A. (2001). Driven to distraction: Dual-task studies of simulated driving and conversing on a cellular phone. Psychological Science, 12, 462466. 11. Baddeley A. D. A 3-minute reasoning test based on grammatical transformations. Psychological Science Vol. 10, 1968, pp.341-342 12. Alm, H. & Nilsson, L. (1990). Changes in Driver behaviour as a Function of handsfree Mobile Telephones: A Simulator Study. (Technical paper No. PB92153188). Springfield, VA: National Technical Information Service. 13. Nilsson, L., & Alm, H. (1991). Effects of mobile telephone use on elderly drivers' behavior - including comparisons to younger drivers' behavior. Gothenburg, Sweden, and DRIVE Project V1017 (BERTIE, Report No. 176), 1991. 14. Drummond, S., G. G. Brown, and J. S. Salamat, Brain regions involved in simple and complex grammatical transformations, Cognitive Neuroscience and Neuropsychology, Vol. 14, 2003, pp. 1117-1122. 15. Dingus, T. A., S. G., Klauer, V. L. Neale, A Petersen, S. E. Lee, J, Sudweeks, M. A. Perez, J. Hankey, D. Ramsey, S. Gupta, C. Bucher, Z. R. D. D. Doerzaph, Jermeland, J. and R. R. Knipling, R. R. The 100-Car naturalistic Driving Study Phase II-Results of the 100-Car Field Experiment, DOT HS 810 593, Washington, DC: National Highway Traffic safety Administration, April 2006.
TRB 2007 Annual Meeting CD-ROM
Paper revised from original submittal.