of an in-vehicle warning system under naturalistic driving conditions. Driver ..... It contains detailed driving data for 78 laypersons driving one of 11 instrumented.
UMTRI-2007-44
NOVEMBER 2007
WARNING RELIABILITY AND DRIVER PERFORMANCE IN NATURALISTIC DRIVING
JOHN M. SULLIVAN OMER TSIMHONI SCOTT BOGARD
WARNING RELIABILITY AND DRIVING PERFORMANCE IN NATURALISTIC DRIVING
John M. Sullivan Omer Tsimhoni Scott Bogard
The University of Michigan Transportation Research Institute Ann Arbor, Michigan 48109-2150 U.S.A.
Report No. UMTRI-2007-44 November 2007
Technical Report Documentation Page 1. Report No.
2. Government Accession No.
3. Recipient’s Catalog No.
UMTRI-2007-44 4. Title and Subtitle
5. Report Date
Warning Reliability and Driving Performance in Naturalistic Driving
November 2007 6. Performing Organization Code
7. Author(s)
8. Performing Organization Report No.
John M. Sullivan, Omer Tsimhoni, and Scott Bogard
UMTRI-2007-44
9. Performing Organization Name and Address
10. Work Unit no. (TRAIS)
The University of Michigan Transportation Research Institute 2901 Baxter Road Ann Arbor, MI 48109-2150 U.S.A
302753
11. Contracts or Grant No.
12. Sponsoring Agency Name and Address
13. Type of Report and Period Covered
The University of Michigan Industry Affiliation Program for Human Factors in Transportation Safety
14. Sponsoring Agency Code
15. Supplementary Notes
The Affiliation Program currently includes Alps Automotive/Alpine Electronics, Autoliv, Bendix, BMW, Bosch, Chrysler, Com-Corp Industries, Decoma Autosystems, Denso, FederalMogul, Ford, GE, General Motors, Gentex, Grote Industries, Hella, Honda, Ichikoh Industries, Koito Manufacturing, Lang-Mekra North America, Magna Donnelly, Muth, Nissan, North American Lighting, Northrop Grumman, OSRAM Sylvania, Philips Lighting, Renault, SABIC Innovative Plastics, Siemens VDO Automotive, Sisecam, SL Corporation, Stanley Electric, Toyota Technical Center USA, Truck-Lite, Valeo, Visteon/ACH, and 3M Personal Safety Products. Information about the Affiliation Program is available at: http://www.umich.edu/~industry/ 16. Abstract
The goal of this study is to examine how driver behavior is influenced by the reliability of an in-vehicle warning system under naturalistic driving conditions. Driver responses to lateral drift warnings were examined to determine if the latency to initiate a corrective steering response was related to prior system reliability. An operational definition of subjective reliability was developed based on measures of the proportion of lateral drift warnings that the drivers responded to in the 24-hour period preceding a warning event that elicited a steering correction (called the day proportion). Age, gender, weather condition, light level, road class, and day proportion were used to model response latency to make a steering correction in a linear model. A main effect of day proportion was found, suggesting that reaction time to respond decreases by about 300 msecs as the day proportion increases from 0 to 1. The study illustrates a method of quantifying subjective reliability and performance using naturalistic data. The results suggest that latency to make a steering correction is inversely related to the perceived reliability of the warning system in the 24 hours preceding the warning. 17. Key Words
18. Distribution Statement
Naturalistic driving, collision warning, lateral drift warning, reliability, false alarms, positive predictive value
Unlimited
19. Security Classification (of this report)
20. Security Classification (of this page)
None
None
21. No. of Pages
21
i
22. Price
Acknowledgements Appreciation is extended to the members of the University of Michigan Industry Affiliation Program for Human Factors in Transportation Safety for support of this research. The current members of the Program are: Alps Automotive/Alpine Electronics
Lang-Mekra North America
Autoliv
Magna Donnelly
Bendix
Muth
BMW
Nissan
Bosch
North American Lighting
Chrysler
Northrop Grumman
Com-Corp Industries
OSRAM Sylvania
Decoma Autosystems
Philips Lighting
Denso
Renault
Federal-Mogul
SABIC Innovative Plastics
Ford
Siemens VDO Automotive
GE
Sisecam
General Motors
SL Corporation
Gentex
Stanley Electric
Grote Industries
Toyota Technical Center, USA
Hella
Truck-Lite
Honda
Valeo
Ichikoh Industries
Visteon/ACH
Koito Manufacturing
3M Personal Safety Products
ii
Contents Acknowledgements......................................................................................................................... ii Contents ......................................................................................................................................... iii Introduction......................................................................................................................................1 Reliability...................................................................................................................................1 Low Base Rate Events and Reliability.......................................................................................3 Perceived Reliability, Time History, and Context .....................................................................5 Measurable Response Changes in Driver Performance.............................................................6 Analysis Overview...........................................................................................................................8 Method .............................................................................................................................................9 Subjects ......................................................................................................................................9 Dependent Measure ...................................................................................................................9 Measurement of Reliability......................................................................................................10 Results............................................................................................................................................12 Discussion ......................................................................................................................................15 References......................................................................................................................................17
iii
Introduction The goal of this study is to examine how driver behavior is influenced by the reliability of an in-vehicle warning system under naturalistic driving conditions. Such behavioral data may help inform the design of in-vehicle warning systems that may not be perfect in distinguishing a true warning condition from other less critical conditions. Naturalistic data from the road departure crash warning (RDCW) project (LeBlanc et al., 2006) were used to infer the effects of reliability on real-world driving performance. One advantage of a naturalistic dataset is that subjects are presented with a more realistic operation of the warning system than is possible in controlled experiments (e.g., BenYaacov, Maltz, & Shinar, 2002) or in a driving simulator (Bliss & Acton, 2003; Maltz & Shinar, 2004, 2007; Meyer, 2001). In such experiments, the rate of warnings is often accelerated, and subjects behave less naturally with an experimenter present in the back seat or nearby.
Reliability Reliability can be defined as the extent to which a system yields the same results on repeated trials. Thus, an outcome is said to be reliable if it is repeatable. A reliable in-vehicle warning system is one that provides alerts that are consistent over time such that a driver can expect or predict the system’s behavior. Reliability is not the same as correctness—a system can be reliably incorrect if it bases a warning on pre-crash features that, while obvious to a driver, may not always be predictive of a crash (or near crash). For example, a lateral drift warning (LDW) may incorrectly advise a driver that the vehicle is leaving the lane when in fact the lane markings on the roadway are improperly drawn. If the driver knows that the warnings are based on lane markings, the driver may come to understand the warning to mean that lines on the roadway are being crossed, not that a lane departure is about to occur. As long as the road features to which the alarm is responding are obvious to the driver, the alert may continue to be perceived by the driver as reliable even though it may be drawing incorrect conclusions about the vehicle’s actual lane position. If the driver is able to understand the basic competence of the warning system, the system might be perceived as reliable and understandably incorrect from time to time. However, even if a driver understands why an incorrect warning occurs, there is 1
probably a limit to the degree to which a driver will tolerate incorrect warnings under routine circumstances.
For example, if an LDW is sensitive to the slightest lane
deviation, drivers may eventually disregard the warning. LDW is a simple warning, and in many respects its operation may be more transparent to drivers than other warning systems. Drivers normally track lane position continuously as part of routine driving and are likely able to evaluate the operation of an LDW system. In contrast, other warning systems are designed to enhance a driver’s normal perceptual or attentional capabilities. They may detect unseen objects (e.g., a vehicle’s presence in the blind spot) or road conditions with precision that is beyond a driver’s normal ability (e.g., range or closing speed on a forward vehicle), or make judgments about complex traffic configurations (e.g., intersection gap acceptance) that may exceed a driver’s ability to quickly comprehend. In such cases, a warning may occur for no reason that is immediately apparent to the driver, unless the warning system also provides some explanatory information. For example, a lateral collision warning system may need to provide more precise warning messages about the radial direction of a threat so that a driver understands that the system occasionally mistakes stationary roadside objects for vehicles. Without an understanding of the system’s competence, drivers may perceive the warnings as inconsistent and unreliable. Although a system may be perfectly accurate in detecting dangerous road conditions (i.e., according to design), from the viewpoint of the driver it may appear to be producing unpredictable warnings without cause. A driver’s opinion about a warning system’s reliability may thus be negatively affected if it is difficult to understand the reason for a warning. Apart from the problem of subjective reliability, a system’s objective performance might be characterized by the kinds of objective warning errors it makes. There are two kinds of such errors. If a warning is given when the target condition is not present, it is considered to be a false positive (FP or false alarm). If a warning fails to be given when a target condition is present, it is called a false negative (FN or a miss). In collision warning systems, perceived reliability is likely to be based on the proportion of FP events to all warning events. The discrete nature of a warning event may prompt a driver to judge the appropriateness of the warning when a warning occurs; the correctness of a nonwarning event is unlikely to be noticed in the same way. Consequently, false positive
2
alerts (false alarms) are likely to be noticed by a driver, but false negatives—failures of an alert to occur when it should (i.e., a miss)—may not be noticed, especially if the condition is a priori difficult to perceive (e.g., presence of a vehicle in the blind spot). The possibility that perception of a warning system’s reliability is determined by the proportion of perceived false positive warnings among all the warnings generated raises the problem that a driver’s incomplete knowledge of the system’s operation can create an impression of unreliability. This situation is further aggravated if the warning system is designed to warn about exceedingly rare events. As will be discussed in the next section, even the most accurate of such warning systems is likely to generate more false positives than may be considered acceptable.
Low Base Rate Events and Reliability In general, warning systems are designed to minimize false negatives (misses— the probability of not warning when an event has occurred). Viewed another way, it is the same as maximizing the probability of reporting a warning when one truly exists (i.e., the hit rate). At the same time, another design goal is to minimize the number of false positive warnings (false alarms—the probability of warning when an event has not occurred). However, when the base rate of the target event—the rate of the event that the collision warning system is designed to address—is very small, even a system that has a very high hit rate and a very low false alarm rate may produce warnings that are predominantly false alarms (Parasuraman, Hancock, & Olofinboba, 1997). For example, suppose that a system generates a warning of a crash with 99 percent accuracy. When a crash situation arises, 99 times out of 100, the system will produce a warning. Also suppose that the warning system generates a false alarm 1 percent of the time. When there is no crash condition, 1 time out of 100, the system may produce a warning. If the base rate of the event is very small, say 1 in 100, half of the 198 warnings produced are false positives and half are true positives (shown in Figure 1). The proportion of true positive (TP) warnings to all warnings (TP + FP) is called the positive predictive value of a warning (PPV). The proportion of true negatives (TN) to all negatives (TN + FN) is called the negative predictive value (NPV).
3
With very small base rates, the PPV of a warning declines, presenting an increasing credibility problem for low probability events. In this paper, we use the term reliability to refer to PPV to be consistent with previous literature. Thus, if we assume a low base rate and exclude the subjective viewpoint of the driver, even a fairly accurate warning system is likely to have a low PPV. The problem of false positives (nuisance alarms) might be acceptable if the driver understands the reason for the warnings. However, as discussed earlier, warning systems are often designed to warn about circumstances that may be beyond a driver’s ability to detect or comprehend. This makes it nearly impossible for the driver to fully evaluate why the warning system generated a nuisance alarm (unless the system also supplies that information). The driver has no choice but to believe that the alarm is incorrect (as it often will be) without knowing exactly why. This is likely to contribute an additional component to the driver’s perception of system reliability.
Figure 1. This diagram illustrates the effect a low base rate has on proportion of true positive warnings (hits) to all warnings, or the positive predictive value (PPV) of a warning. Although the warning system’s capability to discriminate warning conditions is actually fairly good, the PPV is 50 percent. The negative predictive value in this example is exceedingly large (9801/9802 = 99.99 percent).
4
It is unclear whether the NPV of a warning system—the probability that a dangerous condition is not present when no warning occurs—plays a role in a driver’s perception of warning system reliability. In many cases, the driver may simply not notice that the warning system failed to warn about a potential collision event. More often, collision warning systems are designed with a bias to warn because the cost of failing to warn is high. Coupled with a low base rate that a warning condition is present, there may be too few nonwarning events where a threat is actually present to base perceived reliability on this type of warning failure.
Perceived Reliability, Time History, and Context The perceived reliability of a collision warning system (CWS) is subject to development and change over time. For example, at initial exposure to a CWS, drivers are likely to have some preconceived beliefs about the system’s reliability. During the initial learning period, drivers likely adjust their perceptions of system reliability as they learn more about the system. As drivers are exposed to more and more warnings (both true and false), further adjustments in perceived reliability are likely to occur. Drivers’ perception of the reliability of a warning system may wax with true warnings and wane with false warnings. There are also likely to be individual differences in the degree to which drivers are influenced by true and false warnings. Reliability may also be influenced by driving context. With specific knowledge about a warning system’s capabilities, drivers may learn to alter expectations about system performance in different driving conditions. For example, expectations about a lateral drift system may be different in wet weather compared to dry, or on smooth wellmarked roads versus in construction sites. Drivers might discount nuisance warnings in one context, and weigh them heavily in another context. The effects of time history, operating context, task workload, self-confidence, and trust contribute to a person’s use of automation and have been discussed by Lee and his colleagues (Gao & Lee, 2006; Lee & Moray, 1992, 1994; Lee & See, 2004), and by Parasuraman and Riley (1997). In the following analysis, some contextual influence may be observed as effects associated with light level, weather conditions, and road class.
5
Measurable Response Changes in Driver Performance A general problem faced by studies that attempt to link system reliability to driver performance is that objective system reliability may not match subjective reliability. In the case of LDW, subjective impressions of reliability may coincide with objective reliability because the operation of the warning system may be somewhat transparent to the driver. However, it is possible that a system might be perceived as unreliable even though its objective performance is completely reliable. To the extent that both the driver and the warning system share the same idea of what constitutes a threat, objective and subjective reliability should converge. It is assumed, in this case, that both the warning system and the driver have access to the same basic pre-crash data; in the example of LDW, that would be the vehicle’s position in the lane. To infer the effects of perceived reliability from driver performance, measurable performance characteristics are required that indicate changes in a driver’s reliance on or compliance with the system. Possible indicators may include the proportion of alerts ignored by a driver (indicative of false positives and a measure of subjective reliability) and the driver’s latency to respond to an alert. Low reliability may result in an increased latency to respond or outright ignoring of the alert.
High reliability may result in
decreased latency responses and few ignored alerts. Underlying these suggested effects is the relationship among calibration, resolution, and automation capability (Lee & See, 2004; Parasuraman & Riley, 1997). If drivers do not trust the system, they may calibrate their responses to ignore the system completely (i.e., disuse). On the other hand, if drivers place excessive trust in the system, they may misuse the system. An extreme example of this would be a driver who no longer actively monitors lane position and instead guides his/her vehicle by the LDW warnings. This may be measured as short, automatic, response times or an increased number of warning events. Finally, it should be mentioned that the influence of warning reliability on a driver’s performance is also dependent on workload. Under light workload, a driver may have sufficient “spare” capacity so that reliance on the warning system is minimal. If the driver is monitoring lane position assiduously, steering response may be independent of the warnings. Under heavy workload, drivers may be compelled to distribute their attention over several tasks, inducing them to rely on the lateral drift warning more
6
heavily. In this context, an unreliable warning may not only be unwelcome, but it may also be apportioned less attention, resulting in increased response delays (see Wickens & Dixon, 2005, for a discussion about the influence of reliability under high and low workload). Wickens and Dixon found in a meta-analysis of 20 studies that the effect of reliability on performance in high workload conditions is greater than in low workload conditions. A greater dependence on automation was found to be imposed by high workload situations. This could be revealed as an interaction between the reliability measure and high-workload conditions such that differences in reliability affect responses to LDW more when visibility is poor (e.g., at night or in wet weather) or when traffic is less predictable (e.g., on surface streets).
7
Analysis Overview The determination of how warning system reliability affects driving performance in naturalistic driving requires both a clear definition of the measure of warning reliability along with a measure of driver performance. For this analysis, we focused on the operation of the lateral drift warning (LDW) system (Pomerleau et al., 1999) used in the road departure crash warning (RDCW) field operational test (for details about the LDW operation see LeBlanc et al., 2006; Pomerleau et al., 1999 ). In naturalistic driving conditions, the pacing of warnings is more realistic, roadside events are less predictable, and driving is more purposeful than in a structured experiment.
Some of these
differences may affect the degree to which driving performance is influenced by warning reliability. The LDW system uses image analysis techniques and radar to determine whether the host vehicle is departing from the roadway.
Auditory or haptic warnings are
generated whenever the vehicle crosses a painted line, or road edge, or laterally veers toward a solid object alongside the road. Two kinds of alerts are generated: a cautionary alert when the vehicle crosses a dashed line and an imminent alert when the vehicle crosses a solid line or veers toward an object. The cautionary alert is a vibration on the left or right side of the driver’s seat (the same side as the lane deviation) with a cautionary message presented on a display; the imminent alert is an auditory warning with a warning message on the display. In this study, both imminent and cautionary warnings were considered together. Data were collected just after activation of the LDW system for each participating driver. It contains detailed driving data for 78 laypersons driving one of 11 instrumented test vehicles for a period of 26 days each. Both the LDW and curve speed warning (CSW) systems were activated on the seventh day of driving and remained active for 20 days following activation. These 20 days of driving data are the basis of the present analysis.
8
Method Subjects The 78 participants were equally divided into three age groups: 26 young (20 to 30 years old), 26 middle-aged (40 to 50 years old), and 26 older (60 to 70 years old) subjects. Each group was evenly split by gender.
Dependent Measure In this study, the driver’s response was defined as the time taken to initiate a corrective action after a warning is given. In the case of LDW, that would be the delay between an LDW and the driver’s steering correction to adjust the vehicle’s lane position away from the lane edge. The start of the corrective maneuver was determined by examining the rate of change in the steering wheel angle during a time window that began three seconds before the warning and ended three seconds after it.
The
computational procedure first eliminated any fixed offset errors in the steering wheel angle measurement by subtracting the steering wheel angle offset found during straight driving. Steering wheel angle was then converted to steering rate-of-change. Steering rate-of-change was examined for events that exceeded a ±3 deg/sec threshold within a six-second time window that was centered on the time of an LDW warning.
The
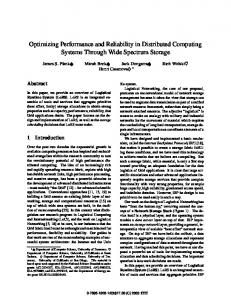
resulting algorithm identified the start times of relatively abrupt steering activity in the direction opposite of the warning around the time of an LDW. An example of the resulting steering response detection algorithm is shown in Figure 2. It shows a steering response preceding a warning, and another steering response following a warning. The primary response measure, the latency to respond to an LDW, was calculated as the time delay between the warning and the detected start of a corrective steering response. Nonresponses and steering responses that involved lane changes were excluded from this analysis. The LDW system often delivered a warning after a driver’s corrective steering action was underway (i.e., in the three seconds preceding the warning). There are also cases in which the steering action was initiated within 200 ms after the warning was produced. In both the former and the later cases, it is unlikely that the driver was actually
9
responding to the LDW, but rather was taking independent action to correct a selfmonitored lateral drift. Thus, for each LDW, a driver could be characterized as either (1) not producing any steering response in the six-second window around the warning, (2) responding with a steering correction too early for it to be considered a reaction the warning, or (3) responding in the 200-3000 ms interval after the warning. The reaction time for the third option was the dependent variable in this analysis. 30
Pre-alert response
Alert
5
Post-alert response 4
3 10 2 0 1
Steering wheel angle -10
Lane Offset (m)
Steering Wheel Angle (deg)
20
0 -20
Lane offset
-1
-30
-2 590
592
594
596
598
Seconds
Figure 2. This plot shows the detected steering response around the time of an LDW. The pre-alert steering response (inside the gray band on left) identifies an abrupt steering response that preceded the LDW. The post-alert steering response (inside the gray band on right) identifies the time of an abrupt steering response that follows an LDW.
Measurement of Reliability In the case of the LDW system discussed in this report, objective measures of system reliability were not readily available. Even if such measures were available, it is possible that they might not fully agree with the driver’s perceived reliability of the system. Instead, a surrogate measure of perceived reliability was developed which was defined as the proportion of LDW warning events in which a lane-position correction was initiated by the driver near the time of the warning. An LDW event was identified as a
10
false positive if no steering response was observed within the six-second time window surrounding the warning. It was considered a correct detection (a hit) if any appropriate steering response occurred (i.e., a brisk steering response in the direction away from the lateral drift), including responses that preceded the warning. This was based on an assumption that a driver would regard the warning as reliable as long it occurred in close temporal proximity to an actual condition that would require a steering correction. That is, the driver might have a more relaxed view of the appropriateness of the warning timing, and may not regard a late warning as a false alarm. LDW reliability was then characterized by the ratio of true positive warnings to the total number of warnings. As mentioned earlier, negative predictive value played no role in the reliability measure. Perceived reliability may also have a dynamic/historic characteristic that might change over the course of the study. It was therefore modeled as a time-based predictor of steering response latency.
For each driver’s steering response to a warning, a
perceived reliability measure was calculated for that response.
The measure was
calculated as the proportion of LDW warnings that elicited a steering response over the previous 24-hour period—the day proportion. If the perceived reliability of the warning influences driving behavior, we might expect to observe it in the driver’s latency to initiate a steering correction. Similar effects on response time have been reported with respect to driver braking (e.g., Bliss & Acton, 2003) and it is reasonable to expect that steering responses may be affected in similar ways. Three variables were also examined as surrogate workload manipulations: weather condition (clear/active precipitation), ambient light level (dark/light), and road class (limited access/surface roadways). Driver workload is likely to be higher during times of active precipitation and in darkness when visibility is reduced, and on local roads where there is often little separation between vehicle traffic and pedestrian activity. Age and gender were also examined to determine if response time to LDWs are influenced by these factors. Driver age was classified into three categories: young (20 to 30 years old), middle (40 to 50 years old), and old drivers (60 to 70) years old.
11
Results In the three-week interval examined in this report, driver age groups differed in the number of times a warning was given: the mean total warning count was 58 for younger drivers, 53 for middle-aged drivers, and 28 for older drivers, F(2,75) = 3.9, p = .02. Drivers with fewer than 10 responses to the LDW were excluded from these analyses and, as mentioned earlier, cases in which a post-warning steering response occurred less than 200 ms after the warning were also excluded. Finally, cases in which a steering response was preceded by another steering response (i.e., before the warning) were also excluded from the analysis. In these cases, the driver is already engaged in a corrective steering maneuver and the driver’s action is unlikely to have been instigated by the warning system. Of the original 78 drivers in the study, 42 drivers remained in the sample after the above filtering procedures were applied. The filter affected older drivers more than it affected the other age groups. Table 1 shows the final breakdown of subjects by age and gender. Table 1 Breakdown of number of drivers by age and gender with 10 or more responses to the LDWs. The mean number of responses for the three-week observation period is given in parentheses. Age
Male
Female
Total
Young Middle Old Total
7 (12.6) 9 (16.1) 5 (9.0) 21 (13.2)
9 (15.7) 7 (11.0) 5 (14.2) 21 (13.8)
16 (14.3) 16 (13.9) 10 (11.6) 42 (13.5)
12
A mixed-model analysis of variance examined the effects of two categorical between-subject factors—age group (young, middle, older) and gender (male, female)— and three categorical within-subject factors—ambient light levels (dark, light), windshield wiper state (off, on), and road class (limited access, surface streets)—on steering response latency.
In addition, each subject’s day proportion measure of
reliability was included in the analysis as a within-subject covariate. Drivers whose prior 24 hours experience of the LDW system involved proportionally higher responses to warnings also displayed shorter reaction times, F(1, 325) = 4.34, p < .05 (shown in Table 2). The estimated slope of reaction time as a function of reliability was -323 ms; that is, as the percentage of steering responses to LDW over the prior 24 hours increases from 0 to 100 percent, reaction time is projected to decrease by 323 ms. Table 2 Results of a mixed-model ANOVA relating steering reaction time to gender, age, wiper state, light level, road class, and day-ratio. The asterisk indicates statistical significance at .05 level. Effect
F-Ratio
p
Gender Age Group Wiper State Light Level Road Class Day Proportion
F(1,28.3) = 0.58 F(2,24.4) = 2.83 F(2, 324) = 0.96 F(1,31.6) = 0.32 F(1,82.3) = 0.76 F(1,325) = 4.34
.45 .08 .38 .57 .47 .04*
A marginal effect of age group was also observed in the data (see Table 2). This was further explored by simplifying the model to drop some factors that are likely to be correlated with age. For example, older drivers appear to be less inclined to drive in darkness, in bad weather, and on limited access roadways than younger drivers (Baldock, Mathias, McLean, & Berndt, 2006; Ball et al., 1998; Langford & Koppel, 2006). Thus the variables light level, road class, and wiper state in the present analysis may be related to age, absorbing some of the explanatory effects of age on response. If these factors are removed from the analysis, a main effect of driver age is observed, F(2, 479) = 5.17,
13
p < .01. The older driver group is faster to respond to the warning than the younger drivers by about 354 ms, t(479) = 3.15, Bonferroni adjusted p < .01, and faster than the middle-aged group by about 295 ms t(479) = 2.63, Bonferroni adjusted p = .03. Perhaps the age factor should be considered a cluster of behavioral patterns that include preferences for roadway, daylight, and clear weather, as well as a possibly more compliant attitude that results in faster responding to the LDW system.
14
Discussion The present results suggest that there is a relationship between a driver’s prior experience of the LDW warning system in the 24 hours before a responded to warning and the speed of that response. Drivers appear to respond faster if the prior warnings are perceived to be reliable. It is important to note that this result is not exhibited by all drivers in the study, and that it is a correlational outcome. That is, perceived reliability was not directly manipulated in the study. It is also important to remember that the definition of reliability used here is nonstandard. It is neither an objectively defined measure nor a directly manipulated measure and may not be easily comparable to other studies in which reliability is directly manipulated. Indeed, in the analysis of naturalistic driving, direct manipulation of variables is often not feasible and control over the analysis is imposed by selection of “relevant” conditions. The derived reliability measure should not be mistaken for an independent variable and its relationship to steering response latency could be mediated by other variables that were not measured. It is also worth noting that these data do not include nonresponses to alerts, because a nonresponse could mean either that a driver ignored a true warning or dismissed the warning as false. Despite these limitations, it is the first evidence that driving performance may be related to the reliability of prior warnings found in a naturalistic driving dataset. The observed effect on driver performance is relatively weak. The observed difference in steering latency between a warning system with zero percent and 100 percent reliability is about 300 ms. Given that warning reliability normally varies in a much smaller range, actual behavioral effects are likely to be much smaller. This may not be surprising. Ben-Yaacov, Maltz, and Shinar (2002) have reported no effect of reliability with a headway warning system in a semi-realistic driving study where reliability varied between 60 and 95 percent. (In the present study, the averaged day proportions among drivers ranged between 37 and 100 percent, with a mean of 77 percent.) This is somewhat different from results reported in simulator studies. For example, Bliss and Acton (2003) reported that increased reliability increases the frequency and appropriateness of reactions to warnings. However they also found that
15
the collision rate was smaller in their lowest reliability condition, attributing it to the potentially distracting effect of the high urgency warnings used in the study. Unlike many recent studies of reliability, the present method allows for the possibility that a driver’s perception of reliability is influenced by immediate past experience with the system. Stated another way, this method attempts to associate performance with a near-term measure of reliability, allowing for the possibility that perceived reliability may vary over time. This view is related to previous theoretical work on trust in automation that suggests trust evolves and is influenced by past experience with the system operation. Trust, in turn, influences how (and if) an operator will engage automation (Gao & Lee, 2006; Lee & Moray, 1992, 1994; Lee & See, 2004; Parasuraman & Riley, 1997). It is important to note that, in this study, no baseline data are available that describes driver performance in the absence of the LDW system. What is shown is a relationship between a measure of reliability and the driver’s latency to react with a steering correction.
Thus, cost and benefit of the LDW system cannot easily be
determined as in other collision warning studies (e.g., Wickens & Dixon, 2005). The most important contribution of the present study is that it examines driver behavior outside of a well-structured experimental context in which warning events are relatively frequent and scripted, participants are willing and compliant, safety is guaranteed, and the possibility that demand characteristics may influence observations is ever-present. The present study provides a realistic view of how the reliability of one kind of warning system influences the latency to initiate a compliant response.
16
References Baldock, M. R. J., Mathias, J. L., McLean, A. J., & Berndt, A. (2006). Self-regulation of driving and its relationship to driving ability among older adults.
Accident
Analysis and Prevention, 38(5), 1038-1045. Ball, K., Owsley, C., Stalvey, B., Roenker, D. L., Sloane, M. E., & Graves, M. (1998). Driving avoidance and functional impairment in older drivers. Accident Analysis and Prevention, 30(3), 313-322. Ben-Yaacov, A., Maltz, M., & Shinar, D. (2002). Effects of an in-vehicle collision avoidance warning system on short- and long-term driving performance. Human Factors, 44(2), 335-342. Bliss, J. P., & Acton, S. A. (2003). Alarm mistrust in automobiles: how collision alarm reliability affects driving. Applied Ergonomics, 34(6), 499-509. Gao, J., & Lee, J. D. (2006). Extending the decision field theory to model operators' reliance on automation in supervisory control situations. IEEE Transactions on Systems Man and Cybernetics Part A-Systems and Humans, 36(5), 943-959. Langford, J., & Koppel, S. (2006). Epidemiology of older driver crashes - Identifying older driver risk factors and exposure patterns. Transportation Research Part FTraffic Psychology and Behaviour, 9(5), 309-321. LeBlanc, D., Sayer, J., Winkler, C., Bogard, S., Devonshire, J. Mefford, M., Hagan, M., Bareket, Z., Goodsell, R., & Gordon, T. (2006). Road departure crash warning system field operational test: methodology and results. Volume 1: Technical Report. (Technical Report No. UMTRI-2006-9-1). Ann Arbor: University of Michigan Transportation Research Institute. Lee, J. D., & Moray, N. (1992). Trust, control strategies and allocation of function in human machine systems. Ergonomics, 35(10), 1243-1270. Lee, J. D., & Moray, N. (1994). Trust, self-confidence, and operators’ adaptation to automation. International Journal of Human-Computer Studies, 40(1), 153-184. Lee, J. D., & See, K. A. (2004). Trust in automation: Designing for appropriate reliance. Human Factors, 46(1), 50-80. Maltz, M., & Shinar, D. (2004).
Imperfect in-vehicle collision avoidance warning
systems can aid drivers. Human Factors, 46(2), 357-366. 17
Maltz, M., & Shinar, D. (2007).
Imperfect in-vehicle collision avoidance warning
systems can aid distracted drivers. Transportation Research Part F, 10(4), 345357. Meyer, J. (2001). Effects of warning validity and proximity on responses to warnings. Human Factors, 43(4), 563-572. Parasuraman, R., Hancock, P. A., & Olofinboba, O. (1997). Alarm effectiveness in driver-centred collision-warning systems. Ergonomics, 40(3), 390-399. Parasuraman, R., & Riley, V. (1997). Humans and Automation: Use, misuse, disuse, abuse. Human Factors, 39(2), 230-253. Pomerleau, D., Jochem, T., Thorpe, C., Batavia, P., Pape, D., Hadden, J., McMillan, N., Brown, N., & Everson, J. (1999). Run-off-road collision avoidance using IVHS countermeasures.
(Final Report No. DOT HS 809 170).
Washington, DC:
National Highway Traffic Safety Administration. Wickens, C. D., & Dixon, S. R. (2005). Is there a magic number 7 (to the minus 1)? The benefits of imperfect diagnostic automation: a synthesis of the literature. (Technical Report No. AHFD-05-01/MAAD-05-1). Savoy, IL: Aviation Human Factors Division Institute of Aviation, University of Illinois at UrbanaChampaign.
18