Department of Automatic. Kaunas University of Technology. Kaunas, Lithuania. Gediminas Žylius. Joint Stock Company âRMD Technologiesâ. Kaunas, Lithuania.
Driving Style Classification using Long-Term Accelerometer Information Vygandas Vaitkus and Paulius Lengvenis
Gediminas Žylius
Department of Automatic Kaunas University of Technology Kaunas, Lithuania
Joint Stock Company “RMD Technologies” Kaunas, Lithuania
Abstract—Driving style can be characteristically divided into normal and aggressive. Related researches show that useful information about driving style can be extracted using vehicle’s inertial measurement signals with the help of GPS. However, for public transportation the GPS sensor isn’t necessary because of repetition of the route. This assumption helps to create low-cost intelligent public transport monitoring system that is capable to classify aggressive and normal driver. In this paper, we propose pattern recognition approach to classify driving style into aggressive or normal automatically without expert evaluation and knowledge using accelerometer data when driving the same route in different driving styles. 3-axis accelerometer signal statistical features were used as classifier inputs. The results show that aggressive and normal driving style classification of 100% precision is achieved using collected data when driving the same route.
events for classifying two different driving styles. Their experiment also shows a high correlation between vehicle inertial measurements and direct vehicle control signals (steering wheel angle, brake/acceleration pedal operation). C. Miyajima et al. [3] in their research use longitudinal, lateral acceleration and velocity signals captured in drive recorders for the driver risk analysis. They compared experimental results with the risk scores estimated by experts and showed that some correlation exists. A. Aljaafreh et al. [4] propose a driving performance inference system based on the signature of acceleration in two dimensions and speed. Fuzzy system is used to distinguish between aggressive and normal driving styles. V. Manzoni et al. [5] evaluate driving style economy considering fuel consumption using mathematical modeling and information acquired from inertial signals and speed from GPS. The authors also show that 20% of economy index (that indicates fuel consumption) difference is observed comparing several public transport drivers. This experiment approves that the potential of public transport fuel consumption optimization exist. Pattern recognition approach is taken in Y. Zhang et al. [6] research study. Researchers use driver’s steering behaviour, i.e., the coefficients of the discrete Fourier transform (DFT) of the steering wheel angle, to identify the driving skill level. Results show that difference between expert and beginner drivers exist in frequency domain. The experiment was done using driving simulator. M. R. Othman et al. [11] and Y. L. Murphey et al. [12] present jerk analysis (first derivative of acceleration signal) that also could give good results for classification of driving style. The latest researches in this area show the tendency of using smartphones or tablets as a sensor platform instead of conventional vehicle CAN-bus sensor information. A. Sathyanarayana et al. [7] compare driving maneuver recognition results using both CAN-bus and tablet information and show that using smartphone sensor information one can obtain better results (about 15% classification accuracy increase) than CAN-bus sensor information. However, the analysis was done using mostly different signals so the results don’t take into account the quality of the signals, but more likely the quantity (off-the-shelf tablets have more sensors than conventional CAN-bus connects). D. A. Johnson, M. M. Trivedi [8] created the system called MIROAD that uses Dynamic Time Warping (DTW) and smartphone based sensor-fusion (accelerometer, gyroscope, magnetometer, GPS,
Index Terms—Vehicle driving, intelligent vehicles, pattern recognition, accelerometer.
I.
INTRODUCTION
There are many researches done on driving behaviour, style and skill estimation. Despite the difference between concepts, information-carrying signals collected are the same: driver, vehicle or environment signals. The results obtained from one study are closely related to another. In our work we consider aggressive driving style to be both fuel-consuming and unsafe. In contrast to aggressive driving we consider normal driving style. In our research we used inertial measurements of the vehicle, i.e., 3-axis accelerometer. This sensor is low-cost and ubiquitous (because of various smart devices). The research studies have shown that accelerometer captures driving style, skill and driving behaviour information. T. Krotak, M. Simlova [1] in experiment show that dynamic driver behaviour information could be gathered from the longitudinal and lateral acceleration signals: the features of the signal significantly differ comparing expert and beginner drivers, also the significant difference is observed comparing concentrated versus distracted (i.e., speaking phone) driver on the same road track. M. V. Ly et al. [2] in experiment use driving event (turn, acceleration and braking) features for driver classification. The features are extracted from gyroscope and accelerometer signal segments of driving
978-1-4799-5081-2/14/$31.00 ©2014 IEEE
641
video) to detect, recognize and record aggressive driving actions. M. Fazeen et al. [9] use the 3-axis accelerometer and GPS of an Android-based smartphone to record and analyze various driver behaviors and external road conditions. R. Araujo et al. [10] in experiment use smartphone to evaluate driving-efficient patterns to form a feedback as an eco-driving advice to the driver. Authors obtain CAN-bus speed, acceleration, altitude, throttle, instant engine fuel consumption, engine rotation signals using bluetooth adapter and processes them in the smartphone. The aim of the urban public transport companies are highquality and cost-effective transportation because they have to compete with private transporters which are faster, more accessible and more convenient in most cases. The local urban public transport company is research initiator and customer of the product, which will classify the drivers according to the driving quality. Based on the driving quality evaluation the drivers will be ranked. Worst drivers will be send on additional training and best drivers encouraged with monthly salary rising. It is possible to buy such kind of systems but they are too expensive and not appropriately tested in practice. After the exhaustive research it was found that most of the researches and developers had a purpose to create a real-time safety or other driving estimation systems. They try to recognize driving events, segment the signal further evaluating features given to those events or signal segments in real-time. Such systems require huge computing capacity often requires connection to vehicle electrical components and this is not acceptable to the customer, because he wants a portable system that is easy to install and are invisible to the driver. Driver must be aware that driving quality evaluation system is installed in the bus. Depending on the requirements it was decided to develop the embedded system for driving data collection based on microprocessor and accelerometer. Physical size of the system is very small, and this allows it to be installed in various locations of the bus. Data could be read at the end of the route or day from the SD memory card. This paper only considers the public transport and the repeatability of the route. And we try to classify the driving style directly obtaining various features from the whole signal of the same route instead of its segments. This research is further divided in to signal processing, feature extraction, feature selection and classification results sections. II.
comparison of statistical central characteristic (i.e., medians) between windows was done. Normal driving
Acceleration amplitude
500
400
300
200
100 0.2
0.4 0.6 0.8 1 1.2 Data point number Lateral Vertical Longitudinal Aggressive driving
1.4
1.6
1.8
2 4
x 10
Acceleration amplitude
500
400
300
200
100 2000
4000
6000 8000 10000 Data point number
12000
14000
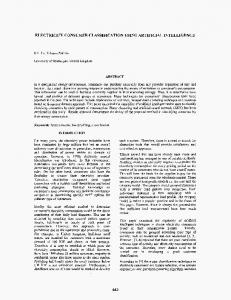
Fig. 1. Raw 3-axis accelerometer data, obtained from car when driving same track in aggressive and normal driving style.
After extraction of the useful data (signal period when the vehicle is moving), removing various high frequency components (one discrete data point width) peaks and outliers is necessary for several features that will be extracted. In this case a robust local regression technique was used with 5 data point window. In further section, we use processed data for several feature calculation and extracted data (without the redundant stop period data after track completion) for others. III.
FEATURE EXTRACTION
The features in time domain are extracted from all three accelerometer signals (lateral, longitudinal and vertical acceleration). Various features keep various quantities of useful information about driving style. Also, it is unknown what set (quantity and type) of features most accurately separate the driving styles. So it was decided to extract almost all possible features from time domain and then use a feature selection method for selection of the most informative set. The statistical features calculated are: • central characteristics (mean, median, mode); • dispersion characteristics (variance, interquartile range, mean absolute deviation, median absolute deviation, standard deviation, range); • minimum and maximum values; • histogram extent characteristics (skewness, kurtosis, 3rd and 4th statistical moments);
DATA PROCESSING
Data processing was done in order to make signal suitable for feature extraction task. Figure 1 illustrates the 3-axis accelerometer example data of aggressive and normal driving. The acceleration type is shown in the legend. Because we use only accelerometer and no other sensors, first we must extract useful signal from whole original signal which is driving period between beginning and ending of the trip (when the vehicle is moving). Extracted signal is used for analysis excluding redundant data (which is generated at the beginning and after completion of the track when the vehicle is not moving). For this reason, sliding window was used and
642
•
Kendall’s tau rank correlation coefficient between each pair of acceleration signals; • covariance between each pair of acceleration signals; • criteria of data threshold violation (DTV); • difference between reference and ordinary driving histograms; • polynomial parameters identified after approximation of inverse cumulative density histogram. Above described statistical features can be calculated by using a variety of software applications, but last three of them will be described in more detail. Data threshold violation (DTV) was calculated by selecting minimum and maximum bounds according to reference normal driving style processed signal minimum and maximum values. The threshold violation ratio was selected as a feature, calculated as the number of times N1 the data exceed bounds divided by the overall data length N, which is calculated as DTV =
N1 . N
The values of the differences between reference normal (or aggressive) histogram and experimental driving histograms bin height were calculated. Sum of calculated absolute differences were selected as one feature and the covariance between reference difference values (calculated difference values between reference normal driving and typical aggressive driving) and experimental difference values was used as another feature. The differences were calculated when histogram density values were centred according to maximum covariance values also when no centring is applied (differences calculated directly like in Fig. 3). The crosscovariance algorithm was used and the histogram density value arrays (assuming no relation between acceleration amplitudes) were centred according to maximum covariance between them. Furthermore, we approximate inverse cumulative density histogram by polynomials and use approximating polynomial parameters as other features. We believe that those parameters pn+1-i contain discriminative information for driving classification. Approximating nth order polynomial model is
(1)
Figure 2 illustrates an example of boundary selection using reference normal driving compared to typical aggressive driving of longitudinal acceleration. Figure 3 illustrates how normal and aggressive driving histograms of longitudinal acceleration differ from each other. Because the signal has only integer values so the bin widths of histograms were used as integer values of acceleration amplitude.
y=
i=0
Acceleration amplitude
350
Aggressive driving Reference normal driving Boundaries of DTV feature
2000
4000
6000 8000 10000 Data point number
12000
14000
(2)
In research 39 features are calculated for each of three acceleration signals, which conclude 117 features over all. To create all possible sets of features and evaluate their significance is very expensive in relation to computing costs, so in order to find the most discriminative features Student’s ttest was performed. This test allows sorting all features according to their discriminative capability. After sorting a classification is performed using sorted features adding one by one to feature set and calculating misclassification error.
400
0
x n +1− i .
FEATURE SELECTION
IV.
450
250
n +1− i
3rd, 4th, 5th degree polynomial parameters were used as features. The approximation was done using least-squares method.
500
300
n +1
∑p
16000
1
Fig. 2. Longitudinal processed data boundaries calculated from reference normal driving. Violations are observed when driving in aggressive style.
0.9 0.8
0.07
0.7
Aggressive driving Normal driving
CDF value
0.06
Density
0.05
0.6 0.5 0.4
0.04
0.3 0.03
0.2 0.1
0.02
0 0.01
0 250
300
350 400 450 Acceleration amplitude
500
0
0.1
0.2
0.3
0.4
0.5 p-value
0.6
0.7
0.8
0.9
1
Fig. 5. p-value cumulative density function. When 5% hypothesis’ significance level is chosen, there are more than 10% of all features that have high discriminative capabilities.
550
Fig. 3. Density histograms. Longitudinal acceleration density histogram comparison between aggressive and normal driving experiments.
643
transport routes of several tracks and analyse driving style. This type of system could be route-independent (because a route consists of small parts from station to station and these small parts repeat in several routes). The system also should take into account various road conditions such as traffics, seasons, working hours, celebration days, weekends, vehicle parameters etc. Also, fuel economy index calculation will be investigated in order to classify drivers according fuel consumption. This kind of system could be used not only for driving style analysis, but for sophisticated public transport monitoring system, which could evaluate road conditions in various time periods and seasons that could be useful for traffic forecasting, also for various analysis that could increase comfort and fuel economy of public transport.
Figure 5 shows the discriminative capability in p-values, the lower the p-value the more discriminative the feature is. We use 0.05 p-value significance level, which means that features that have p-value less than 0.05 are considered having high discriminative capabilities. Experimental results (Figure 5) showed that more than 10% of all features have high discriminative capability. Those features were selected and sequential forward feature selection (SFFS) was performed in order to obtain subset of most discriminative features. The correlation of features problem assumed to be not important because SFFS with cross-validation is performed and even if the subset of correlated features improves classification, this subset is selected. V.
CLASSIFICATION RESULTS
REFERENCES
For driving style classification k-nearest neighbours classification algorithm was used. This algorithm classifies test sample according to majority votes of k-nearest neighbour, i.e., the sample is classified to that class which has the majority votes. For experimental investigation 110 route driving samples were provided by urban public transport system. An experiment labels were defined by an expert investigation of the route signals. For testing it was used cross-validation to evaluate classification accuracy and average over the classification results. Experimental investigation showed that maximum (100%) classification precision is achieved using following features: • Mean of longitudinal acceleration; • Mean of vertical acceleration; • Median of vertical acceleration; • Covariance between longitudinal and lateral acceleration; • Three 5th order polynomial coefficients after inverse cumulative density histogram approximation. VI.
[1]
T. Krotac, M. Simlova, “The Analysis of the Acceleration of the Vehicle for Assessing the Condition of the Driver”, Intelligent Vehicles Symposium, Alcalá de Henares, Spain, June 3–7, 2012. pp. 571–576. [2] M. V. Ly, S. Martin, M. M. Trivedi, “Driver Classification and Driving Style Recognition using Inertial Sensors”, Intelligent Vehicles Symposium, Gold Coast, Australia, June 23–28, 2013. pp. 1040–1045. [3] C. Miyajima, H. Ukai, A. Naito, H. Amata, N. Kitaoka, K. Takeda, “Driver Risk Evaluation based on Acceleration, Deceleration, and Steering Behavior”, IEEE International Conference on Acoustics, Speech, and Signl Processing, Prague, Czech Republic, May 22–27, 2011. pp. 1829–1832. [4] A. Aljaafreh, N. Alshabatat, M. S. N. Al-Din, “Driving Style Recognition using Fuzzy Logic”, IEEE International Conference on Vehicular Electronics and Safety, Istanbul, Turkey, July 24–27, 2012. pp. 460–463. [5] V. Manzoni, A. Corti, P. D. Luca, S. M. Savaresi, “Driving Style Estimation via Inertial Measurements”, 13th International IEEE Annual Conference on Intelligent Transportation Systems, Madeira Island, Portugal, September 19–22, 2010. pp. 777–782. [6] Y. Zhang, W. C. Lin, Y.-K. S. Chin, “A Pattern-Recognition Approach for Driving Skill Characterization”, IEEE Transactions on Intelligent Transportation Systems, vol. 11, no. 4, pp. 905–916, December, 2012. [7] A. Sathyanarayana, S. O. Sadjadi, J. H. L. Hansen, “Leveraging Sensor Information from Portable Devices towards Automatic Driving Maneuver Recognition”, 15th International IEEE Conference on Intelligent Transportation System, Anchorage, Aliaska, USA, September 16–19, 2012. pp. 660–665. [8] D. A. Johnson, M. M. Trivedi, “Driving Style Recognition using a Smartphone as a Sensor Platform”, 14th International IEEE Conference on Intelligent Transportation Systems, Washington, DC, USA, October 5–7, 2011. pp. 1609–1615. [9] M. Fazeen, B. Gozick, R. Dantu, M. Bhukhiya, M. C. Gonzalez, “Safe Driving using Mobile Phones”, IEEE Transactions on Intelligent Transportation Systems, vol. 13, no. 3, pp. 1462–1468, September 2012. [10] R. Araujo, A. Igreja, R. de Castro, R. E. Araujo, “Driving Coach: a Smartphone Application to Evaluate Driving Efficient Patterns”, Intelligent Vehicles Symposium, Alcala de Henares, Spain, June 3–7, 2012. pp. 1005–1010. [11] M. R. Othman, Z. Zhang, T. Imamura, T. Miyake, “A Study of Analysis Method for Driver Features Extraction”, IEEE International Conference on Systems, Man and Cybernetics, October 12–15, 2008. pp. 1501–1505. [12] Y. L. Murphey, R. Milton, L. Kiliaris, “Driver’s Style Classification using Jerk Analysis”, IEEE Symposium on Computational Intelligence in Vehicles and Vehicular Systems, Nashville, TN, USA, March 30–April 2, 2009. pp. 23–28.
CONCLUSIONS
Accuracy of 100% is achieved using only 7 of all 117 features. The interesting observations are that 98% accuracy is achieved using only central characteristics (mean and median) of the longitudinal and vertical acceleration. Need to be mentioned, that experimental driving samples were obtained in the same season, traffic conditions and on the same route, this might cause that driving samples were too easy separable. However for our application purpose the results show that feature extraction of the whole signal on the same track instead of dynamic feature extraction of the signal segments could be used to classify aggressive and safe driving with high accuracy. This type of analysis of the whole track signal is applicable to public transport, because routes consist of several or more tracks that are repetitive. In the future works the track automatic segmentation will be used by using more signals to decompose various public
644