Z. Jiang, C. Xie, T. Ji, X. Zou: Dwell Time Modelling and Optimized Simulations for Crowded Rail Transit Lines Based on Train Capacity
ZHIBIN JIANG, Ph.D. E-mail:
[email protected] CHAO XIE, M.A. (Corresponding author) E-mail:
[email protected] TINGTING JI, M.A. E-mail:
[email protected] XIAOLEI ZOU, Ph.D. E-mail:
[email protected] Tongji University, School of Transportation Engineering, Key Laboratory of Road and Traffic Engineering of the Ministry of Education, Shanghai 201804, China
Transport Enginering Preliminary Communication Submitted: Mar. 6, 2014 Approved: Mar. 24, 2015
DWELL TIME MODELLING AND OPTIMIZED SIMULATIONS FOR CROWDED RAIL TRANSIT LINES BASED ON TRAIN CAPACITY
ABSTRACT Understanding the nature of rail transit dwell time has potential benefits for both the users and the operators. Crowded passenger trains cause longer dwell times and may prevent some passengers from boarding the first available train that arrives. Actual dwell time and the process of passenger alighting and boarding are interdependent through the sequence of train stops and propagated delays. A comprehensive and feasible dwell time simulation model was developed and optimized to address the problems associated with scheduled timetables. The paper introduces the factors that affect dwell time in urban rail transit systems, including train headway, the process and number of passengers alighting and boarding the train, and the inability of train doors to properly close the first time because of overcrowded vehicles. Finally, based on a time-driven micro-simulation system, Shanghai rail transit Line 8 is used as an example to quantify the feasibility of scheduled dwell times for different stations, directions of travel and time periods, and a proposed dwell time during peak hours in several crowded stations is presented according to the simulation results.
KEY WORDS dwell time; train capacity; train delay; timetable simulation; rail transit; passenger volume;
1. INTRODUCTION Rail transit transport plays a crucial role in urban cities. With the rapid development of rail transit lines in China, passenger volume has quickly increased. Currently, because of the limited capacity of facilities and the lack of rolling stocks, various rail transit lines
in Shanghai (also in Beijing, Guangzhou and other cities in China) are operating close to maximum capacity, and the trains are overcrowded with passengers during peak periods. This phenomenon, where passengers are unable to board the first arriving train with a high load factor, often occurs in these cities. Furthermore, in some stations, overcrowded vehicles prevent train doors from properly closing on the first attempt (the DNCF phenomenon). Dwell time and the process of passenger alighting or boarding are interdependent through the sequence of train stops and propagated delays. To minimize train dwell delays caused by large passenger volume, many rail transit stations in Shanghai (also in Beijing and Guangzhou) have adopted several methods to prevent passengers from entering the platform during peak periods, such as closing the exit or fare gate in the stations and setting handrails outside of the stations. Assessing the relationship between train operations and passenger behaviour is a complex task because passenger volume is extremely large and the distribution of passengers in time and space is relatively unbalanced. Additionally, the exact number of passengers able to board crowded rail lines and the duration of train delays are usually unknown. Therefore, a comprehensive and feasible dwell time simulation model was developed from the perspective of passengers and trains. Additionally, the number of alighting and boarding passengers, the train load factor, and the phenomenon of DNCF will be considered in this paper. The remainder of this paper is divided into six sections. Section 2 discusses literature review. Section
Promet – Traffic&Transportation, Vol. 27, 2015, No. 2, 125-135
125
Z. Jiang, C. Xie, T. Ji, X. Zou: Dwell Time Modelling and Optimized Simulations for Crowded Rail Transit Lines Based on Train Capacity
3 introduces the factors that affect actual train dwell time and the method of dwell time modelling. The inputs, outputs and simulation process of the simulation model proposed to solve the problem are described in Section 4, and numerical experiments on the Shanghai rail transit line are presented in Section 5. Finally, several conclusions and the direction of the future research are described in Section 6.
2. LITERATURE REVIEW Dwell time includes the period of time during passenger exchange, the time before the doors are closed, and the time prior to departure after the doors have closed [1]. A number of studies have analysed the determinants of the time that a transit vehicle spends at stops or stations [2]. The standard procedure is to use multiple mathematical models estimated through a series of observations that record the time a bus/train is stopped at stations and the number of boarding and alighting passengers. Lin and Wilson [3] analysed the influence of the total number of passengers boarding and alighting on the dwell time of 1- and 2-car light rail vehicles. Based on data collected from two selected light rail transit stations in Hong Kong, Lam and Cheung [4] studied the effect of different crowding conditions and the relationship between the dwell time and the crowding situations for various trains to establish a regression model for train dwell delays. Wiggenraad [5] studied the effect of door width on boarding and alighting time for intercity trains. Vuchic [2] presented a detailed method to calculate the dwell time by considering the number of passengers boarding through the most heavily used entry doors and provided a definition for the coefficient of passenger distribution among various doors. The research of Harris and Anderson [6] observed passenger behaviour (measured by the rate of boarding and alighting) and studied the design of various metro stations and trains to evaluate the ‘busyness’ of the trains. The data for their research was provided by the Community of Metros (CoMET). Tirachini [7] estimated multiple regression models to analyse the influence of different payment methods, the existence of steps at doors, the age of passengers and the possible friction between users boarding, alighting and standing, on explaining the observed variation in dwell times. Qiang Meng and Xiaobo Qu [8] proposed a probabilistic approach to estimate dwell times of buses in a bus bay by incorporating the randomness. Dwell time models have also been used as an input to be used in transit assignment models [9]. The simulation modelling approach can be used to measure dwell times, delays and other performance measures. Zhang and Han [10] presented a cellular automata-based micro-simulation model for passen126
gers according to observations of passenger alighting and boarding behaviour and an analysis of field data collected from three metro stations in Beijing. Jiang and Li [11] proposed a simulation model to investigate the relationship between train delays and passenger delays and to predict the dynamic passenger distribution in a large-scale rail transit network. However, in the simulation model, the actual dwell time remains unchanged, which indicates that they did not consider delays caused by dwell time. Grube and Núñez [2] developed an event-driven dynamic simulator for multiline metro systems that can be practically applied to study different operating strategies. Other related research work (see Hadas and Ceder [13], Kanai and Shiina [14], Carey and Carville [15], Heimburger and Herzenberg [16], Lam and Cheung [17], and Yu and Yao [18]) has estimated and optimized the reliability of transit systems based on dwell time, which is the key parameter in the simulations. Previous research focused on mathematical models estimated through observations but ignored the delay propagation effects of dwell time and the DNCF phenomenon on prolonging train delays. Analysing the interaction between dwell time and the delays of crowded rail transit lines is extremely useful toward improving train operations and can assist rail transit staff in designing a feasible scheduled timetable and in effectively managing passengers during delays. Thus, in this paper, a number of new features have been introduced, and the effect of specific elements that have not been previously considered in dwell time optimization models is evaluated. First, the number of passengers who must wait for more than one train because of capacity constraints was calculated. Second, the relationship between alighting or boarding time and the congestion of the vehicle was considered. Third, after collecting observations on passenger boarding behaviour during peak periods, we modelled the extension of the dwell time by the DNCF phenomenon. The relationship between the waiting passenger number and the train dwell time is somewhat complicated, and the influence of this interaction can be implicated by the train propagation delay with time moving. As a result, the time-driven simulation model is used in this paper.
3. ACTUAL DWELL TIME MODELLING 3.1 Influential factors on train dwell time during real operation The actual dwell time of each train depends on the many factors discussed below. (1)
Scheduled dwell time
Scheduled dwell time at stations or at stops along the open track can be divided into several compoPromet – Traffic&Transportation, Vol. 27, 2015, No. 2, 125-135
Z. Jiang, C. Xie, T. Ji, X. Zou: Dwell Time Modelling and Optimized Simulations for Crowded Rail Transit Lines Based on Train Capacity
nents: time required to open the doors, alighting and boarding time, dwell buffer time, time required to close the doors and driver reaction time. Train dwell time in scheduled timetables is based on a long-term analysis of passenger volume. In some rail transit lines of Shanghai, dwell time varies depending on the station, time period and direction of travel. (2)
Process of passenger alighting
In rail transit systems, passenger alighting and boarding occurs through the same door, and passengers obey the rule of “first alighting, then boarding”. If there are no space limitations on the platform, all the passengers can alight from the train, but the alighting time of one person is related to individual walking speed and the congestion of the train. (3) Process of passenger boarding Generally, passengers form a queue to wait for the train so that passengers who arrive earlier to the platform board prior to those who arrive later, which is the “first in first served” (FIFS) principle. It is necessary to quantify the number of passengers who can or cannot board the train regarding the limited capacity of the train. (4) Frequency of DNCF In most rail transit lines in China, the opening and closing of train doors is supervised and controlled by train-carried equipment using an ATS (Automatic Train Supervision) system. The status of all the doors on the train (and the station platform screen door) is automatically detected. If too many people loiter near the door, which prevents the door from closing completely, the door will automatically open and try to close again after a few seconds (DNCF phenomenon). Only after all the doors are safely closed is the train permitted to depart. On crowded lines, particularly during peak hours, a high load factor and large passenger volume inevitably result in the DNCF phenomenon. This occurs frequently and significantly disturbs the normal operations of the urban rail transit system. The higher the frequency of DNCF, the longer is the dwell time. (5) Passenger management strategies During peak hours with large passenger volumes, the efficiency of passenger management is a key factor that affects dwell time. Management methods include restricting the passenger volume in certain stations, such as by preventing passengers from entering or controlling the rate of passenger entry and hastening the evacuation of passengers on the platform. (6) Other factors Operational errors performed by drivers also lengthen train dwell time. Moreover, other disruptions
in the actual operating process that prolong the dwell time include rolling stock breakdowns, platform screen door faults, and power shortages.
3.2 Model Development Actual dwell time ( tAD ) is composed of three key parameters: fixed operating time ( tf ), passenger alighting and boarding time ( tp ) and additional time caused by DNCF ( te ). Therefore, tAD can be calculated using the following equation: (1) tAD = tf + tp + te (1) Fixed operation time ( tf ) Variable tf is a measure of the time required to close and open the train doors, synchronize the platform screen door and receive the confirmation signal. It is a fixed variable and can be obtained from the technical data. (2) Passenger alighting and boarding time ( tp ) According to the principle of alighting first and then boarding, variable tp is predominantly determined by the number of alighting/boarding passengers and by the degree of congestion in the vehicles and can be expressed by the following equations: (2) tp = ta + tb (3) ta = ]x a + x alg # na = ^x a + a a # b ah # na
(4) tb = ]xb + xblg # nb = ^xb + a b # b bh # nb Where ta is the time necessary for the passengers to alight from each door and tb is the duration of time that passengers need to board at each door. Variables x a and xb represent the minimum alighting and boarding time per passenger, respectively, whereas x al and xbl represent the extra alighting and boarding time per passenger according to the degree of vehicle congestion, respectively. Variables a a and ab represent the coefficients of extra alighting and boarding time per passenger according to the degree of vehicle congestion, respectively. The average degree of congestion during alighting and boarding is represented by b a and bb , respectively. Finally, na is the number of alighting passengers at each door and nb is the number of boarding passengers at each door. When V is defined as the collection of all the trains in the line, then v ! V represents train v in the line, n sNb, v is the collection of passengers waiting for train v at station s, n sOBT , v is the number of on-board passengers for arriving train v at station s, n sAa, v and n sAb, v are the number of actual alighting passengers and boarding passengers for train v at station s, respectively, and n sLb, v is the number of passengers who are unable to board train v. Therefore, n sLb, v and n sAb, v , na and nb , and b a and bb can be calculated using the following equations:
Promet – Traffic&Transportation, Vol. 27, 2015, No. 2, 125-135
127
Z. Jiang, C. Xie, T. Ji, X. Zou: Dwell Time Modelling and Optimized Simulations for Crowded Rail Transit Lines Based on Train Capacity Aa n sNb, v, n sNb, v - ^nvC - n sOBT , v + n s, v h # 0 Aa nvC - n sOBT , v + n s, v, otherwise n sLb, v = n sNb, v - n sAb, v
n sAb, v = *
nvC = m # p # cmax na = d
(5) (6) (7)
n # pa (8) m # nd n Ab (9) nb = d #s, v n # pb m nd n sOBT ,v - na m # nd 2 (10) ba = p Aa n sOBT nb , v - n s, v # m nd + 2 (11) bb = p C where nv is the maximum space capacity of the train, m is the number of vehicles per transit unit (TU), nd is the number of doors per vehicle, p is the space capacity of one vehicle, and cmax is the maximum train load factor. In China, the standard for floor area per standee is 0.167 m2/passenger (6 passenger/m2). If a vehicle is overloaded with 120% standard passengers, the other passengers that are waiting on the platform cannot board this vehicle. p a ]$ 1g and pb ]$ 1g are the coefficients of passenger distribution through the train doors that are defined as the ratio of the maximum to average number of alighting and boarding passengers per door, respectively.
n sAa, v
(3) Additional time caused by DNCF ( te ) Instances of DNCF are caused by trains with a high load factor and the presence of many passengers waiting on the platform. The number of passengers that are unable to board through each door is represented by nl , and the extra time required when one DNCF event occurs is represented by tE . Assuming that DNCF events occur randomly and the probability of a DNCF event occurring is higher when a greater number of alighting passengers ( $ nl,max ) are present by the door, te can be computed by: n Lb (12) nI = int d #s, v n m nd
nl rp = nl,max tE # int 6rp # rnd@, 6rp # rnd@ $ 1 te = * 0, else
(13) (14)
rnd = rand ^0, 1h where rand ^0, 1h is the random number in the interval (0, 1) generated from a continuous and uniform distribution.
3.3 Simple example calculation Take a station on the Shanghai rail transit line 8 as an example. According to operating experience and data analysis, the following values of the parameters were determined: m = 6.0 (vehicles), nd = 4 (doors/vehicle), p = 210 (persons, abbreviated as prs), tf = 15 (s), x a = 1.308 (s/prs), xb = 1.408 (s/ prs), a a = 0.444 , ab = 0.445 , nl,max = 5 (prs/door), tE = 20 (s), p a = pb = 1.0 , cmax = 1.2 and rnd = 1 . Additionally, assume that the load factor of the arriving train is 0.8 and that the number of alighting passengers is 100 (prs/TU, TU is the abbreviation of transit unit). The actual dwell time of this station was calculated, and the result is shown in Table 1. This table shows that the maximum number of boarding passengers in one train is 604. When more than 400 passengers are waiting to board, the required dwell time exceeds the scheduled dwell time, whereas when more than 800 passengers are waiting, the DNCF phenomenon will most likely occur. The longest required dwell time is 111 seconds.
4. PROPOSED SIMULATION PROCEDURE Simulations can efficiently represent real world situations and reproduce behaviour under controlled environment. Therefore, simulations are being used to develop and test different models. Rail simulation models can be categorized as macroscopic or microscopic, similar to other transportation models [19]. Microscopic simulation models attempt to replicate
Table 1 – Actual dwell times for different numbers of waiting passengers Number of waiting passengers (prs/TU)
Number of alighting passengers (prs/TU)
Number of boarding passengers (prs/TU)
Required dwell time (s/TU)
Scheduled dwell time (s/TU)
Actual dwell time (s/TU)
100
100
100
32
45
45
200
100
200
40
45
45
400
100
400
54
45
54
600
100
600
70
45
70
700
100
604
71
45
71
800*
100
604
91
45
91
900*
100
604
111
45
111
Note*: Assumed that DNCF occurred.
128
Promet – Traffic&Transportation, Vol. 27, 2015, No. 2, 125-135
Z. Jiang, C. Xie, T. Ji, X. Zou: Dwell Time Modelling and Optimized Simulations for Crowded Rail Transit Lines Based on Train Capacity
the actual operation of a rail transit line over time by modelling the operation of each individual train and passenger during a user-defined time step (often one second) and then repeating the process for the entire simulation period. Time-driven programming is a computer programming paradigm that is often used in real-time computing where the control flow of the computer program is driven by a clock. A time-driven microsimulator is presented that is based on an evaluation of dwell times.
4.1 Verification and validation of the simulation model It is very important to make sure that the final model runs as intended. Test of the model is separated in two parts: validation and verification. 4.1.1 Validation and assumptions One way of validating the model, is to compare it with the real system if such one exists. This was not possible in this project due to the lack of suitable real world results. Another validation is to study the assumptions made in the modelling phase. The model should be as accurate as possible and match the aim of the given project. The model in this paper attempts to give an exact picture of the real system, so the following basic assumptions were applied in the simulation process: (1) A rail transit line is a termination system that functions as a daily operating time window. (2) Passengers arrive in the system five minutes prior to arrival of the first train and cannot enter the system after the last train arrives. (3) At the stations, the FIFS discipline is valid for passengers. If one train is fully loaded, then passengers who could not board this train will be given priority on the next train. (4) The O-D demand will not be affected by the external disturbance, and nobody will cancel their travel. 4.1.2 Verification The verification is completed in several phases during the modelling. A lot of the verification is already done in this model. The following is a description of the overall test scenarios. (1) In this model it is verified that all the used flowchart and data modules are used correctly and behave as expected according to the real operation problem. (2) A very simple verification method is to allow only one O-D to happen and to follow that entity step by step to ensure that the model logic is correct.
(3) For each station, for which the actual dwell time is verified by calculating the fixed operating time ( tf ), passenger alighting and boarding time ( tp ) and additional time caused by DNCF ( te ) with a simple input (the same input data as in Section 3.3), then compare to the simulation result in Table 1, all the values are the same.
4.2 Inputs and outputs of this model The inputs of the simulation model are summarized as follows: (1) Actual OD trip information, including the moment of entry in the station, an OD station matrix, and the number of passengers. (2) A scheduled timetable, including scheduled arrival and departure times and the connecting scheme of trains by train units. (3) Buffer time ratio for the timetable that refers to three processes: station dwell time, running time in the section and turnback time. The outputs of the simulation model are summarized as follows: (1) The actual timetable. (2) Detailed travel information for each OD, including actual boarding time, alighting time, the train ID unable to board, waiting time, additional waiting time and travel time. (3) Number of delayed trains and passengers, train delays, and passenger delays.
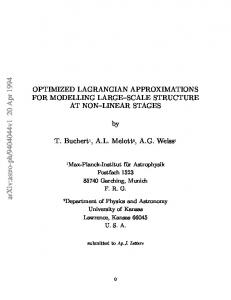
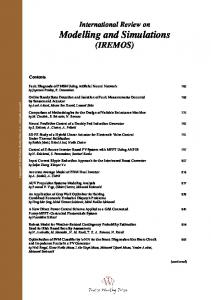
4.3 Simulation Process In the time-driven micro-simulation model, we divided time into one-second intervals and simulated the continuous train and passenger events over a specified time span. The most important event is that the system adjusts the waiting sequence and records detailed delay and boarding information for passengers that are unable to board the first arriving train. The simulation procedure is shown in Figure 1.
5. EXAMPLE ANALYSES The model proposed in this research is based on micro-simulation. The parameters for the simulation model were calibrated with real data collected via field surveys, and standard values were provided by the Shanghai metro operation company to provide a realistic representation of the line that reproduced train and passenger behaviour. Based on the dwell time model and the simulation procedure, a simulation tool named URT_DTOS (urban rail transit dwell time optimization simulation system) was developed.
Promet – Traffic&Transportation, Vol. 27, 2015, No. 2, 125-135
129
Z. Jiang, C. Xie, T. Ji, X. Zou: Dwell Time Modelling and Optimized Simulations for Crowded Rail Transit Lines Based on Train Capacity
Initialization, Input OD trips, scheduled timetable, buffer time ratio, dwell time calculation parameter
T = TBegin At time T, if train i has arrived at station j, let passengers alight from this train
Calculate all the passengers that need to board train i at station j
Can all the passengers all board train i? N Y Record the passengers who cannot board this train and put them in the next priority waiting series
Calculate the actual dwell time considering the train’s capacity
Actual dwell time TEnd? Y End
Figure 1 - Process for dwell time modelling and delay simulation
5.1 Simulation example The simulation model was developed by considering the configuration and operations of Shanghai rail transit Line 8. Line 8 is a north-south line that travels through the city centre. Passenger volume has significantly increased since service began, and Line 8 has become one of the most crowded transit lines. The length of Line 8 is approximately 37.4 km with 30 stations, including 8 transfer stations. “C size” trains (the standard capacity is 210 passenger/vehicle) 130
which are produced for light metro lines including 6 or 7 cars are used throughout Line 8. Due to these relatively small size and capacity, if they are compared to “A size” trains (the standard capacity is 310 passenger/vehicle, and used on the other Shanghai Metro lines) Line 8 is extremely crowded. So the occurrence of DNCF phenomenon happens quite on Line 8, especially during peak hours on workdays. The simulation tool URT_DTOS was operated on an Intel(R) Core (TM) i7-3520 (2.9 GHz) PC with 4 GB of memory. The input OD matrix was obtained from the Promet – Traffic&Transportation, Vol. 27, 2015, No. 2, 125-135
Z. Jiang, C. Xie, T. Ji, X. Zou: Dwell Time Modelling and Optimized Simulations for Crowded Rail Transit Lines Based on Train Capacity
Passenger volume (prs)
140,000 120,000
Entering platform passenger flow
100,000
Exiting platform passenger flow
80,000 60,000 40,000 20,000
PWE JYS PJT LHR LZV JYR YSS CSR YHL ZJD XZNL LJBL LXM DSJ RMGS QFL ZXL XZBL HKZQC QYL SPL ASXC JPL HXL YJZL HXGY XYL NJL SGL
0
Station
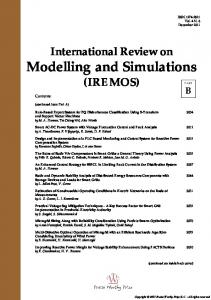
Figure 2 - Number of passengers entering and exiting the platform over an entire day
actual data of the AFC system (2013/01/14, Monday, total number of passenger trips for Line 8 was 699,785). The scheduled timetable was a workingday operation timetable from January 2013 (named 816-1#), which operated a long-short route. The long route is between Shiguang Road (SGL) and the Aerospace Museum (PWE), and the short route is between Shiguang Road (SGL) and the Oriental Sports Center (JYR). The ‘up direction’ is defined as travelling from PWE to SGL. The headway of shared-path sections is 2 min 45 s during the morning peak and 3 min 40 s during the evening peak. The buffer time ratio is 5%, and the parameters used to calculate dwell time are shown in Table 1. The time span of the simulation was from 5:00-23:50, which covered the entire day of operation. The simulation process lasted approximately 35 minutes.
5.2 Statistics of passengers entering and exiting the platform
10,000 9,000 8,000 7,000 6,000 5,000 4,000 3,000 2,000 1,000 0
5.3 Statistics of dwell time The demand for dwell time varies according to the station, time period during the day and direction of
Up direction exiting passenfer flow Down direction exiting passenfer flow Up direction entering passenfer flow Down direction entering passenfer flow
05:15-05:30 05:45-06:00 06:15-06:30 06:45-07:00 07:15-07:30 07:45-08:00 08:15-08:30 08:45-09:00 09:15-09:30 09:45-10:00 10:15-10:30 10:45-11:00 11:15-11:30 11:45-12:00 12:15-12:30 12:45-13:00 13:15-13:30 13:45-14:00 14:15-14:30 14:45-15:00 15:15-15:30 15:45-16:00 16:15-16:30 16:45-17:00 17:15-17:30 17:45-18:00 18:15-18:30 18:45-19:00 19:15-19:30 19:45-20:00 20:15-20:30 20:45-21:00 21:15-21:30 21:45-22:00 22:15-22:30 22:45-23:00
Passenger volume (prs)
In this paper, transferring passengers were included in the number of passengers who enter or exit the platform in transfer stations. As shown in Figure 2,
there is little difference between the number of passengers entering and exiting the platform over an entire day. The station with the largest passenger volume is RMGC, followed by LJBL, LXM, XZNL, YHL, and SPL in order of decreasing passenger volume. These stations are all transfer stations. Figure 3 reveals that during different periods of the day, the number of passengers entering and exiting the platform varies according to the direction of travel. It shows that there are two peak periods during an entire day; the volume of passengers during morning peak hours is significantly larger than the volume during evening peak hours. However, the difference in passenger volume between the up and down direction of travel is considerably larger. For example, the volume of exiting passengers in the up direction during the morning peak is significantly higher than the volume of exiting passengers during the evening peak. The opposite trend is observed for the volume of entering passengers travelling in the down direction.
Time period
Figure 3 - Number of passengers entering and exiting RMGC during various time periods throughout the day and travelling in different directions
Promet – Traffic&Transportation, Vol. 27, 2015, No. 2, 125-135
131
Z. Jiang, C. Xie, T. Ji, X. Zou: Dwell Time Modelling and Optimized Simulations for Crowded Rail Transit Lines Based on Train Capacity
Dwell time (s)
100
120
Scheduled dwell time Actual dwell time
100
Dwell time (s)
120
80 60 40 20
80 60 40 20 0
05:59:22 06:38:58 07:09:21 07:35:12 07:59:57 08:24:42 08:49:27 09:14:27 09:41:52 10:25:01 11:09:16 11:53:31 12:37:46 13:22:01 14:06:16 14:50:31 15:34:46 16:16:06 16:53:05 17:26:05 17:59:05 18:32:05 19:05:05 19:38:05 20:16:25 21:01:25 21:46:25 22:31:25
06:05:48 06:50:39 07:21:39 07:46:24 08:11:09 08:35:54 09:00:39 09:27:00 09:54:27 10:35:27 11:19:42 12:03:57 12:48:12 13:32:27 14:16:42 15:00:57 15:45:12 16:29:27 17:03:59 17:36:59 18:09:59 18:42:59 19:15:59 19:48:59 20:25:59 21:10:59 21:55:59 22:40:59
0
Scheduled dwell time Actual dwell time
Train arrival time (Down direction)
Train arrival time (Up direction)
(a)
(b)
Dwell time (s)
100
Scheduled dwell time Actual dwell time
80 60 40 20
06:00:26 06:40:11 07:10:11 07:34:56 07:59:41 08:24:26 08:49:11 09:15:00 09:43:20 10:25:48 11:10:03 11:54:18 12:38:33 13:22:48 14:07:03 14:51:18 15:35:33 16:19:36 16:53:36 17:26:36 17:59:36 18:32:36 19:05:36 19:38:36 20:16:56 21:01:56 21:46:56 22:31:56
0
90 80 70 60 50 40 30 20 10 0
Scheduled dwell time Actual dwell time
06:12:07 06:53:01 07:23:24 07:49:15 08:14:00 08:38:45 09:03:30 09:28:30 09:56:13 10:39:22 11:23:37 12:07:52 12:52:07 13:36:22 14:20:37 15:04:52 15:49:07 16:30:27 17:07:08 17:40:08 18:13:08 18:46:08 19:19:08 19:52:08 20:30:28 21:15:28 22:00:28 22:45:28
120
Dwell time (s)
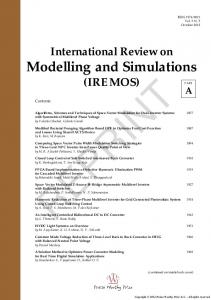
Figure 4 - Scheduled and actual dwell time of RMGC travelling in the down direction (a) and up direction (b) during different time periods
Train arrival time (Down direction)
Train arrival time (Up direction)
(a)
(b)
Figure 5 - Scheduled and actual dwell times of YHL travelling in the down direction (a) and up direction (b) for various time periods
travel. The scheduled dwell times of YHL and RMGC are compared to the actual dwell times of trains travelling in the up and down direction in Figures 4 and 5, respectively. From 7:00-19:00 at the RMGC station, most actual dwell times were longer than scheduled. This was especially evident during the morning and evening peaks for trains travelling in the down direction and during the morning peak for trains travelling in the up direction. In YHL, the actual dwell time was significantly longer than the scheduled dwell time during the morning peak travelling in the down direction and the evening peak travelling in the up direction.
number of waiting passengers was observed at YHL and CSR, with 1,439 and 1,419 waiting passengers, respectively, as shown in Figure 7. According to the analysis in Figure 2, the volume of passengers entering and exiting these two stations was not large; the arrival trains at these stations had high load factors and few alighting passengers. However, at RMGC, the station with a larger volume of passengers entering and exiting the platform, no passengers had to wait for more than one train. This is because all the trains travelling through RMGC had a large enough capacity to accommodate all the boarding passengers.
5.4 Statistics of passengers who must wait for more than one train
5.5 Statistics of train delay
According to the results of the simulation, 6,343 passengers had to wait for more than one train, and the total extra waiting time was 1,008,213 s. The number of these types of passengers varies according to the station and time period. Figure 6 shows that between 7:55-9:00 in the morning and 18:05-18:50 in the evening, a large number of passengers were required to wait for more than one train. From 8:20-8:25, there were 992 passengers who were unable to board the first available train. Passengers were unable to board the first arriving train at 12 stations. The highest 132
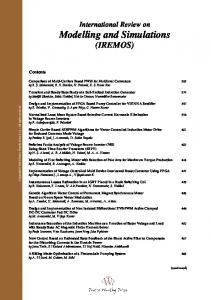
Extended dwell times cause train delays. Figure 8 shows the total arrival and departure train delays for each station. As shown in Figure 8, train delays were longer than scheduled for stations with either large entering and exiting passenger volumes (such as RMGC, LJBL, and LXM) or with passengers who were required to wait for more than one train (such as YHL and CSR). In some stations, such as JYR, ZJD, and DSJ, the departure delay was less than the arrival delay. This indicates that the required dwell time is less than the scheduled dwell time and that the dwell buffer time can absorb some of the train delays at these stations. Promet – Traffic&Transportation, Vol. 27, 2015, No. 2, 125-135
1,200 1,000 800 600 400 200 0
07:35-07:40 07:40-07:45 07:45-07:50 07:50-07:55 07:55-08:00 08:00-08:05 08:05-08:10 08:10-08:15 08:15-08:20 08:20-08:25 08:25-08:30 08:30-08:35 08:35-08:40 08:40-08:45 08:45-08:50 08:50-08:55 08:55-09:00 09:00-09:05 17:40-17:45 17:45-17:50 17:50-17:55 17:55-18:00 18:00-18:05 18:05-18:10 18:10-18:15 18:15-18:20 18:20-18:25 18:25-18:30 18:30-18:35 18:35-18:40 18:40-18:45 18:45-18:50
Passenger volume (prs)
Z. Jiang, C. Xie, T. Ji, X. Zou: Dwell Time Modelling and Optimized Simulations for Crowded Rail Transit Lines Based on Train Capacity
Time period
ZXL
YSS
YHL
XZNL
XZBL
SPL
QFL
LXM
LJBL
DSJ
CSR
1,600 1,400 1,200 1,000 800 600 400 200 0
ASXC
Passenger volume (prs)
Figure 6 - Total number of passengers who must wait for more than one train during different time periods
Station
Figure 7 - Number of passengers who must wait for more than one train at each station
5.6 Summary
9,000 8,000 7,000 6,000 5,000 4,000 3,000 2,000 1,000 0
Arrival delay Departure delay
SFP PWE JYS PJT LHR LZV JYR YSS CSR YHL ZJD XZNL LJBL LXM DSJ RMGC QFL ZXL HKZQC XZBL QYL SPL ASXC JPL HXL YJZL HXGY XYL NJL SGL
Delay (s)
According to the above analysis, train dwell time is related to OD passenger volume, OD distribution characteristics and the offered capacity of the scheduled timetable. The excessive number of arriving passengers during peak hours, the high load factor of trains and the frequent interchange between alighting and boarding passengers may cause longer dwell times and primary train delays at the station. This primary delay may affect other stations and trains. Based on actual OD trip information, a detailed evaluation and analysis of dwell time for the scheduled timetable of Line 8 was performed. The conclusions are summarized as follows:
(1) The dwell time of scheduled timetables can nearly adapt to actual passenger demand. The simulation results show that most passengers board on time, with the exception of a few passengers (6,343 passengers in this case) that must wait for the next arriving train because of limited train capacity. This phenomenon only occurs during peak travel periods. (2) The scheduled dwell time of several stations is unreasonable. Although scheduled dwell time has already been determined, the dwell time during certain time periods and travel directions is still not long enough for stations with large passenger volumes, such as RMGC, LJBL, and LXM. (3) At some stations, such as YHL, CSR, LJBL, LXM, and XZNL, extending the dwell time does not significantly reduce delays. In these stations, because trains are fully loaded, passengers are unable to board, and the DNCF phenomenon may occur. (4) Too long of a dwell time does not benefit passengers because long dwell times decrease travel speed and increase the minimum section headway of trains. To avoid DNCF, more trains should be added during the peak hours to increase train capacity or improved passenger management should be implemented that prevents passengers from entering the platform during peak periods.
Station
Figure 8 – Arrival and departure train delays for each station
Promet – Traffic&Transportation, Vol. 27, 2015, No. 2, 125-135
133
Z. Jiang, C. Xie, T. Ji, X. Zou: Dwell Time Modelling and Optimized Simulations for Crowded Rail Transit Lines Based on Train Capacity
(5) Train dwell time and the number of passengers who must wait for more than one train are interdependent. On the one hand, increasing the number of waiting passengers may cause long train dwell times and train delays. On the other hand, train delays will rapidly increase the number of waiting passengers, which affects train dwell time.
5.7 A proposed dwell time of scheduled timetable Therefore, the main objective of dwell time optimization is not only to estimate the scheduled dwell time but also to control it in daily operation. Too long dwell time is not a benefit for passengers and it may reduce the offered capacity. In rail transit Line 8, the longest acceptable scheduled dwell time is 70 s, taking the RMGC and YHL stations as example, the proposed scheduled dwell time of rail transit Line 8 was calculated using the results of simulations, as shown in Table 2. Table 2 - Proposed dwell time at RMGC and YHL Station
RMGC (Downward direction)
RMGC (Upward direction)
YHL (Downward direction)
YHL (Upward direction)
Time period
Scheduled dwell time (s)
Proposed dwell time(s)
05:30-07:30
40
40
07:30-09:30
40
70
9:30-16:30
30
50
16:30-19:30
40
70
19:30-23:10
40
40
05:30-07:30
40
40
07:30-09:30
40
70
09:30-16:30
30
45
16:30-19:30
40
50
19:30-23:10
40
40
05:30-07:00
30
40
07:00-09:30
30
60
09:30-16:30
30
30
16:30-19:30
25
35
19:30-23:10
25
25
05:30-08:00
25
25
08:00-09:40
25
30
09:30-16:40
30
30
16:40-19:30
25
50
19:30-23:10
25
35
6. CONCLUSION Simulations provide the opportunity to model complex timetable design problems using large OD data from the rail transit system. In this study, a compre134
hensive and feasible dwell time simulation model was developed and optimized to address train scheduling problems. This work presents the basic research on rail transit timetable optimization, train and passenger delay simulations and network reliability. In our research, dwell time was the only factor that was considered to affect delays; therefore, the scope and range of its application is limited. During actual operation, train delay is caused by many other factors, such as equipment failure and personnel operating errors. These types of delays combined with a dwell time delay may significantly affect transit operation. Furthermore, when a long initial delay occurs, special measures may be implemented to relieve the train delays, such as skipstopping, holding trains and reserving rolling stock. These factors will be researched in the future.
ACKNOWLEDGMENTS This work was supported by the National Natural Science Foundation of China (Grant No. 51008229, 71071112, 61473210, 51208381) and Fundamental Research Funds for the Central Universities (Grant No. 20123228). The acquisition and analysis of data in the paper was supported by the Shanghai Shentong Metro Operation Management Center. The authors gratefully appreciate this support. 江志彬,谢超(通讯作者), 季婷婷,邹晓磊 同济大学交通运输工程学院,道路与交通工程教育部重点 实验室, 上海 201804
摘要 基于列车能力评估的城市轨道交通拥 挤线路列车停站时间优化仿真 城市轨道交通列车的停站时分的确定对运营部门以及 乘客都有很大的影响。在拥挤的城市轨道交通线路上,大 量的客流会使得停站时分延长并且会经常发车乘客无法及 时上车的现象,实际的停站时分与上下车客流量是相互制 约与影响的。本文建立了一个基于计划列车运行图与实际 客流匹配仿真的停站时分仿真模型,并且分析了计划间隔 时间、上下车客流量、乘客吊门等因素对于停站时分的影 响原理。最后,基于时间驱动模型开发了一个微观仿真系 统,并以上海轨道交通8号线为实例进行了分析,并给出 了该线路的不同车站、不同峰期的停站时分优化建议。
关键词 停站时分; 列车能力; 列车延误; 运行图仿真; 城市轨道 交通; 客流量;
REFERENCES [1] Kittelson & Associates, Inc, Parsons Brinckerhoff, et al. Transit Capacity and Quality of Service Manual, Third Edition, TCRP Report 165. Washington, DC: Transportation Research Board; 2013. Promet – Traffic&Transportation, Vol. 27, 2015, No. 2, 125-135
Z. Jiang, C. Xie, T. Ji, X. Zou: Dwell Time Modelling and Optimized Simulations for Crowded Rail Transit Lines Based on Train Capacity
[2] Vuchic V. Urban transit operations, planning and economics. Reston: American Society of Civil Engineers; 2005. [3] Lin T, Wilson NH. Dwell time relationships for light rail systems. Transport Res Rec. 1992(1361):287-95. [4] Lam WHK, Cheung C, Lam CF. A study of crowding effects at the Hong Kong light rail transit stations. Transportation Research Part A: Policy and Practice. 1999;33:401-15. [5] Wiggenraad PBL. Alighting and boarding times of passengers at Dutch railway stations. Delft: TRAIL Research School; 2001. [6] Harris NG, Anderson RJ. An international comparison of urban rail boarding and alighting rates. Proceedings of the Institution of Mechanical Engineers, Part F: Journal of Rail and Rapid Transit. 2007;221(4):521-6. [7] Tirachini A. Bus dwell time: the effect of different fare collection systems, bus floor level and age of passengers. Transportmetrica A: Transport Science. 2013;9(1):28-49. [8] Meng Q, Qu X. Bus dwell time estimation at bus bays: A probabilistic approach. Transportation Research Part C: Emerging Technologies. 2013;36:61-71. [9] Aashtiani HZ, Iravani H. Application of dwell time functions in transit assignment model. Transportation Research Record: Journal of the Transportation Research Board. 2002;1817:88-92. [10] Zhang Q, Han B, Li D. Modeling and simulation of passenger alighting and boarding movement in Beijing metro stations. Transportation Research Part C: Emerging Technologies. 2008;16:635-49.
[11] Jiang Z, Li F, Xu R, Gao P. A simulation model for estimating train and passenger delays in large-scale rail transit networks. Journal of Central South University. 2012;19:3603-13. [12] Grube P, Núñez F, Cipriano A. An event-driven simulator for multi-line metro systems and its application to Santiago de Chile metropolitan rail network. Simulation Modelling Practice and Theory. 2011;19:393-405. [13] Hadas Y, Ceder A. Optimal coordination of publictransit vehicles using operational tactics examined by simulation. Transportation Research Part C: Emerging Technologies. 2010;18:879-95. [14] Kanai S, Shiina K, Harada S, Tomii N. An optimal delay management algorithm from passengers’ viewpoints considering the whole railway network. Journal of Rail Transport Planning & Management. 2011;1:25-37. [15] Carey M, Carville S. Testing schedule performance and reliability for train stations. J Oper Res Soc. 2000;51:666-82. [16] Heimburger DE, Herzenberg AY, Wilson NHM. Using simple simulation models in operational analysis of rail transit lines: Case study of Boston’s Red Line. Transport Res Rec. 1999:21-30. [17] Lam WHK, Cheung CY, Poon YF. A study of train dwelling time at the Hong Kong mass transit railway system. J Adv Transport. 1998;32:285-95. [18] Yu B, Yao JB, Yang ZZ. An improved headway-based holding strategy for bus transit. Transport Plan Techn. 2010;33:329-41. [19] Nash A, Huerlimann D. Railroad simulation using OpenTrack. Computers in railways IX. 2004;15:45-54.
Promet – Traffic&Transportation, Vol. 27, 2015, No. 2, 125-135
135


![dwell-time - ChargePoint [PDF]](https://m.moam.info/img/260x300/dwell-time-chargepoint-pdf_64b62e95098a9e5f088b45ee.jpg)