Gert Jan C. Veenstraa, Tim L. Beumera, Joselin Peterson-Maduroâ, Brenda I. Stegemanâ, ...... Rigby, P.W.J. and Staudt, L.M. (1990) Nature 345, 686-692.
ELSEVIER
Mechanisms of Development 50 (1995) 103-I 17
Dynamic and differential 0~1-1 expression during early Xenopus embryogenesis: persistence of Ott- 1 protein following down-regulation of the RNA Gert Jan C. Veenstraa, Tim L. Beumera, Joselin Peterson-Maduro”, Brenda I. Stegeman”, Henk A. Karg”, Peter C. van der Vlietb, Olivier H.J. Destr6e*a aHubrecht Laboratory, Netherlands Institute for Developmental Biology. Uppsalalaan 8, NL 3584 CT Utrecht, The NetherIan& bLuboratory for Physiological Chemistry, Utrecht University, P.O. Box 80042, NL 3508 TA Utrecht, The Neiherlands
Received 18 August 1994; revision received 27 October 1994; accepted 31 October 1994
Abstract As a first step towards the elucidation of the role of the transcription factor Ott-1 in development, we prepared a monoclonal antibody to study the spatio-temporal distribution of Ott-1 protein in vivo. Here we report differential expression of the Ott-I gene in the Xenopus embryo both at the RNA and the protein level. Transcripts and protein are detected in ectodermal and mesodermal cell lineages, in which the expression exhibits a pattern of progressive spatial restriction in the course of development. The Ott-f expression as reported here is not correlated with cell density or cell proliferation in the embryo. Our results suggest a role of Ott-1 in the specification and differentiation of neuronal and neural crest cells. In many other cells, the developmental decision to down regulate Ott-1 is delayed, probably due to a high stability of the protein. Keywordr:
Ott-1; POU; Homeobox; Xenopus; Embryogenesis
1. Introduction
Embryonic development relies on a correct spatiotemporal expression of transcription factor genes. By controlling gene expression, transcription factors contribute to regional specification and the determination of cell fate within the embryo (He and Rosenfeld, 1991; Read and Manley, 1992; Kennison, 1993). The majority of known transcription factors belong to one of several large gene families that share a homologous DNA binding domain (Mitchell and Tjian, 1989; Harrison, 1991). One of the families of transcription factors implicated in development is that of the POU proteins (Rosenfeld, 1991; Sch(iler, 1991; Verrijzer and Van der Vliet, 1993). The common DNA binding motif of the family members, the POU domain, is subdivided in two subdo* Corresponding author, Tel.: +3l-30510211; Fax: +31-30516464.
mains, a POU-type homeodomain and a POU-specific domain. Both subdomains are indispensable for sequence specific DNA-binding to the octamer motif ATGCAAAT or closely related motifs (Sturm and Herr, 1988; Ingraham et al., 1990; Verrijzer et al, 1990; Kristie and Sharp, 1990; Aurora and Herr, 1992; Li et al., 1993). Many of the POU genes show a temporally or spatially restricted expression during development (He et al., 1989; Hatzopoulos et al., 1990; Rosner et al., 1990; Suzuki et al., 1990; Agarwal and Sato, 1991; Frank and Harland, 1992; Whitfield et al., 1993). One family member, Ott-I, however, is known as widely expressed both in the embryo and in the adult (Staudt et al., 1986; Sturm et al., 1988; Schiiler et al., 1989). The apparent ubiquitous expression pattern of Ocr-I and the presence of an octamer motif in the promoters of housekeeping genes like Histone H2B (Fletcher et al., 1987; LaBella et al., 1988; Heintz, 1991; Hinkley and Perry, 1991, 1992)
0925-4773/95/%09.50 0 1995 Elsevier Science Ireland Ltd. All rights reserved SSDI 0925-4773(94)00328-K
104
G.J.C.
Veenstra et al. /Mechanisms
of Development SO (1995)
and snRNA genes (Mattaj et al., 1985; Murphy et al., 1989; Parry et al., 1989; Danzeiser et al., 1993) suggests that Ott-1 is a constitutive housekeeping transcription factor. This idea was strengthened by the fact that in cell types in which it has clearly been established that the octamer motif is involved in cell type specific gene expression, additional octamer binding factors are present (Staudt et al., 1986, Landolfi et al., 1986; Scheidereit et al., 1987). However, evidence is accumulating that octamer dependent transcriptional regulation is highly
103-117
complex. In the first place, the transactivation activity of the Ott-1 protein is subject to regulation by the phase of the cell cycle (Roberts et al., 1991; Segil et al., 1991; Heintz, 1991) and, presumably, by growth factors (Brabletz et al., 1993). In the second place, genetic and biochemical data may indicate that a cell-type specific, Ott-1 dependent transactivation pathway exists; B-cellspecific octamer dependent transcription is not affected by targeted disruption of the Ott-2 gene (Feldhaus et al., 1993). Moreover, a B-cell-derived coactivator preferably
B.
oc+l/l2Fll O&l
1
2
3
4
1
2
3
4
5
6
7
G. J. C. Veenstra ei al. / Mechanisms
interacts with Ott-1 rather than Ott-2 (Luo et al., 1992) and B cell-specific octamer dependent promoter activity mediated by Ott-1 correlates with the presence of a novel B-cell-specific octamer binding complex containing Ott-1 protein (Ptisterer et al., 1994). In the third place, the relative level of Ott-I expression is also subject to regulation. This has been observed in cell lines (Hsu and Chen-Kiang, 1993; Howard et al., 1993) and in the rat central nervous system during some stages of development (He et al., 1989). He et al. found a rather wide distribution of Ott-I transcripts in the neural tube of the rat embryo at day 13, but a highly restricted expression in the adult brain. These data seem to contradict a large body of evidence indicating that Ott-I is, as still frequently cited, ubiquitously expressed. Recently, a study of transgenic mice with a perturbed Ott-1 expression illustrated the need to further investigate the Ott-J expression and function during embryogenesis (Koyasu et al., 1994; Ohno et al., 1994). Since systematic and detailed study of the spatio-temporal expression of Oct1 within the embryo of any species is lacking, we examined the Ott-I expression during early Xenopus embryogenesis at both RNA and protein levels as a first step towards the elucidation of the role of this transcription factor. For this purpose, we produced and characterized a monoclonal antibody against the C-terminal domain of Ott-1. This study provides the first analysis of the spatial distribution of Ott-1 protein in vivo. In gastrula and neurula stage embryos, relatively high expression levels are observed in parts of the neural ectoderm and low levels in the mesoderm, whereas the endoderm shows negative. In following developmental stages, Oct-
of Development
SO (I 995) 103- 117
105
1 expression becomes more localized, resulting in a highly restricted expression pattern in brain structures and cranial neural crest derivatives in tailbud and tadpole stage embryos. We show that Ott-1 expression does not correlate with either cell density or cell proliferation in the embryo. These results strongly suggest a role of Oct1 in the specification and differentiation of neuronal and neural crest cells. The dynamics of the RNA and protein patterns are distinct. In many neural cells, the developmental decision to down-regulate the Ott-I gene is delayed, probably due to a high stability of the protein.
2. Results 2.1. Production and characterization
of monoclonal anti-
body 12Fll
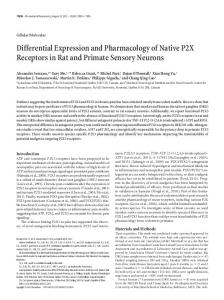
Mouse antibodies were raised against the C-terminal trans-activation domain of the Xenopus homologue of Ott-1 (Fig. 1A). One of the isolated hybridomas produced a highly specific, high affinity monoclonal antibody (MAb 12Fll), as assessed by western blotting, immunoprecipitation and electrophoretic mobility shift assays (Fig. lB-D). MAb 12Fll binds specifically to endogenous Ott-1 amongst a series of structurally related octamer binding factors (Fig. 1B) present during Xenopur gastrulation (Hinkley et al, 1992). The immunohistochemical signal obtained with the antibody shows that Ott-1 is localized to the nucleus in both XTC cells (Pudney et al., 1973) and in the brain of a tadpole stage embryo (Fig. 2A and B), as expected. This signal is efficiently reduced to background levels when purified
Fig. 1. Production and characterization of MAb 12Fl I. (A) Lane 1: Coomassie stained SDS polyacrylamide gel showing the partially purified Ott-1 fusion protein used for immunizations. Lane 2: Silver stained SDS polyacrylamide gel showing the Ott-1 C-terminal domain purified to apparent homogeneity. This preparation was used for ELISA experiments. (B) Electrophoretic mobility shift assays with labeled consensus octamer element as a probe and gastrula stage (stage 10.5 and 12) embryonic extracts. Specific complexes, as assessed by competition with specific and non-specific oligonucleotides (not shown), are indicated. Both number and abundance of the observed octamer binding activities are consistent with the data reported by Hinkley et al. (1992). Lane 1: Free probe; lane 2: shifts caused by octamer binding proteins of the stage-IO.5 embryonic extract; lanes 3 and 4: MAb 12Fll cell culture supematant and culture medium added to the binding reactions; lane 5: shifts caused by octamer binding proteins of the stage-12 embryonic extract; lanes 6 and 7: MAb 12Fll cell culture supematant and culture medium added to the binding reactions. MAb 12Fll selectively causes the Ott-l/DNA complex to supershift (lanes 3 and 6). Cell culture medium (lanes 4 and 7) and MAb 10C2 (anti&t-l in ELISA experiments, not shown) show negative in this assay. (C) Western blotting experiment (lanes 3 and 4). Lanes 1 and 3: two embryo equivalents of a gastrula stage (stage 12) extract mixed with full length Xenopus Ott-1 protein produced in E. co/i; lanes 2 and 4: gastrula stage embryonic extract without O&l. Coomassie staining is shown in lanes 1 and 2. Endogenous Ott-1 (50 pg/embryo on basis of EMSA experiments) is under the level of detection (30 ng), probably because recognition by MAb 12Fll requires refolding of the protein on blot, which occurs spontaneously for only a small fraction of protein. Immunohistochemical recognition of Ott-1 is much more sensitive; 2 pg/nl micro-injected purified Ott-1 C-terminal domain is detected by MAb 12Fll in immunohistochemistry (not shown). (D) Immunoprecipitations performed with in vitro (lanes 3 and 4) or in the oocyte (lanes 6 and 7) translated mRNA, encoding the Ott- 1 C-terminal domain. Lanes 1 and 2: in vitro translations without or with exogenously added Ott-1 mRNA; lanes 3 and 4: immunoprecipitations of the truncated Ott-1 with MAb C8H9 (anti-Rb, unpublished) (lane 3) or MAb 12Fll (lane 4). both antibodies are of the IgGl subclass; lane 5: extract of Ocr-1 mRNA micro injected, ‘?I-Methionine labeled oocytes; lanes 6 and 7: immunoprecipitations with MAbs C8H9 and 12Fll of overexpressed truncated Ott-1 from the extract shown in lane 5. The efficiency of epitope recovery is approximately 50% (lanes 2 and 4). No endogenous Ott-1 was immunoprecipitated due to the low labeling efficiency in this type of experiment and a low turn-over of Ott-1 that is associated with the high stability of the protein (see text). Immunoprecipitations with MAb C8H9 indicate that protein-protein interactions are specific under these conditions. MAb 12Fll preferably binds Ott-1 in a complex mixture of oocyte proteins. For the immunoprecipitations, 30 equivalents of the amount of extract shown in lane 5 was used, the autoradiographic exposure time was 10 times longer (3 weeks at -80°C with fluorographic enhancement).
106
G.J. C. Veensrraet al. /Mechanisms of DevelopmentSO (1995) 103-l I7
Fig. 2. Immunohistochemical control experiments. (A) Nuclear localization of 12F1 I reactivity in XTC cells (Pudney et al., 1973). (B) l2FI 1 reactivity with cell nuclei in tadpole stage embryos. Parasagittal section showing mid- (M) and hindbrain (R), the anterior side on the right, the roof of the brain is on top (aspecific signal). Arrows and arrowheads point to cell nuclei containing, respectively high and lower levels of Ott-I. Nuclear staining was confirmed by simultaneous labeling with Hoechst 33258, a DNA binding fluorescent dye (not shown). (C and D) Whole mount immunohistochemistry of a tadpole stage (stage 43) embryo obtained with MAb 12F11 (panel C) or with MAb 12F11 mixed with 4 &ml purified Ott-I C-terminal domain (panel D). See text for details of the MAb 12F1 I reactivity in Xenopusembryos.
Ott-1 C-terminal domain (Fig. 1A) is added as a competitor in the labeling procedure (Fig. 2C and D, see below for details of the pattern). Furthermore, corresponding tissues contain Ott-1 RNA and protein during embryogenesis. The spatially restricted patterns of RNA and protein are identical, only the dynamics of down-regulation of the patterns is different at these levels (compare Figs. 3C and 4C, 3G and 4E, 3H and 4F and H; see below). Using in situ hybridization and immunohistochemistry, the Ott-I expression during the
course of development (from stage 6.5, blastula stage, up to stage 49, swimming tadpole) was analyzed at the RNA and protein levels. 2.2. Ott-I expression during early development Ott-1 RNA was already detected in blastula stage embryos by whole mount in situ hybridization. Two different Ott-1 specific probes hybridized to transcripts localized as spots within the animal blastomeres of stage 6.5 embryos (Fig. 3A). These cells are fated to become
Fig. 3. Localization of Ckt-I transcripts in Xenopus embryos as-established by whole mount in situ hybridization. Unless indicated otherwise, photographs show lateral views of embryos oriented with the anterior side to the right. See Table 1 for a key to the capital-indicated embryonic structures. (A) Animal view of an early blastula stage (stage 6.5) embryo. (B) Stage 17 embryo (neurula stage). (C) Embryo of stage 24. (D) Tailbud stage (stage 28) embryo. (E) Stage 32 embryo (tailbud stage). (F) Tadpole stage (stage 41) embryo. The eye is pigmented; barely any transcripts are detected at this stage. (G) Dorsal view of the stage 28 brain. Compare Fig. 4E. (H) Dorsal view of the stage 36 brain. Compare Fig. 4F.
G. J. C. Veenstra et al. / Mechanisms
of Development
50 (1995)
103-I
I7
108
G. J. C. Veenstra et al. /Mechanisms
of Development 50 (1995)
103-l
17
G.J.C.
Veenstra et al. /Mechanisms of Development 50 (1995) 103-117
ectoderm and, to some degree, mesoderm (Dale and Slack, 1987). The vegetal blastomeres showed negative. No specific immunohistochemical signal was obtained in embryos of this stage. In gastrula stage (stage 13) embryos, Ott-1 expression is found both at RNA and protein levels, in the progeny of the stage 6.5 RNA-positive blastomeres: the ectoderm, the neural ectoderm and, only to some degree, the mesoderm (not shown and Fig. 4A). Neurula stage (stage 17) embryos exhibit a similar expression pattern, although protein levels are slightly higher and the expression is more restricted. The highest RNA and protein levels are observed in the anterior neural plate, but a considerable amount of Ott-I transcript and Ott-1 protein is detected posteriorly in the embryo (Figs. 3B and 4B). The Ott-Z RNA and protein are not evenly distributed in the neural ectoderm; dorsal views of whole embryos and transversal sections show a restriction of expression to the lateral neural ectoderm (Fig. 5). This restriction is already observed in gastrula stage embryos (not shown) but is more prominently present in stage 17 embryos. In the latter stage, the eye anlagen exhibit relatively high levels of RNA and protein, as do the adjacent parts of the neural plate (prospective archencephalon). The medial and most lateral neural plate tissue posterior from this Ott-2 expressing region shows negative (Fig. 5B). The RNA and protein patterns are identical in these stages. 2.3. Progressive restriction of Ott-I expression in the ectodermal ceil lineages In subsequent developmental stages, low levels of protein remain being observed in the mesoderm, mainly in the somites (Fig. 6A). In the ectoderm however, Ott-I transcripts and protein disappear from the posterior part of the embryo, whereas the RNA and protein remain being detected in the head region of the embryo (Figs. 3C-E, 4C and D), where the expression levels transiently increase. Structures showing positive in the head are the placodal anlagen, cranial neural crest derivatives, the eye and parts of the brain. The placodal anlagen surround the neural plate and the neural crest in a neurula stage embryo. These are the anlagen for the adenohypophysis, the olfactory organ, the lens, the ear and the cephalic ganglia. In some of these structures high Ott-1 levels are detected. Ott-Z
109
gene expression is observed in the stomodealadenohypophysial anlage at both RNA and protein levels from, respectively, stage 19 and stage 22 onwards (not shown). The expression increases and relatively high levels of transcripts are observed in the developing pituitary up to stage 32 after which the RNA disappears. At the protein level, expression is detected up to at least stage 49. Both the neural and the epithelial compartments of the pituitary show positive (Figs. 4G, 6C and D). In the auditory placodes, and later in the otic vesicles, both RNA and protein are detected from stage 19 and 24, respectively (Figs. 3D, E, 4D-F, 6B and F). Expression at the RNA level is maximal at stage 28 and lasts up to stage 32, expression at the protein level is still present at stage 49. Both hybridization and fluorescence has been observed in the olfactory and lens placodes. These signals might be aspecific since the negative controls also contained signal in these tissues in some experiments. The migrating cranial neural crest shows high RNA and protein levels from stage 22 to stage 36 (Figs. 3D, E, G, H and 4D). This Ott-I expressing neural crest includes the mandibular, hyoid and, branchial crest segments. Later in development (e.g. stage 43, Fig. 4H), the branchial arches contain large amounts of Ott-1 protein. During these stages, part of the cranial cartilage derived from the neural crest is staining positive (Fig. 4H). The cephalic ganglia are derived from cells of both the placodal thickening and the neural crest. Ott-I transcripts are detected in different cranial ganglia from stage 28 onwards, whereas the protein is first detected by stage 32. High protein levels are detected in tailbud and tadpole stage embryos in the ganglia of the cranial nerves V, VII, VIII and IX/X (Figs. 4E, F and 6F). The eye anlage is, as mentioned above, expressing Ott-1 starting at stage 17. Transcripts are detected in the prospective retina up to stage 32 (Fig. 3C-E). At this stage, maximal fluorescence is observed in this organ (Fig. 4E), thereafter the protein levels decline and the Ott-1 protein signal is lost by stage 48. Ott-I expression in the central nervous system shows more and more spatial restriction in the course of development. While by neurula stages, expression is
Fig. 4. Localization of Dct-I protein in Xenopus embryos as determined by whole mount immunohistochemistry using MAb 12F11. Unless indicated otherwise, all panels represent complete maximum projections of embryos that are oriented with the anterior side to the right. See Table I for a key to the capital-indicated embryonic structures. (A) Lateral view of a gastrula stage embryo (stage 13). Arrow head points to the dorsal blastopore lip. (B) Lateral view of a neurula stage embryo (stage 17). (C) Stage 22 embryo (neural tube stage), lateral view. (D) Dorsal view of stage 32 (tailbud stage) embryo. (E) Embryo of stage 36, dorsal view. Compare Fig. 3G. Aspecific staining is observed in the lens. (F and H) Projections of, respectively, dorsal and ventral halves of the stage 43 embryo. A complete projection is presented in the Figs. 2C and 7A. Aspecific staining is observed in the lens. The fluorescence observed posteriorly in the embryo represents an artefact. (G) Projection showing a lateral view of the stage 45 brain. Wedge shows the pseudo color settings used.
110
G.J. C. Veenstra et al. /Mechanisms
of Development
50 (1995) IW- I17
Fig. 5. Spatial restriction of Ott-I expression in the neural plate. (A) Dorsal view of stage 17 embryo showing transcripts hybridizing laterally in the neural plate (arrow heads). The anterior side of the embryo is oriented to the right. (B) Anterior view of the same embryo showing that the ‘stripes’ of expression (arrowheads) are connected medially at the level of the eye anlagen. Dorsal side is on the left. (C and D) Transversal sections showing Ocr-l RNA and W-1 protein laterally in the posterior neural plate (arrow heads). Lower levels of Ott-I protein are observed medially in the neural plate and in the neural crest and the ectoderm (panel D). Fig. 6. Details of Ott-I expression. (A) Parasagittal optical section of a stage 24 embryo showing the presence of W-l protein in the somites. The anterior side of the embryo is on the right. (B) Transversal section of a stage 28 embryo showing the Ocr-I transcripts being spatially restricted in the hindbrain. Furthermore, Ott-1 RNA is detected in the otic vesicle. (C-F) Frontal optical sections of the stage 43 embryo. The anterior side of the embryo is on the right. (C) Oct-1 protein is detected in the infundibulum (neurohypophysis) and the chiasmatic ridge. (D) Section more ventral in comparison with the section shown in panel C, showing Ott-I protein being present in the adenohypophysis. (E) Spatial restriction of Ocr-I expression in mid- and hindbrain. The highest levels of Dct-I protein are observed in the midbrain at the border with the hindbrain. (F) Maximum projection of frontal sections containing the otic vesicle and the cranial sensory ganglia. Roman numbers refer to the numbers of the cephalic nerves that relay in the Dct-I positive ganglia. The ganglia of the facial nerve (VII) contain relatively low levels of the protein at this stage of development. Note that the other sensory relay centers of the cephalic nerves, i.e., the olfactory bulb and the retina, also contain relatively high levels of Ott-I protein at least at some stage of development (compare Fig. 4D-G).
G. J. C. Veenstra et al. /Mechanisms
III
of Development 50 (1995) 103-l I7
Fig. 7. No correlation of &r-I expression with cell density or cell proliferation. (A) Localization of Ott-I protein in the stage 43 embryo as determined by whole mount immunohistochemistry. (B) Spatial differences of cell density in the stage 44 embryo as determined by labeling with TOPRO3, a DNA binding dye. (C)Whole mount immunohistochemical staining of a stage 43 embryo performed with MAb PCIO, reactive with Proliferative Cell Nuclear Antigen (PCNA). High levels of PCNA are dt!ected dorso-laterally in the mid- and forebrain.
observed at all anterior/posterior levels of the nervous system (see above); in subsequent stages, Ott-Z expression becomes confined to the anterior nervous system. However, also in large parts of the brain, RNA and protein cease being detected. At stage 28, relatively strong hybridization is observed in the posterior part of the forebrain (presumptive diencephalon) and at the mid/hind brain border (Fig. 3G). Lower signals are observed in the remainder of the midbrain, whereas the prospective telencephalon and the rhombencephalon are only positive in restricted areas (not shown and Fig. 6B). At stage 36, the spatial differences of Ott-1 expression levels become even more pronounced. Transcripts are still detected in the midbrain (just anterior of the hindbrain and in the dorso-lateral wall), the diencephalon and, to some degree, the anterior part of the telencephalon (including the prospective olfactory bulb), but no transcripts are observed in the rhombencephalon and the remainder of the tel- and mesencephalon (Fig. 3H). The protein pattern in the brain shows a considerable time lag compared to that of the RNA. The RNA pattern in the brain of stage 28 embryos corresponds, more or less, to the protein pattern of stage 36 embryos, whereas the RNA pattern of this stage corresponds to the protein pattern of stage 43 embryos (compare Fig. 3G and H with 4E and F, additional details of the protein pattern are shown in Figs. 4G and 6C-D). By stage 43, no Ott-1 transcripts are detected by in situ hybridTable 1 Key to embryonic structures AH B C D E M NH 0 R T
Adenohypophysis Branchial arches Chiasmatic ridge Diencephalon Eye (anlagenkesicle) Mesencephalon Neurohypophysis Otic vesicle Rhombencephalon Telencephalon
ization. The protein on the other hand, remains being detected to at least stage 48 at rather high levels. So, corresponding brain regions contain the higher levels of RNA and protein at different stages; high levels of Ott- 1 protein persist for days following down-regulation of the RNA. 2.4. Quantitative differences of Ott-1 expression Ott-I is known as widely expressed. Therefore, the spatial distribution of Ott-1 as described above might be ascribed to differences in cell density rather than differences in expression level per cell. To examine this possibility, embryos were stained with a DNA binding fluorescent dye, TOPRO-3. As clearly visible in Fig. 7B, the developing brain, which is an organ with a very high cell density in comparison with other tissues, shows the highest DNA content per cubic pm within the embryo. The branchial arches for instance contain much less DNA per cubic pm and are consequently not clearly visible in the whole mount projection. As might be clear from the comparison of Fig. 7A and B, at least at this stage of development the Ott-1 pattern is not caused by differences in cell density and thus reflects differences in expression level per cell. The results of whole mount immunohistochemistry were quantified to determine the magnitude of the difTable 2 Quantification of Ott-1 protein in the stage 43 embryo (see Experimental procedures). Figures are presented as mean f SD. tit-1 levels were corrected for cell density in the embryo to generate a measure for the Ott-I level per cell. The normalized Ott-1 level as calculated for the branchial arches was arbitrarily set at IO0
Branchial arches Hindbrain Midbrain (at the border of the hindbrain) Posterior telencephalon
Ott-I
Cell density
Normalized Ott-I level
38 f 4.0 15 * I.5 53 l 5.3
79* II 164 f I5 177 f IS
loo 20 63
12 f 0.8
160 f I3
15
112
G.J.C.
Veenstra et al. /Mechanisms
ferences of Ott-Z expression at the protein level (see Experimental procedures). These figures were normalized for cell density using TOPRO- staining, to generate a measure for the expression level per cell (Table 2). When these figures are compared, it becomes apparent that the highest level of Ott-I expression is observed in the branchial arches, due to a relatively high level of Ott-1 protein that is present in a relatively small number of cells. On the other hand, the part of the telencephalon that is just anterior to the diencephalon contains a large number of cells but a relatively low level of Ott- 1. Taken together, quantification of the data reveals that at least 6-fold differences in Ott-1 level are present in the tadpole stage embryo. 2.5. No correlation between Ott-1 expression andproliferation rate A differential expression pattern does not exclude a house-keeping function of the gene. House-keeping activity might be correlated with cell proliferation and, therefore, it might be differentially expressed in the embryo. To examine whether Ott-I expression correlates with cell proliferation, the spatial distribution of Proliferative Cell Nuclear Antigen (PCNA) was studied by whole mount immunohistochemistry (see Fig. 7C). PCNA immunostaining with the PC10 antibody of paraformaldehyde fixed tissue is a marker for proliferating cells (Landberg and Roos, 1991). The PCNA pattern as observed does not match that of Ott-1. For example, at the mid/hind brain border, high PCNA levels are present dorso-lateral in the midbrain, whereas lower levels are observed in the roof of the midbrain. Ott-1, however, is present at all dorso-ventral levels of the midbrain at the mid/hind brain boundary, except for the most dorsal levels. Therefore, Ott-1 levels are not directly linked to cell-proliferation rate at this stage of development. 3. Discussion We have prepared a highly specilic, high affinity monoclonal antibody (12Fll) that reacts with the Cterminal domain of the Xenopus homologue of the transcription factor Ott-1 (Fig. 1). Electrophoretic mobility shift assays show that MAb 12Fll does exclusively supershift Ott-1 among multiple octamer binding proteins present in Xenopus gastrula stage embryonic extracts (Fig. 1B; Kuiken et al., 1994). Both number and relative abundance of the observed octamer binding activities are consistent with the data reported by Hinkley et al. (1992). Immunohistochemical analysis shows that antibody reactivity is mainly found, as expected, in the nucleus, both in cultured cells and in the embryo and that low concentrations of recombinant Ott-1 protein compete for this activity (Fig. 2). Moreover, the results of in situ hybridization, as obtained using different Oct-
of Developmenr
50 (1995)
103-117
I specific probes, perfectly matched those of the immunohistochemistry. Corresponding tissues are staining positive for RNA and protein at identical stages during early development (until the end of neurulation) and at different stages during later development (see Figs. 3 and 4), due to distinct dynamics of down-regulation of RNA and protein. These results indicate that the major detectable immunohistochemical reactivity of monoclonal antibody 12Fll represents Ott-1. 3.1. Spatial restrictions of Ott-I development
expression
during
This study provides the first systematic and detailed analysis of Ott-I expression during early embryogenesis and the first report on the spatial distribution of Ott-1 protein by immunohistochemistry. Our data indicate that Ott-1 exhibits a pattern of progressive spatial restriction in the course of development, In early blastula stage embryos, the Ott-1 transcripts were detected in patches located in blastomeres of the animal half of the embryo (Fig. 3A). No specific immunohistochemical signal was obtained in embryos of this stage. The RNA is presumably of maternal origin since prior to the mid-blastula transition (MBT) hardly any transcription takes place (Newport and Kirschner, 1982a and b). The Ott-I RNA positive cells are fated to become ectodermal and, to some degree, mesodermal cells (Dale and Slack, 1987). All the structures expressing Ott-Z in the subsequent developmental stages belong to the progeny of these cells. Apparently, the later need of Ott-1 in the ectodermal cells is anticipated in the transcriptionally silent early blastula embryo. However, not all derivatives of the animal blastomeres are showing positive in later development. The Ott-I expression exhibits more and more spatial restrictions during the course of development. Already at gastrula and neurula stages, not all cells within the ectoderm are equally positive; higher levels of transcript and protein are found in the neurectoderm, in fact, in specific parts of this tissue (Fig. 5). In subsequent stages, expression in the mid-trunk neurectoderm, the posterior neurectoderm and the mesoderm (except for the somites) is sequentially lost. In the head region, expression is detected in derivatives of the placodal anlagen, the neural crest and in the brain. But also in these structures, Ott-I expression becomes more and more restricted. In tailbud and tadpole stage embryos, relatively high expression levels are observed in the branchial arches, in the diencephalon and at the boundary between mes- and rhombencephalon, while many other derivatives of the ectodermal cell lineages have lost the Ott-1 expression. In the rat central nervous system, Ott-I transcripts are widespread at embryonic day 13 (He et al., 1989). By day 16, however, only the retina and the diencephalon were scored RNA positive, structures that do contain
G.J.C.
Veenstra et al. /Mechanisms
both RNA and protein during Xenopus development. So, also in rat brain development, Ott-I expression tends to become more confined to only some of the brain structures. This confinement of expression may be similar in the rat and Xenopus, even though adult brain structure and function differ dramatically between amphibians and mammals. 3.2. Distinct dynamics of Ott-I RNA andprotein patterns Until late neurula stages, the RNA and protein patterns of Ott-1 expression are identical (Figs. 3B, C, 4B, C, SC and D). The protein pattern directly follows the RNA pattern in its spatial restriction, while the protein levels increase. Later in development, however, a considerable time lag between the patterns arises. The RNA distribution in the stage 28 brain corresponds to the protein pattern in the brain of a stage 36 embryo, while the RNA pattern in the latter stage corresponds to that of the protein in the stage 43 embryo. It takes several days for an embryo to develop from stage 28 to stage 36, or from stage 36 to 43. At stage 43, Ott-I transcripts are not detectable anymore, while the protein pattern is sustained for at least 4 days (the time it takes for a Xenopus embryo to develop from stage 43 to stage 48). These data may indicate that the Ott-1 protein, in contrast to the mRNA, is rather stable. During early development, Ott-1 is synthesized de novo. Since protein levels rapidly increase in those cells in which the RNA is abundant, RNA and protein patterns match perfectly. Later in development, depending on the tissue, Ott-1 RNA levels are down-regulated; the high stability of the protein causes a time lag between RNA and protein patterns. The different dynamics of the RNA and protein patterns, as demonstrated here for Xenopus Ott- 1, once more underline the importance of studying gene expression both at the RNA and protein level. 3.3. Co-expression of Ott-I and other POU factors In Xenopus as well as in the rat and the mouse, different POU transcription factors are co-expressed in the same cells. In the rat, these POU factors include Ott-1, Ott-2, Oct6/SCIP/Tst-1, Pit-l, Bm-1, -2 and -3 (He et al., 1989; Gerrero et al., 1993). In Xenopus, the Ott-1 gene is expressed together with the Ott-WXLPOU-60 gene in the animal pole cells during blastula and gastrula stages (Hinkley et al., 1992; Whitlield et al., 1993) and with XLPOU-I and, presumably, also XLPOU-2 in the anterior neural plate (stage 15, neurula stage embryo), and later in the brain and the eye vesicle (stage 25, tail bud stage embryo) (Agarwal and Sate, 1991). The factors encoded by these genes contain a POU domain of class III (XLPOU-1 and -2) or V (Ott-60/XLPOU-60). Ott-60 has been shown to be able to bind a consensus octamer site (Hinkley et al., 1992); XLPOU-1 and -2 most likely behave like other class III POU domain factors (Li et al., 1993). What then might be the function
of Development SO f 1995) 103-117
113
of co-expression of partially redundant POU factors in specific tissues at some stages of development? Possibly, the competition for octamer or octamer-like cis-acting elements by multiple transcription factors with similar but not identical DNA binding specificities and affinities, and with trans-activation activities unique to each factor, allows subtle and differential regulation of target genes through these cis-acting elements. In this view, redundancy is required for emergent functions (Thomas, 1993) of octamer or related cis-acting elements. 3.4. Differential Ott-1 expression is not related to cell proliferation Ott-1 has frequently been considered as an exception to the rule of POU factors being developmentally and tissue specifically regulated. Ott-I is known as widely expressed and involved in regulation of different housekeeping genes. To determine whether the expression pattern of Xenopus Ott-1 is linked to house-keeping functions, different possibilities were tested. Firstly, if Ott-1 is distributed evenly over all cells, then the observed patterns should correlate with cell density. However, the observed Ott-1 protein pattern does not correlate with cell density as determined by the spatial distribution of DNA (Fig. 7B). Therefore, the Ott-l expression pattern reported here represents quantitative differences between cells. The distinction between ubiquitous and cell type specific transcription factors provides a useful framework of thinking. It is nevertheless clear that transcription is regulated to a large extent by the relative amount rather than the absence or presence of the regulatory factors. Although some other regulatory proteins might exhibit larger quantitative differences of expression than a factor of 6, as reported here for Ott-1, already differences of transcription factor concentration as small as a factor of 2-3 have been shown to result in differential regulation of target genes (Struhl et al., 1989; Carey et al., 1992). Because of the relatively high detection thresholds of hybridization and immunohistochemistry, it might be possible that the tissues showing negative with these techniques express low levels of the transcription factor. In fact, this is rather likely since Xenopus Ott-I mRNA is still detected in tadpole stage embryos by Northern blot analysis (our results, not shown), whereas it is not detected in embryos of these stages by in situ hybridization. Furthermore, a large body of biochemical evidence indicates a rather wide expression of the gene (Staudt et al., 1986; Sturm et al., 1988; Schiiler et al., 1989; Kambe et al., 1993). Taking these data together, Ott-I is widely but differentially expressed and this differential expression is developmentally regulated. We tested whether Ott-I expression correlates with cell proliferation because actively cycling cells might re-
114
G. J. C. Veensrra et al. / h4echanisms of Development 50 (1995)
quire a higher house-keeping gene expression than quiescent cells do. Since the proliferation rate of cells is not equal for all tissues in an embryo, house-keeping genes might be differentially expressed. Our results, however, indicate that relatively high Ott-Z expression levels are not correlated with cell proliferation rate (Fig. 7C). This strongly suggests that the differential Ott-I expression reported here is required for regulation of genes other than house-keeping genes. 3.5. Developmental functions of Ott-I It was suggested recently that Ott-1 is important for the embryo. When the CD3/Oct-1 locus of the mouse is disrupted by gene targeting, either a high embryonic (Koyasu et al., 1994) or a high neonatal (Ohno et al., 1994) lethality is observed, which is ascribed to a perturbed Ott-I expression. Apparently, disregulation of the gene is lethal for the mouse embryo under some conditions. Since these observations do not provide a clue with regard to the mechanisms by which a perturbed Ott-I expression might affect development, these data underline the need to investigate the functions of Ott-1 in development. Since the differences in Ott-I expression cannot be ascribed to differences of either cell density or proliferation rate (Fig. 7), the expression pattern strongly suggests that this transcription factor is involved in the regulation of genes that are required for development. What then are the functions of Ott-1 suggested by its expression pattern? High levels of Ott-1 expression are transiently present and exhibit progressive spatial restriction in the course of development. The least spatial restrictions are observed in those developmental stages in which the neural plate undergoes massive proliferation. As has been suggested for other POU family members whose expression show similar characteristics (He and Rosenfeld, 1991), this expression might be important for the generation and proliferation of a variety of specific neuronal precursors. The highly restricted expression late in development, when neurons further differentiate, suggest a role in the specification and differentiation of the cell types involved (He and Rosenfeld, 1991), i.e., for Ott-1, mainly the specification and differentiation of neuronal and neural crest-derived cells. The transcriptional inactivation of the Ott-1 gene that occurs in many other neural cells at some stage of development, thus, likely reflects an induction event that leads to a loss of potency. However, the loss of Ott-1 protein follows substantially later in development. This observation might provide a mechanism for the time lag that exists in many cellular and developmental systems between the acquisition of commitment and actual cellular differentiation. The biological significance of such a time lag is that the actual differentiation can be fine-tuned or even redirected by additional permissive or instructive induction events.
103-I
I7
4. Experimental procedures 4.1. Production andpurification of the C-terminal domain of Ott-I
A 2700-basepair cDNA coding for the Xenopus homologue of Ott-1 was isolated from an embryonic stage-17 cDNA library (Kintner and Melton, 1987) using a genomic Xenopus Ott-I clone (Schilthuis et al., unpublished) as a probe. Restriction enzyme analysis and sequencing showed that the isolated coding sequence was identical to that isolated by Smith and Old (1990). A 1500-basepair PaamHIIEcoRI fragment coding for amino acids 462-760 of Xenopus Ott-1 was cloned in the BamHIIEcoRI sites of pRP265, a pGEX (Smith and Johnson, 1988) derived vector provided by Dr. R. Plasterk. Transformed DHSa E. coli expressed the GST/XOct 1 462-760 fusion protein after induction with 0.2 mM IPTG. The bacteria were lysed by sonitication in TEN-100 buffer (25 mM Tris pH 7.8, 1 mM EDTA, 100 mM NaCl, 1 mM DTT, 0.1% Triton X100). After lysis, the insoluble fraction was washed three times with TEN- 100 and subsequently solubilized by sonilication in TEN- 100 containing 8 M Urea. Urea was removed by dilution and dialysis, the buffer was changed in this way to TEN-380 (25 mM Tris pH 7.3,l mM EDTA, 380 mM NaCl). Then, serial anion exchange chromatography (EconoPacQ, Biorad) and aftinity chromatography (Glutathione-agarose, Sigma) was performed. Glutathione-agarose-bound fusion protein was eluted with 5 mM free Glutathione (Sigma) and digested with Thrombin (Sigma). The XOct-1 462-760 protein was further purified by anion exchange chromatography (EconoPacQ, Biorad). The protein eluted between 0 and 100 mM NaCl. Immunizations antibodies
4.2.
and
screening
for
monoclonal
Two mice were injected intra peritoneally with 100 or 200 pg of partially purified GST/XOctl fusion protein. To maximize the immune response, complete and incomplete Freunds adjuvants were used for priming and boost injections, respectively. Boost injections were supplied 4 and 11 weeks after priming. Two final boosts were given 4 and 3 days before fusion (week 15). Spleen cells were fused with SpO myeloma cells as described (Campbell, 1991) and resulting hybridomas were plated in 20 plates of 96-wells. Cell culture supernatants were screened 11, 14, 16 and 18 days after fusion in ELISA experiments. 50 ~1 of cell culture supernatant was tested in wells coated with 100 ng of purified XOctl 462-760 protein. Positive hybridomas were single cell cloned two times. Monoclonal antibody 12Fll is of the IgGl subclass. 4.3. Embryos Xenopus laevis embryos were obtained as described
G.J.C.
Veenstra et al. /Mechanisms of Development 50 (1995) 103-117
(Newport and Kirschner, 1982a). For both in situ hybridization and immunohistochemistry (see below), albino embryos were fixed in MEMPFA (100 mM MOPS pH 7.4, 2 mM EGTA, 1 mM MgS04, 4% paraformaldehyde) at embryonic stages 6.5, 13, 15, 17, 19, 22, 24, 28, 32, 36, 40, 43, 46, 48 or 49 (Nieuwkoop and Faber, 1967). 4.4. Electrophoretic mobility shift assays An octamer containing double stranded oligonucleotide, Ad4 (Verrijzer et al., 1990), was used as a prcbe for electrophoretic mobility shift assays. This oligonucleotide was end-labeled with T4-kinase and y32P-dATP. Whole embryo extracts were prepared by homogenizing lo-50 embryos in ice-cold WCE buffer (25 mM Tris pH 8, 400 mM KCl, 1 mM EDTA, 20% glycerol, 5 mM DTT, 1 mM PMSF, 1 pg/pl Lcupeptin, 1 &/.d Pepstatin). Extracts were centrifuged at 13 000 rev./min for 10 min (4”C), supernatants were aliquoted and stored at -80°C. Binding conditions were as described (Hinkley et al., 1992) with a few modifications. In short, 2 ~1 whole embryo extract (approximately one embryo equivalent) was added to 18 kg of a mixture containing 0.5 rg poly(dIdC), 0.2 ng of labeled probe and 10 ~1 2 x Bandshift buffer (20 mM Tris pH 7.8, 100 mM NaCl, 10 mM MgC12, 40% Glycerol, 1% Ficoll, 5 mM DTT, 2.5 pg/jd Leupeptin, 2.5 pg/pl Pepstatin). Antibodies (1.5 11 cell culture supematant) were added to the Double stranded reactions. 20 /Ll binding oligonucleotides containing consensus octamer and AP-2 sites were used in competition experiments. The reactions were incubated on ice for 30-60 min. After addition of 4 ~1 10% glycerol containing bromophenol blue, the reactions were loaded onto a 6% nondenaturing polyacrylamide gel in TGE buffer (25 mM Tris base, 190 mM glycine, 2 mM EDTA). Gels were run for 5 h at 10 V/cm at 4°C dried under vacuum and subjected to autoradiography. 4.5. Immunoprecipitations and western blotting derived from A 1250-bp PvuII fragment, pGEM3Zf(-)/XOctl cDNA, encoding the C-terminal domain of Ott- 1, was ligated in the EcoRV site of pT7TS, kindly provided by Dr. P.A. Krieg. Using this construct (pT7TS/XOctl-C-PruII) as a template, mRNA was synthesized and translated. In vitro RNA synthesis and translation kits were purchased from Ambion and Promega, respectively. Oocytes were microinjected and incubated overnight with 35S-Methionine according to standard procedures (Colman, 1984). Extracts were prepared and diluted in NP40 lysis buffer (25 mM Tris pH 7.5, 100 mM NaCl, 1 mM EDTA, 1 mM DTT, 1% Nonidet P40, 1 mM PMSF, 1 j&ml Pepstatin, 1 &ml Leupeptin). 100 ~1 of diluted extract was added to 100 ~1 12Fll hybridoma serum free cell culture supematant and incubated for 1 h on ice. Then, 50 ~1 of washed
115
GammaBindG beads (Pharmacia) were added and incubated with extract and antibody for 1 h on a rotary mixer at 4°C. Finally, beads were washed 7 times with 1 ml NP-40 lysis buffer and resuspended in 25 ~1 2 x concentrated SDS-PAGE sample buffer. SDS PAGE was performed as described (Laemmli, 1970). Xenopus extracts for western blotting were prepared as described above. Dilution of antibodies: 12Fll cell culture supematant 1:4, Goat-anti-mouse peroxidase 1:18 000. After labeling, blots were incubated with ECL (enhanced chemiluminescence, Amersham) detection reagent and exposed to film for 1 h or longer. 4.6. Whole mount in situ hybridization Whole mount in situ hybridization was performed as described (Harland, 1991) with minor modifications (Koster et al., in preparation). In short: MEMPFA fixed albino embryos were hybridized with in vitro synthesized digoxygenin-labeled RNA probes (1 &ml) at 65°C in hybridization mix containing total yeast RNA (1 mg/ml). Sense RNA hybridizations were performed as controls. The chromogenic reaction was allowed to continue for at least 16 h. Subsequently, the precipitates in the embryos were fixed for 6 h at room temperature in MEMPFA. Embryos were cleared in BABB (33% benzyl alcohol, 67% benzyl benzoate) for photography, embedded in paraffin and sectioned. Sections were stained with neutral red. The templates for RNA synthesis were generated as follows: The XOct-1 cDNA was partially digested with BsmI, sticky ends were treated with T4 DNA polymerase, then the DNA was digested with EcoRI and the resulting 2550-bp BsmI-EcoRI fragment was ligated in the EcoRV- EcoRI sites of pBluescript, resulting in the vector pLLB/XOct 1. A 7 lobp Z-ZincII-StuIfragment derived from the latter vector, encoding part of the N-terminal trans-activation domain of Ott-1, was ligated in the SmaI site of pGEM3Zf(-), resulting in the vector pLLG/XOctl-HS. Linearized pLLG/XOct 1-HS and pT7TS/XOct 1-CPvuII (see above) were used as templates for sense and antisense RNA probe synthesis. Hybridization with the two different RNA probes, encoding the N- and Cterminal domains, respectively, revealed identical patterns. 4.7. Whole mount immunohistochemistry The procedure described by Klymkowsky and Hanken (1991) was modified as follows. MEMPFA (see above) was used as fixative. Blocking of irrelevant epitopes was achieved by overnight incubation (4°C) with PBS containing 10% lamb serum. The primary antibody (undiluted c&t-l 12Fll cell culture supematant or l/100 diluted (rPCNA PC10 monoclonal antibody (DAKO) (Waseem and Lane, 1990) or, as a negative control, undiluted culture medium) was incubated with the embryos for at least 8 h at 4°C. In the Ott-1 protein
116
G.J.C.
Veenstra et al. /Mechanisms of Development 50 (1995) 103-117
competition experiment, a mixture of undiluted 12Fll cell culture supernatant and purified XOct-1 462-760 protein (4&ml) was prepared 30 min prior to the primary antibody incubation. PBS containing 5% lamb serum was used as washing buffer. Washing steps were performed at room temperature. The embryos were incubated overnight (4°C) with an a-mouse antibody conjugated to indodicarbocyanine Cy5 (multiple labeling quality, Jackson Immunoresearch Laboratories) diluted l/200 in PBS with 5% lamb serum. After washing with PTw (PBS containing 0.2% Tween) and methanol, the embryos were cleared in BABB. For all incubations a nutator type mixer was used. Fluorescence was imaged using a Biorad, MRC600 confocal laser scanning microscope equipped with a 15 mW krypton-argon laser. Cy5 was excitated using the 647 nm laserline and the RHS filter set. Cy5 was used since at its long excitation wavelength, the autofluorescence of the Xenopus embryo is nearly absent (Beumer et al., 1995); Cy5 thus allows low-signal fluorescence imaging. Images of optical sections were collected and archived on hard disc and optical disc, respectively. Computer aided image processing was performed as follows: Optical sections of one embryo (Z-step 25-30 pm) were projected on each other (unless indicated otherwise in the legends). Negative controls show dark blue using the pseudo color settings shown in Fig. 4G. Fluorescence was quantified from optical sections of whole mount labeled embryos. Pixel values were between 0 (black) and 255 (white). Mean values and standard deviations were calculated from 4- 10 independent measurements in different optical sections, each measurement being the average pixel value of 1500- 15000 pixels. Background fluorescence (branchial arches, 23 f 2.2; hindbrain, 18 f 0 9; midbrain at the border of the hindbrain, 19 f 0.4; posterior telencephalon, 18 * 1.5) was subtracted from MAb 12Fll fluorescence, but not from TOPRO- fluorescence since its signal-to-noise ratio is much higher and the appropriate recording settings were different. MAb 12Fll and TOPRO- values were divided to normalize for cell density. The normalized value as calculated for the branchial arches was arbitrarily set at 100. Acknowledgments We thank Dr. D.A. Melton for generously providing the cDNA library, Drs. P.A. Krieg and R. Plasterk for providing, respectively, the pT7TS expression vector and the pRP vectors. We acknowledge W.M. Barends for the genomic Xenopus Ott-1 clone. We thank D. Dooijes for cloning of pRP265/XOct1/462-760, A.P. Boots for immunolabeling of XTC cells, W. Hage for assistance with the confocal laser scanning microscope, 0. Verwer, A. van Voorst, J. Narraway and W. Veringa for animal care, F. Vervoordeeldonk and J. Heinen for photographic reproductions. Furthermore, we thank
Dr. J.G. Koster and Dr. G. Berben-Bloemheuvel for stimulating discussions. The work described in this paper was supported by the Netherlands Organization for Scientific Research (NWO). References Agarwal, V.R. and Sato, SM. (1991) Dev. Biol. 147, 363-373. Aurora, R. and Herr, W. (1992) Mol. Cell. Biol. 12, 455467. Beumer, T.L., Veenstra, G.J.C., Hage, W.J. and Destree, O.H.J. (1995) Trends Genet. 1I, 9. Brabletz, T., Pfeuffer, I., Schorr, E., Siebelt, F., Wirth, T. and Serfling, E. (1993) Mol. Cell. Biol. 13, 1155-1162. Carey, M., Kolman, J., Katz, D.A., Gradoville, L., Barberis, L. and Miller, G. (1992) J. Viral. 66, 4803-4813. Campbell, A.M. (1991) In van der Vliet, PC. (eds.), Monoclonal Antibody and Immunosensor Technology. Elsevier Science Publishers, Amsterdam. Vol. 23. Colman, A. (1984) In Hames, B.D. and Higgins, S.J. (eds.), Translation of Eukaryotic Messenger RNA in Xenopus Oocytes, IRL Press, Oxford. pp. 271-302. Dale, L. and Slack, J.M.W. (1987) Development, 99, 527-551. Danzeiser, D.A., Ursa, 0. and Kunkel, G.R. (1993) Mol. Cell. Biol. 13, 4670-4678. Feldhaus, A.L., Klug, CA., Arvin, K.L. and Singh, H. (1993) EMBO J. 7, 2763-2772. Fletcher, C., Heintz, N. and Roeder, R.G. (1987) Cell 51, 773-781. Frank, D. and Harland, R.M. (1992) Development 115, 439-448. Gerrero, M.R., McEvilly, R.J., Turner, E., Lin. C.R., O’Connell, S., Jenne, K.J., Hobbs, M.V. and Rosenfeld, M.G. (1993) Proc. Natl. Acad. Sci. USA 90, 10841-10845. Harland, R.M. (1991) In Kay, B.K. and Peng, H.B. (eds.), In situ Hybridization: An Improved Whole Mount Method for Xenopus Embryos, Academic Press Inc., San Diego. Vol. 36, pp. 685-695. Harrison, S.C. (1991) Nature 353, 715-719. Hatzopoulos, A.K., Stoykova, A.S., Erselius, J.R., Goulding, M., Neuman, T. and Gruss, P. (1990) Development 109, 349-362. He, X. and Rosenfeld, M.G. (1991) Neuron 7, 183-196. He, X., Treaty, M.N., Simmons, D.M., Ingraham, H.A., Swanson, L.W. and Rosenfeld, M.G. (1989) Nature 340, 35-42. Heintz, N. (1991) Biochim. Biophys. Acta 1088, 327-339. Hinkley, C. and Perry, M. (1991) Mol. Cell. Biol. I I, 641-654. Hinkley, C. and Perry, M. (1992) Mol. Cell. Biol. 12, 4400-4411. Hinkley, C.S. Martin, J.F., Leibham, D. and Perry, M. (1992) Mol. Cell. Biol. 12, 638-649. Howard, M.K., Mailhos, C., Dent, C.L. and Latchman, D.S. (1993) Exp. Cell Res. 207, 194-196. Hsu, W. and Chen-Kiang, S. (1993) Mol. Cell. Biol. 13, 2515-2523. Ingraham, H.A., Flynn, SE., Voss, J.W., Albert, V.R., Kapiloff, M.S., Wilson, L. and Rosenfeld, M.G. (1990) Cell 61, 1021-1033. Kambe, F., Tsukahara, S., Kato, T. and Seo, H. (1993) Biochim. Biophys. Acta 1171, 307-310. Kennison, J.A. (1993) Trends Genet. 9, 75-78. Kintner, C.R. and Melton, D.A. (1987) Development 99, 31 I-325. Klymkowsky, M.W. and Hanken, J. (1991) In Kay, B.K. and Peng, H.B. (eds.), Whole Mount Staining of Xenopus and other Vertebrates, Academic Press Inc., San Diego. Vol. 36, pp. 419-441. Koyasu, S., Hussey, R.E., Clayton, L.K., Lcrner, A., Pedersen, R., Delany-Heiken, P., Chau, F. and Reinherz, E.L. (1994) EMBO J. 13, 784-797. Kristie, T.M. and Sharp, P.A. (1990) Genes Dev. 4, 2383-2396. Kuiken, G.A., Bertens, P.J.A. Peterson-Maduro, J., Veenstra, G.J.C., Koster, J.G. and Destree, O.H.J. (1994) Nucleic Acids Res. 22, 1675-1680.
G.J.C.
Veenstra et al. /Mechanisms of Development SO (1995) 103-117
LaBella, F., Sive, H.L., Roeder, R.G. and Heintz, N. (1988) Genes Dev. 2, 32-39. Laemmli, UK (1970) Nature 227, 680-685. Landberg, G. and Roos, G. (1991) Cancer Res. 51, 4570-4574. Landolti, N.F., Capra, J.D. and Tucker, P.W. (1986) Nature 323. 548-551. Li, P., He, X., Gerrero, M.R., Mok, M., Aggarwal, A. and Rosenfeld, M.G. (1993) Genes Dev. 7, 2483-2496. Luo, Y., Fujii, H., Gerster, T. and Roeder, R.G. (1992) Cell 71, 231-241. Mattaj, I.W., Lienhard, S., Jiricny, J. and De Robertis, E.M. (1985) Nature 316, 163-167. Mitchell, P.J. and Tjian, R. (1989) Science 245, 371-378. Murphy, S., Pierani, A., Scheidereit, C., Melli, M. and Roeder, R.G. (1989) Cell 59, 1071-1080. Newport, J. and Kirschner, M. (1982a) Cell 30, 675-686. Newport, J. and Kirschner, M. (1982b) Cell 30, 687-696. Nieuwkoop, P.D. and Faber, J. (1967) Normal Table of Xenopus laevis (Daudin) (2nd ed). North Holland Publishing Company, Amsterdam. Ohno, H., Goto, S., Taki, S., Shirasawa, T., Nakano, H., Miyatake, S., Aoe, T., Ishida, Y., Maeda, H., Shirai, T., Rajewsky, K. and Saito, T. (1994) EMBO J. 13, 1157-l 165. Parry, H.D., Scherly, D. and Mattaj, I.W. (1989)Trends Biochem. Sci. 14, 15-19. Ptisterer, P., Annweiler, A., Ullmer, C., Corcoran, L.M. and Wirth, T. (1994) EMBO J. 13, 1654-1663. Pudney, M., Varma, M.G.R. and Leake, C.J. (1973) Experientia 29, 466-467.
117
Read, D. and Manley, J.L. (1992) Biochim. Biophys. Acta 1114, 79-93. Roberts, S.B., Segil, N. and Heintz, N. (1991) Science 253, 1022-1026. Rosenfeld, M.G. (1991) Genes Dev. 5, 897-907. Rosner, M.H., Vigano, M.A., Ozato, K., Timmons, P.M., Poirier, F., Rigby, P.W.J. and Staudt, L.M. (1990) Nature 345, 686-692. Scheidereit, C., Heguy, A. and Roeder, R.G. (1987) Cell 51,783-793. Scholer, H.R. (1991) Trends Genet. 7, 323-329. Scholer, H.R., Balling, R., Hatzopoulos, A.K., Suzuki, N. and Gruss, P. (1989) EMBO J. 8, 2551-2557. Segil, N., Roberts, S.B. and Heintz, N. (1991) Science 254, 1814-1816. Smith, D.B. and Johnson, K.S. (1988) Gene 67, 31-40. Smith, D.P. and Old, R.W. (1990) Nucleic Acids Res. 18, 369. Staudt, L.M., Singh, H., Sen, R., Wirth, T., Sharp, P.A. and Baltimore, D. (1986) Nature 323, 640-643. Struhl, G., Struhl, K. and Macdonald, P.M. (1989) Cell 57, 1259-1273. Sturm, R.A. and Herr, W. (1988) Nature 336, 601-604. Sturm, R.A., Das, G. and Herr, W. (1988) Genes Dev. 2, 1582-1599. Suzuki, N., Rohdewohld, H., Neuman, T., Gruss, P. and Scholer, H.R. (1990) EMBO J. 9, 3723-3732. Thomas, J.H. (1993) Trends Genet. 9, 395-399. Verrijzer, C.P. and van der Vliet, P.C. (1993) Biochim. Biophys. Acta 1173, 1-21. Verrijzer, C.P., Kal, A.J. and van der Vliet, P.C. (1990) Genes Dev. 4, 1964- 1974. Waseem, N.H. and Lane, D.P. (1990) J. Cell Sci. 96, 121-129. Whitfield, T., Heasman, J. and Wylie, C. (1993) Dev. Biol. 155, 361-370.