for Quality-of-Service Support in IP-Based Satellite Networks. Nicolae Iuoras. Department of Electrical & Computer Engineering. McGill University, Montreal.
Dynamic Capacity Allocation for Quality-of-Service Support in IP-Based Satellite Networks
Nicolae Iuoras Department of Electrical & Computer Engineering McGill University, Montreal December 2004
A thesis submitted to McGill University in partial fulfillment of the requirements of the degree of
Master of Engineering
© Nicolae Iuoras 2004
1
1+1
Library and Archives Canada
Bibliothèque et Archives Canada
Published Heritage Branch
Direction du Patrimoine de l'édition
395 Wellington Street Ottawa ON K1A ON4 Canada
395, rue Wellington Ottawa ON K1A ON4 Canada Your file Votre référence ISBN: 0-494-12615-9 Our file Notre référence ISBN: 0-494-12615-9
NOTICE: The author has granted a nonexclusive license allowing Library and Archives Canada to reproduce, publish, archive, preserve, conserve, communicate to the public by telecommunication or on the Internet, loan, distribute and sell th es es worldwide, for commercial or noncommercial purposes, in microform, paper, electronic and/or any other formats.
AVIS: L'auteur a accordé une licence non exclusive permettant à la Bibliothèque et Archives Canada de reproduire, publier, archiver, sauvegarder, conserver, transmettre au public par télécommunication ou par l'Internet, prêter, distribuer et vendre des thèses partout dans le monde, à des fins commerciales ou autres, sur support microforme, papier, électronique et/ou autres formats.
The author retains copyright ownership and moral rights in this thesis. Neither the thesis nor substantial extracts from it may be printed or otherwise reproduced without the author's permission.
L'auteur conserve la propriété du droit d'auteur et des droits moraux qui protège cette thèse. Ni la thèse ni des extraits substantiels de celle-ci ne doivent être imprimés ou autrement reproduits sans son autorisation.
ln compliance with the Canadian Privacy Act some supporting forms may have been removed from this thesis.
Conformément à la loi canadienne sur la protection de la vie privée, quelques formulaires secondaires ont été enlevés de cette thèse.
While these forms may be included in the document page count, their removal does not represent any loss of content from the thesis.
Bien que ces formulaires aient inclus dans la pagination, il n'y aura aucun contenu manquant.
•••
Canada
ABSTRACT Since the Internet has become the de-facto global networking infrastructure, IPbased
services
have
increasingly
been
used
for
delivering
multimedia
applications, including various voice, video and data applications. Such applications generate traffic with different characteristics and consequently, require various levels of service. Service differentiation and end-to-end Qualityof-Service
(QoS)
provisioning in
IP
networks
thus
represent a
major
preoccupation in both the research community and industry. Recent years have also
witnessed
considerable
interest
in
delivering
IP-based
applications using broadband satellite access (BSA) networks.
multimedia
Such networks
rely on multi-beam technologies and a satellite-based return channel in order to provide a viable solution for two-way broadband Internet access to users in areas without adequate terrestrial infrastructure. The efficient management of the return channel transmission resources (capacity) is a key element in reducing the service cost, and thus, in ensuring the viability of BSA for IP multimedia services. This thesis concentrates on advanced dynamic capacity allocation (DCA) schemes that allow an efficient and fair sharing of the BSA return channel capacity among many user terminais (UTs), by dynamically adapting each UT's capacity assignment to the input traffic variations, while satisfying QoS requirements. DCA performance is evaluated with respect to satellite bandwidth utility (utilization) and QoS performance experienced by user traffic (expressed in terms of packet delay and loss).
DCA performance is affected by various
elements/parameters, sorne internai to the DCA scheme and others, external. Relying
on
simulation,
the
thesis
considers
the
effects
of
these
elements/parameters on performance, focusing on their optimization in order to balance
the
DCA
performance
against
the
signaling
overhead
and
computationallalgorithmic complexity of the DCA scheme. A novel DCA scheme is proposed, capable of providing Differentiated Services (DiffServ) IP QoS support for multimedia applications and high bandwidth utility, while maintaining reduced signaling overhead and computationallalgorithmic complexity.
2
SOMMAIRE L'Internet est devenu dernièrement le réseau global pré-éminent; par la suite, les services IP ont donc été de plus en plus utilisés pour la livraison d'applications multimédias, telles que voix, vidéo et données. Ces applications génèrent du trafic à différentes caractéristiques et par conséquent, nécessitent de divers niveaux de service. La différentiation et provision bout à bout de la Qualité de Service (QdS) représentent ainsi une préoccupation majeure dans les milieux de recherche et dans l'industrie. Les dernières années ont aussi témoigné d'un intérêt considérable pour la livraison des applications IP multimédias à travers des réseaux d'accès par satellite à bande large (ASBL). Ces réseaux sont basés sur des technologies à multi-faisceaux et incluent un canal de retour par satellite, afin d'offrir une solution viable pour l'accès aller-retour de bande large aux usagers situés dans des régions sans infrastructure terrestre adéquate. La gestion efficace des ressources de transmission (capacité) du canal de retour est essentielle à la réduction du coût du service, et donc, à la viabilité des ASBL pour les services IP multimédias. Cette thèse est consacrée à l'étude de schèmes avancés pour l'allocation dynamique de capacité (ADC) capables d'assurer la distribution efficace et équitable de la capacité du canal de retour à de nombreux terminaux de satellite (TS), grâce à l'adaptation dynamique de la capacité allouée à chaque TS aux variations du trafic input, tout en répondant aux exigences QdS. La performance de l' ADC est évaluée par rapport à l'utilisation efficace de la capacité du satellite et à la QdS perçue par l'usager (exprimée en termes de délai et perte de paquets). La performance de l' ADC est affectée par de divers éléments/paramètres, soit internes, soit externes au schème ADe. En utilisant la simulation, la thèse considère les effets de ces éléments/paramètres sur la performance, se concentrant sur leur optimisation afin de balancer la performance de l' ADC contre ses exigences de signalisation et sa complexité algorithmique. Un nouveau schème ADC est proposé, capable d'offrir le support QdS (basé sur les Services Différenciés) aux applications multimédias, tout en utilisant efficacement la capacité du satellite, avec signalisation et complexité algorithmique réduites.
3
ACKNOWLEDGEMENTS First and foremost, 1 would like to sincerely thank my research supervisor, Dr. Tho Le-Ngoc. He unfailingly provided invaluable guidance and support over the entire course of my M. Eng. studies, while also encouraging me to pursue my own ideas, and was never too bus Y to address my questions or concems.
1 would also like to thank my colleagues, especially Mohamed Ashour and TallaI Elshabrawy, for taking the time to provide help and constructive comments conceming my research in many discussions.
Finally, 1 wish to thank my parents, Mr. Augustin Iuoras and Mrs. Andrea Iuoras, for their constant love and support.
4
TABLE OF CONTENTS ABSTRACT ............................................................................................................ 2 SOMMAIRE ........................................................................................................... 3 ACKNOWLEDGEMENTS .................................................................................... 4 Chapter 1 : INTRODUCTION ............................................................................. 7 1.1. Background ............................................................................................. 7 l.2. Motivation 1 rationale .............................................................................. 9 l.3. Thesis objectives and contributions ...................................................... Il l.3.l. Traffic modeling assumptions ....................................................... 12 1.3.2. Estimation of the me an traffic arrivaI rate using an averaging window 13 l.3.3. Network overload probability and time distribution ..................... 14 l.3.4. Capacity requestlassignment algorithms and signaling overhead. 15 l.3.5. DCA optimization using simulation .............................................. 16 l.3.6. Effects of traffic state switching rate on DCA performance ......... 16 1.4. Thesis logic (flow) summary ................................................................. l7 l.5. Thesis organization ............................................................................... 18 Chapter 2 : ARCHITECTURES FOR IP QoS-BASED BSA NETWORKS .... 21 2.1. BSA network architectures and trends .................................................. 21 2.l.l. Overall reference archi tecture ....................................................... 21 2.l.2. Upstream uplink access using MF-TDMA ................................... 23 2.l.3. Multi-beam satellite architectures and inter-beam switching ........ 25 2.l.3.l. Non-regenerative payload: frequency switching ................... 27 2.1.3.2. Regenerative payload: on-board switching ........................... 28 2.l.4. Dynamic capacity allocation and scheduling ................................ 29 2.2. IP QoS architectures .............................................................................. 32 2.2.1. End-to-end QoS ............................................................................. 32 2.2.2. Integrated Services (IntServ) ......................................................... 34 2.2.3. Differentiated Services (DiffServ) ................................................ 35 2.3. DiffServ-capable scheduler and UT architectures ................................. 37 2.3.1. Scheduler ....................................................................................... 37 2.3.2. User terminal ................................................................................. 42 Chapter 3 : A DYNAMIC CAPACITY ALLOCATION SCHEME FOR DiffServ QoS SUPPORT ...................................................................................... 47 3.l. QoS performance measure .................................................................... 47 3.2. Background and previous work ............................................................. 48 3.3. Input traffic modeling ............................................................................ 52 3.4. Moving-average estimation of the mean traffic arrivaI rate .................. 55 3.5. Network overload probability and mean overload time ........................ 57 3.5.l. Network overload probability ....................................................... 58 3.5.2. Mean network overload time ......................................................... 59 3.6. Proposed DCA scheme .......................................................................... 62 3.6.l. Case 1 (Cl): Frame-based requests with known traffic arrivaI rates (as baseline) ................................................................................................... 63
5
3.6.2. Case 2 (C2): Frame-based requests with estimated traffic arrivaI rates 68 3.6.3. Case 3 (C3): Reduced request and assignment frequency (signaIing) and simplified scheduling algorithm ........................................... 69 Chapter 4 : PERFORMANCE EVALUATION ................................................ 72 4.1. Simulation model description ................................................................ 72 4.1.1. Model configuration ...................................................................... 73 4.1.2. Simulation scenarios ..................................................................... 75 4.1.2.1. Network loading .................................................................... 75 4.1.2.2. SRD vs. LRD traffic .............................................................. 76 4.1.2.3. Moving-average sliding window size ................................... 77 4.1.2.4. Request transmission threshold ............................................. 77 4.2. Results and discussions ......................................................................... 78 4.2.1. Comparison of DCA cases ............................................................ 78 4.2.2. QoS performance (Pr{ Q>n} ) ........................................................ 82 4.2.2.1. Effects of the moving-average sliding window size ............. 85 4.2.2.2. Effects of the request transmission threshold ........................ 87 4.2.3. Network overload .......................................................................... 90 4.2.4. Effects of traffic state switching rate on DCA performance ......... 92 Chapter 5 : SUMMARY AND CONCLUSIONS ............................................. 96 REFERENCES .................................................................................................... 101
6
Chapter 1 : INTRODUCTION 1.1. Background The Internet has become the de-facto global networking infrastructure, built primarily around terrestrial core and access networks using various transport technologies; the Internet Protocol (IP) is the common denominator in ail these networks.
Due to the ubiquitous use of IP in terrestrial networks, IP-based
services have been increasingly used for delivering multimedia applications, including various voice, video and data applications. Such applications generate traffic with different characteristics (e.g., burstiness) and thus, require different levels of service. Real-time applications like voice and videoconferencing, for example, are delay and jitter sensitive; data applications, on the other hand, are more tolerant to delay and jitter but may be more sensitive to packet losses (e.g., banking transactions). Due to the various service requirements of multimedia applications, service differentiation
and
end-to-end
Quality-of-Service
(QoS)
guarantees
are
increasingly being demanded by the users of IP networks and represent a major preoccupation in both the research community and industry. The original IP [1] has no notion of QoS and only provides best-effort delivery of IP packets (datagrams). Two key architectures/models have since been proposed under the auspices of the Internet Engineering Task Force (IETF) in order to provide IP QoS support: Integrated Services (IntServ) [2] and Differentiated Services (DiffServ) [3] [4].
The IntServ architecture allows per-flow end-to-end
connections (virtual circuits) with pre-defined bandwidth to be established. Ail network nodes (routers) along the end-to-end path must reserve forwarding resources (buffer space and bandwidth) and maintain state information for each individual IP flow; this increases equipment complexity and raises scalability concerns in large networks.
In order to circumvent these shortcomings, the
DiffServ architecture has been proposed. It specifies the forwarding treatment, called per-hop behavior (PHB), that IP packets should receive at network nodes depending on their service c1ass. Five service classes (PHBs) in addition to the 7
best-effort c\ass have been defined.
PHBs apply to traffic aggregates, not
individual f1ows, so the DiffServ architecture leads to simpler, more scalable implementation than IntServ. DiffServ has therefore become the architecture of choice for QoS support in IP networks. In order to provide end-to-end QoS based on the DiffServ architecture, each network along a connection' s end-to-end path must support the DiffServ PHBs by implementing the appropriate forwarding mechanisms in ail the network nodes; in addition, end-to-end protocols are needed for session and QoS signaling. In recent years, there has been considerable interest in delivering multimedia applications using broadband satellite access (BSA) networks [5].
The most
obvious advantage of BSA over terrestrial access technologies (e.g., cable, DSL) is its ability to provide connectivity in remote areas without adequate terrestrial infrastructure, thereby offering an economically viable solution for "Iast mile" broadband access by providing a so-called "instant infrastructure". In addition, the wide-area coverage of a satellite allows long-distance communication with only one hop, thus avoiding the often-unpredictable delays resulting from routing and congestion in terrestrial networks.
Finally, the broadcast nature of the
satellite medium is ideal for efficiently providing multicast and broadcast services to large user populations. Since many multimedia applications are interactive (conversational), they require bi-directional (two-way) communication channels. Until recently, the deployment of BSA networks for these applications has been somewhat hindered by the lack of a satelIite-based retum channel to transport the user traffic. The last few years have witnessed the development of such retum-channel technologies. In Europe, a retum channel specification has been defined un der the auspices of the European Telecommunications Standards Institute (ETSI) in the Digital Video Broadcasting - Retum Channel via Satellite (DVB-RCS) open standard [6]. The standard has been used by SES-Astra for the deployment of the BroadBand Interactive (BBI) system - the first system offering satellite interactive multimedia services on a commercial basis. While DVB-RCS is gaining acceptance aIl over the world and is being used by many satellite operators (e.g., Telesat, Eutelsat, JSAT) for
8
experimental systems (demonstrators) and even for operational systems, other retum channels have been developed based on proprietary technologies (especially in the USA, by companies such as Gilat and Hughes Network Systems). The high cost of interactive servIces via satellite (compared to terrestrial technologies) has also hindered the deployment of BSA networks, but this is also about to change. The service cost is dominated by two main elements, namely the cost of user terminais (UTs) and the scarcity of satellite resources (bandwidth, buffering and computational resources). High-gain multi-beam antennas at the satellite have made possible the use of small antennas and low-power transmitters at the UTs, which, combined with more efficient modulation/coding schemes, create the premise for UT cost reduction to levels comparable to those offered by other technologies (e.g., terrestrial wireless).
Multi-beam technology also
provides increased system capacity for a given bandwidth through frequency reuse between beams; this allows a larger number of users to be supported, leading to further reduction of the per-user service cost by the principle of economies of scale. The service cost can be reduced even further through the efficient utilization of the available satellite bandwidth, by using advanced capacity allocation schemes.
1.2. Motivation / rationale To capitalize on IP's ever-increasing popularity, BSA networks should seamlessly interoperate with terrestrial IP networks as part of the global communication infrastructure. Consequently, BSA networks should be compatible with IP-based technologies,
architectures
and
differentiation and QoS guarantees.
protocols
capable
of
providing
service
For the reasons described in Section 1.1,
DiffServ is the preferred architecture for IP QoS provisioning capable of meeting the requirements of multimedia applications. In BSA networks, the retum link capacity is subject to contention among many UTs. The contention is resolved by the Medium Access Control (MAC) protocol, which govems the assignment of capacity to the UTs. The performance of the 9
MAC protocol is judged using two sometimes-conflicting criteria: •
The utility (utilization) of the available satellite transmission bandwidth. A high utilization is desired in order to increase the number of supported users, thus reducing the per-user bandwidth cost.
•
The QoS performance offered to users, typically defined in terms of performance metrics including the packet delay, delay variation Uitter) and packet loss.
Acceptable values for these metrics depend on the
application; a voice-over-IP (VoIP) application, for example, requires low delay and is very sensitive to jitter, while a file transfer is rather insensitive to delay and jitter but requires low packet loss. One option is to make each UT's capacity assignment static (fixed). This method is simple and provides good link utility with applications generating traffic with constant or nearly constant rates (e.g., audio/video streaming).
Unfortunately,
most multimedia applications, such as web browsing, file transfers and videoconferencing, generate variable or even bursty traffic. In this case, the fixed assignment scheme would lead to either low utility but good QoS performance, if the assigned capacity is close to the application's peak transmission rate, or high utility but inadequate QoS performance due to queue buildups (increased delays) and/or overflows (packet losses), if the assigned capacity is close to the application 's mean rate.
Neither of these outcomes is acceptable, therefore
Dynamic Capacity Allocation (DCA) schemes are required. DCA schemes rely on capacity requests from the UTs reflecting their needs, and corresponding
capacity assignments from a (typically centralized) scheduler. This process can effectively improve resource utility while maintaining adequate QoS performance for the user traffic, by dynamically adapting the capacity assignments to the UTs' input traffic variations. With regard to QoS performance, it is noted that most multimedia applications can cope with the scheduling delay (Iatency) introduced by DCA, i.e., the propagation time of the capacity requests and assignments over the satellite link and the processing time within the UTs and the scheduler. This scheduling delay is called the DCA cycle time, or request-to-assignment time. Compared to the fixed assignment strategy, DCA cornes at the price of increased
10
signaling overhead and complex algorithms for calculating capacity requests and assignments.
The request and assignment signaling requires precious satellite
transmission bandwidth, which could otherwise be used for user traffic; this increases the service cost per unit bandwidth. The complexity of the algorithms requires additional computational resources, which increase the cost of the equipment (UTs and scheduler). Understandably, satellite network operators wish to achieve the high resource utility offered by DCA, but with low signaling overhead and simple request and assignment algorithms. On the other hand, users are interested in good QoS performance for their applications at low cost. The variations of the traffic generated by sorne of these applications may require frequent updates of the capacity request and assignment amounts, in order to satisfy QoS requirements; these frequent updates would increase the amount of signaling. A more responsive DCA scheme (i.e., one that more closely follows the input traffic variations) uses more signaling to update the capacity requests and assignments but may provide better performance (in terms of satellite bandwidth utility and user QoS performance), because the assigned capacity more accurately reflects each UT's input traffic variations.
A tradeoff is therefore
required between the signaling overhead, the complexity of a DCA sc he me and the scheme's performance. An incremental performance improvement may not justify a significant increase in the amount of signaling and/or the scheme's complexity; a balance must therefore be established between these three elements.
1.3. Thesis objectives and contributions The discussion in Section 1.2 indicates that the efficient delivery of multimedia applications over BSA networks requires the use of DCA. The main research theme/objective of this thesis is to propose a novel DCA scheme that is efficient with regard to satellite bandwidth utility and satisfies user QoS requirements, while maintaining reduced signaling overhead and computational complexity. User QoS requirements are expressed in terms of QoS performance parameters, primarily packet delay and loss at the UT. DCA performance depends on a number of elements/parameters, sorne of which 11
are internai to the DCA scheme and others, external. In the subsections below, we identify these elements/parameters and discuss various alternatives/options regarding their choice, the expected performance effects of each of these alternati ves and the associated research issues considered in the thesis.
The
investigation and resolution of the se issues constitute the main contributions of the thesis. The design and performance of the DCA scheme depend to a great extent on the characteristics of the aggregate user traffic in the BSA network.
Appropriate
input traffic models are therefore required, and the DCA design should be tailored to the se models. Traffic modeling is not the focus of this thesis, however; results from the Iiterature and assumptions regarding the typical operational environment of the UTs are therefore used to select a traffie model and justify its validity. This ereates the premise for the development of the DCA seheme and the evaluation and optimization of its performance using mainly simulation, but also analysis where appropriate.
l.3.l. Traffie modeling assumptions The seleeted input traffie model is based on two-state switched Poisson traffie sources. The paeket inter-arrivai times in both states are exponentially distributed with different means; henee the arrivai process in eaeh state is a Poisson proeess. The state with the higher mean paeket arrivai rate (Iower mean inter-arrivai time) is called the "high" state, and the other, the "Iow" state. switches
(toggles)
between
its
two
states;
the
Eaeh traffic source
traffic
sources
operate
independently of each other, i.e., their state switehing points are not synehronized. The state sojourn times are specified by a probability distribution that is either exponential, in which case the resulting traffie is said to exhibit short-range dependence (SRD), or heavy-tailed (e.g., Pareto), in whieh case the traffic is said to exhibit long-range dependence (LRD). The SRD and LRD properties refer to the relative deeay rates of the traffie's time autocorrelation function, with implications on queuing performance: a queuing system with LRD input traffic (i.e., slower deeay rate) generally results in longer queues (and thus, increased 12
packet queuing delays and losses) than with SRD traffic. A heavy-tailed state sojourn time distribution implies that for a given mean, there is a higher probability of obtaining longer sojourn times than in the case of distributions that are not heavy-tailed (e.g., exponential). The mean state sojourn times are set greater than the DCA cycle time defined in Section 1.2, so that each traffic source can be assumed to remain in the same state for the entire duration of a DCA cycle. Consequently, the traffic within the DCA cycle behaves as simple (non-switched) Poisson traffic, which is analytically tractable, and the capacity allocation can be based on Poisson traffic's only parameter, its mean arrivai rate, estimated (measured) as described below.
1.3.2. Estimation of the mean traffic arrivai rate using an averaging window As noted in Section 1.2, DCA is based on the dynamic adaptation of the capacity assigned to each UT to the UT's input traffic variations; these variations must therefore be measured in order to determine the amount of capacity required. Since the traffic is modeled by two-state switched Poisson sources as described above, the variations are caused both by the stochastic nature of the Poisson traffic arrivai process in each state, and by each source's state switching. The latter contributes more than the former to the traffic variations, because there is generally a significant difference between the mean traffic arrivai rates in the two states.
A method is therefore required to estimate (measure) the me an traffic
arrivai rate, which changes with the state; this can be accompli shed using a window-based moving time-average of packet arrivais. The size of the averaging window is an adjustable parameter affecting the estimated mean, and thus, the DCA performance.
With a smaller window, the moving average follows the
instantaneous traffic arrivai rate more closely, which implies high variation in the estimated mean. As the window size is increased, the estimated me an becomes smoother, i.e., the estimate is of better quality, possibly improving DCA performance; the downside is that the estimate responds more slowly to the traffic source's state switching point, with the opposite effect of worsening DCA performance.
Given this tradeoff between the estimate's quality and its 13
responsiveness to traffic variations, the optimization of the window Slze to maximize DCA performance is a significant research issue.
l.3.3. Network overload probability and time distribution As stated in Section l.3.1, the input traffic in the BSA network is modeled by two-state switched Poisson traffic sources operating independently. If enough of these sources are simultaneously in their "high" state, the aggregate traffic arrivaI rate to the network may momentarily exceed the total transmission capacity (although the aggregate mean traffic arrivai rate does not), resulting in a network overload, until sorne of the traffic sources in the "high" state switch to the "low"
state. During network overloads, the UTs' queues become unstable (build up) because the traffic arrivaI rates to the queues exceed the queue service rates, resulting in reduced QoS performance (i.e., increased queuing delays and/or packet losses). Consequently, the overloads' occurrence frequency and duration both affect the QoS performance; overloads should only occur rarely (i.e., the overload probability should be low) and their duration should be short, in order to
minimize their performance impact. The overload duration is related to the state sojoum times of the traffic sources: longer sojoum times lead to longer overload times, because more time elapses before a traffic source in the "high" state switches to the "low" state. As described in Section l.3.1, LRD traffic, with its heavy-tailed sojoum time distribution, generally exhibits longer sojoum times with higher probabilities than SRD traffic for the same mean sojoum time. The network overload times are thus presumably longer with LRD input traffic; to determine the difference, the overload times with both traffic types must be compared. A study of the network overload time (more specifically, its mean and probability distribution) is th us a worthwhile research issue. The reduced QoS performance resulting from the prolonged overload times with LRD traffic can be counteracted by lowering the network traffic load.
14
1.3.4. Capacity reguest/assignment algorithms and signaling overhead A DCA scheme consists of the algorithms and equations used to calculate the capacity request and assignment amounts. The request amounts could be based on the number of new packet arrivaIs to the UT since the last capacity request. Alternatively, the request amounts could reflect estimates of the capacity required in order to achieve sorne target QoS requirement; an analytical queuing model cou Id be used to calculate the se estimates, depending on the mean traffic arrivaI rate.
In principle, this second request strategy could result in better DCA
performance than the first because the target QoS level is taken into account in the capacityestimates. In either case, the capacity request and assignment algorithms must be matched. As noted in Section 1.2, the computational complexity of these algorithms should be weighed against the resulting DCA performance: an incremental performance improvement may not justify a significant increase in complexity. In addition to the performance-complexity tradeoff described above, another significant research issue involves the performance-signaling tradeoff: recall from Section 1.2 that a DCA scheme that is more responsive to input traffic variations (i.e., that more closely follows these variations) uses more signaling to update the capacity requests and assignments, but may provide better performance because the assigned capacity more accurately reflects each UT's traffic conditions. Now, recall from the discussion of traffic modeling in Section 1.3.1 that the me an state sojourn times of the switched Poisson input traffic sources are set greater than the DCA cycle time, so that each traffic source can be assumed to remain in the same state for the entire duration of a DCA cycle. Consequently, the traffic within the DCA cycle behaves as simple (non-switched) Poisson traffic, which is analytically tractable, and the capacity allocation can depend on the traffic's me an arrivaI rate, measured using a moving time-average of packet arrivaIs, as described in Section 1.3.2. To reduce signaling, the capacity requests should only be updated when this mean arrivaI rate changes significantly; this can be accompli shed by calculating the relative change in the measured me an arrivaI rate since the last capacity request was transmitted, and only transmitting a new 15
request if this relative change exceeds an adjustable parameter called request
transmission threshold.
The optimization of this threshold is a significant
research issue: if it is set too high, the input traffic source' s state switching points may be "missed" (overlooked) by the DCA scheme, leading to reduced QoS performance; conversely, if the threshold is too low, an excessive number of capacity requests would be transmitted, increasing the signaling overhead without necessarily improving the QoS performance significantly. The optimization of the request transmission threshold is related to the optimization of the traffic averaging window size described in Section l.3.2, since both of the se parameters affect the DCA scheme's responsiveness to input traffic variations.
l.3.5. DCA optimization using simulation A simulation model is developed in order to evaluate the DCA performance and to optimize the DCA elements/parameters described in the previous sections. In particular, this optimization includes selecting the capacity request and assignment algorithms (in view of the performance-complexity tradeoff), the traffic averaging window size (in view of the quality-responsiveness tradeoff defined in Section l.3.2), and the request transmission threshold (in view of the performance-signaling tradeoff).
l.3.6. Effects of traffic state switching rate on DCA performance In aH previous sections, it was assumed that the me an state sojoum times of the switched Poisson input traffic sources are greater than the DCA cycle time; this is referred to as slow-switching traffic. This assumption influenced the design of the proposed DCA scheme.
Simulation is now used to evaluate the DCA
performance with fast-switching input traffic (i.e., when the mean state sojoum times of the traffic sources are smaller than the DCA cycle time), and thus, to determine whether the DCA scheme must be adjusted for operation with fastswitching traffic, since it is no longer possible to make the simplifying assumption that each traffic source remains in the same state for the entire duration of a DCA
16
cycle, as in Section l.3.l.
1.4. Thesis logic (flow) summary Having identified in Section l.3 the key elements/parameters affecting DCA performance and the associated research issues to be considered in the thesis, the logic (flow) of the thesis, established in the previous sections, can be summarized as follows. The
multimedia
requirements.
applications
envisioned
for
BSA
have
different
QoS
Furthermore, the traffic generated by these applications
IS In
general bursty; consequently, in the satellite environment, DCA schemes are required in order to provide high satellite link utility while meeting QoS requirements. A DCA scheme that is efficient with regard to link utility may be costly in terms of the required signaling overhead and the complexity of the algorithms used for capacity request and assignment calculation.
Excessive
signaling, while beneficial to DCA responsiveness, requires satellite transmission bandwidth that could otherwise be used for user traffic, thus reducing the link utility and defeating the purpose of DCA. The challenge is therefore to develop a DCA sc he me capable of providing high link utility with low signaling overhead, while maintaining adequate responsiveness in order to satisfy the users' QoS requirements, and low algorithmic complexity in order to reduce computation al requirements and therefore, hardware cost. This challenge can be met through careful consideration and optimization of various DCA elements, notably the capacity request and assignment ca1culation algorithms and the request frequency. DCA performance depends on the assumptions conceming the modeling of the input traffic in the BSA network. Based on a literature survey of multimedia traffic modeling and on the specifies of the BSA environment, a two-state switched Poisson model is considered adequate for the UT's aggregate input traffic.
Such a model can exhibit SRD or LRD behavior, depending on the
probability distribution used to describe the state sojoum times.
The state
switching is generally considered to be slower than the DCA cycle time (i.e., slow-switching traffic), therefore the traffic within a DCA cycle behaves as 17
Poisson traffic. The capacity requests can th us be calculated based on estimates of the mean traffic arrivaI rate; window-based time averaging can be used to this end, with an adjustable window size. Furthermore, to reduce signaling, capacity requests need only be sent when there are significant variations in the estimated me an (as compared to an adjustable request threshold).
Both the averaging
window size and the request threshold should be carefully selected, in order to maintain adequate DCA responsiveness (consistent with meeting the QoS performance requirements) while reducing the signaling overhead. The state switching of the input traffic sources can lead to network overload situations in which the aggregate traffic arrivaI rate to the BSA network momentarily exceeds the total transmission capacity, with detrimental effects on QoS performance. Due to its longer state sojoum times (as compared to SRD traffic), LRD traffic can prolong these overload situations; to determine the extent of this prolongation, the overload times with both traffic types must be compared. The reduced QoS performance resulting from the prolonged overload times can be counteracted by lowering the network traffic load. In cases when the state switching of the input traffic sources is faster than the DCA cycle time (i.e., fast-switching traffic), the sources can no longer be assumed to remain in the same state during a DCA cycle as with slow-switching traffic.
Since this assumption influenced the design of the proposed DCA
scheme, it is necessary to evaluate the DCA performance with fast-switching traffic in order to determine whether the DCA scheme must be modifiedladjusted.
1.5. Thesis organization The remainder of this thesis is organized as follows. In Chapter 2, we provide the backgroundlcontext and reference system architecture necessary for presenting our DCA-related research in subsequent thesis chapters.
We begin with a survey/summary of previous work in BSA
network architectures and CUITent architectural trends, including the DCA concept. Next, we describe the CUITent state of the two IP QoS architectures in terrestrial networks, IntServ and DiffServ, noting that achieving end-to-end IP 18
QoS requires cooperation between multiple networks (since the endpoints of an IP connection are often located in different networks) and between multiple protocol layers within the same network; the scope of the research presented in this thesis is limited to MAC-layer QoS provisioning in the BSA network segment of an end-to-end IP connection. Finally, we describe our proposed architectures for a DiffServ-capable scheduler and UT. In Chapter 3, we present our proposed DCA scheme, which aims to provide high satellite bandwidth utility and satisfy user QoS requirements, while maintaining reduced signaling overhead and algorithmic complexity. We begin by defining an appropriate QoS performance measure, i.e., one that can be used to derive the basic QoS parameters of packet delay and loss.
We then provide a
survey/summary of previous work on DCA schemes for satellite networks. Next, we present the input traffic model used in the BSA network, justifying its validity using results from the literature and assumptions regarding the typical operational environment of the UTs.
We continue by describing the moving-average
estimator of the mean traffic arrivai rate, a key DCA input. Next, we describe the network overload situation and its expected negative performance impact, setting the stage for our subsequent derivation of the network overload probability and mean overload time. Finally, we present our DCA scheme. A key component of the scheme is an analytical expression for the capacity required by each UT to achieve a target QoS for the user traffic; this expression is derived using an analytical queuing model based on the previously selected input traffic mode!. Our DCA sc he me is presented in the form of three study cases, each in itself a self-contained, operational DCA scheme. These three cases represent a logical evolution of the capacity request and assignment algorithms, allowing us to evaluate and compare multiple DCA design options that are in the end consolidated under the third (final) case. Thus, the first two cases are intended only as intermediate steps towards the final case.
Our subsequent simulation
results in Chapter 4 show that this final case represents the best compromise (tradeoff) between QoS performance, signaling overhead and algorithmic complexity.
19
In Chapter 4, we use mainly simulation (but also sorne analytical) results to evaluate the performance of the proposed DCA scheme. Simulation is used for the optimization of the DCA elements/parameters described in Section 1.3; this optimization includes the selection of the capacity request and assignment algorithms (in view of the performance-complexity tradeoff), the traffic averaging window size (in view of the quality-responsiveness tradeoff defined in Section 1.3.2), and of the request transmission threshold (in view of the performancesignaling tradeoff). We begin by describing the simulation model's configuration and selecting appropriate simulation scenarios to evaluate the desired aspects of the DCA performance and facilitate the aforementioned optimization. Next, we present and analyze the simulation results (comparing them to analytical results where appropriate), drawing conclusions regarding the DCA optimization. Finally, we consider the case of fast-switching input traffic, as opposed to the slow-switching traffic considered hitherto: simulation is used to determine how fast-switching traffic affects the DCA performance, and thus, whether the proposed DCA scheme must be adjusted for operation with fast-switching traffic. In Chapter 5, we summarize the work performed in the thesis and briefly restate the conclusions of this work.
These conclusions reflect the resolution of the
research issues considered in the thesis, i.e., those defined in Section 1.3.
20
Chapter 2 : ARCHITECTURES FOR IP QoS-BASED BSA NETWORKS In this chapter, we provide the backgroundlcontext and reference system architecture necessary for presenting our DCA-related research in subsequent thesis chapters. In Section 2.1 we give an overview of previous work in BSA network architectures and CUITent architectural trends, incJuding the DCA concept. In Section 2.2 we describe end-to-end IP QoS and the CUITent state of the two QoS architectures in terrestrial IP networks, IntServ and DiffServ. Finally, in Section 2.3 we present our proposed architectures for a DiffServ-based scheduler and UT.
2.1. BSA network architectures and trends 2.l.l. Overall reference architecture
+
--------------------------s~t~lïit~---------saïëlïlïëAëëeïï--:
-''''"''~i eam M/"-'",
~, ,
,
/
y
\
"
: , ,,1 \
1
:
•
Residence
r-------,
J
\ ,Gateway ,V" "
' .......
-._,,'
"
,1
,,
,
DVB Service Provider
Intemet
-1
WWW
"
Server
i Gateway N ii
\\~ \User Terminal-':
:_______________M~~~~!_ g9_I!!r_~'- §!~!iQIJ _______'~ ~ o. = =:-:___ j
. Residence
U~~~ • Downstream ...~----------------
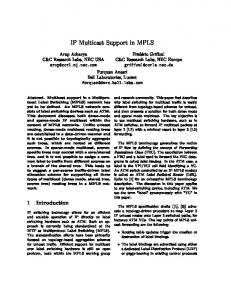
Figure 1: Overall BSA network architecture
Figure 1 shows the overall architecture of a typical bi-directional multi-beam BSA network consisting of UTs, gateways, a satellite and a Master Control Station
21
(MCS). We use this architecture as a reference to provide a context/platfonn for describing our DCA-related research in the subsequent chapters of the thesis. The reference architecture is based on the BSA architecture described in [5].
We
define the downstream direction as the direction of traffic f10wing from the gateways towards the UTs; conversely, the upstream direction refers to traffic f10wing from the UTs towards the gateways.
The downstream and upstream
directions are alternatively referred to as forward link and return link, respectively.
We also define the downlink to refer to transmissions from the
satellite to terrestrial receivers (e.g., the UTs); downlink transmissions are of a broadcast nature. Conversely, the uplink refers to transmissions from terrestrial transmitters to the satellite. The roles of the various components in the BSA network are summarized below. •
The UTs are located at the user premises (typically a corporation or residence). They communicate with the gateways and/or other UTs over the satellite link, allowing the users of the BSA network to access various services offered by service providers (SPs).
The UT is typically equipped with a
standard Local Area Network (LAN) interface (most commonly Ethernet), allowing the user to connect any type of LAN equipment (e.g., PCs, IP phones). •
The gateways provide the interface between the BSA network and terrestrial SP networks. In Figure 1, for instance, a Digital Video Broadcasting (DVB) SP is connected to gateway 1, supplying television service; an Internet SP is connected to gateway N, allowing access to Internet resources such as World Wide Web (WWW) servers.
In principle, a BSA gateway can provide an
interface for any type of terrestrial network (e.g., IP-based Internet, ATM) by using the appropriate protocol translation procedures; in this thesis, however, the emphasis is on IP-based networks. •
The basic function of the satellite is to broadcast on the downlink any traffic received on the uplink.
Depending on the sophistication of its payload
architecture, the satellite may also perfonn other functions such as packet switching or protocol translation as it forwards the traffic, or it may simply
22
forward the traffic as is (see Section 2.1.3 for a more detailed discussion). In BSA applications, the satellite is in geosynchronous orbit. The satellite hop delay is defined as the propagation delay for a single ground-satellite-ground hop; for geosynchronous satellites it is approximately 270 ms. •
The Master Control Station (MeS) provides the overall control/management functions of the satellite network, including resource control (capacity allocation), transmission scheduling and UT authentication and admission.
Satellite networks may offer two types of connectivity depending on the payload architecture: UT-gateway and UT-UT, respectively called star connectivity and
mesh connectivity. Mesh connectivity typically relies on on-board switching and also implies support for star connectivity, but the converse is not necessarily true. For mesh connectivity, the uplinkldownlink nomenclature is more appropriate than the upstream/downstream or forward Iinklretum Iink nomenclature defined above because the gateways are not communication endpoints.
Since BSA
networks are fundamentally access (not backbone) networks, the BSA service model assumes that most communication occurs between the BSA users (i.e., the UTs) and SPs connected to the gateways; hence, BSA networks are associated mostly with star connectivity. Mesh connectivity can be emulated in star-type networks by using two UT-gateway satellite hops (source UT
---+
gateway
---+
destination UT). While this approach is not as efficient as true mesh connectivity and introduces an additional traffic delay due to the extra satellite hop, it nevertheless provides more flexibility for star-type BSA networks without the increased system complexity of mesh-type networks.
2.1.2. Upstream uplink access using MF-TDMA
In BSA networks, the downstream uplink aggregate traffic flow from a gateway to the satellite is considered to be smooth (i.e., the peak-to-average ratio is close to 1) because a gateway transmits the aggregate traffic destined for many UTs, thus benefiting from the smoothing effects of statistical multiplexing. Similarly, the upstream downlink traffic flow from the satellite to the gateway is also considered to be smooth because the gateway receives the aggregate traffic from many UTs. 23
Hence, static (fixed) or, at most, slowly varying capacity allocation is used in these two cases. On the upstream uplink, however, the available transmission capacity is subject to contention among many UTs. The traffic from each UT tends to be bursty because it represents a much smaller degree of aggregation (i.e., only the traffic generated by the applications of the local UT users) than the traffic flowing to/from a gateway. In addition, there are typically tens or hundreds of thousands of UTs in a BSA network. For these reasons, an efficient MAC is required in order to efficiently and fairly share the available upstream uplink transmission capacity among the UTs. MAC scheduling using DCA is at the core of this thesis; hence, many of the architectural aspects described in the present chapter are regarded from the MAC scheduling point of view. Multiple Frequency Time Division Multiple Access (MF-TDMA) [7] is widely used as a primary access scheme for the upstream uplink of satellite communication systems. MF-TDMA is a hybrid of Frequency Division Multiple Access (FDMA) and Time Division Multiple Access (TDMA) technologies: an MF-TDMA frame consists of a set of adjacent-frequency carriers (with appropriate guard bands separating them); each carrier is divided into fixed-Iength time slots using TDMA. Thus, a channel in MF-TDMA is identified by a timefrequency slot in the frame. Each slot can carry a single fixed-size data packet called a cell. The slots in the MF-TDMA frame are shared by the UTs, under the control of the MAC scheduler: each UT may be assigned one or more slots to transmit its traffic (depending on its capacity needs), with the restriction that a UT cannot transmit on multiple carriers simultaneously, in order to reduce the complexity and cost of the transmitter. Thus, each UT's maximum transmission rate is limited to the carrier rate (the capacity of a single carrier). Figure 2 shows the structure of a typical MF-TDMA frame consisting of signaling slots and payload slots. The signaling slots carry capacity request messages (see Section 2.1.4) and are also used by the UTs to synchronize their transmit times (clocks) to the frame. The payload slots carry the user traffic. Figure 2 shows a possible set of slot assignments for 18 UTs; the number in each slot identifies the UT authorized to transmit in that slot. For simplicity, the slots assigned to a UT
24
are usually contiguous, as shown in the figure.
~~~-----------------------Time------------------------~~
l G
1
1
1
2
2
3
4
4
4
4
4
4
4
5
5
5
5
6
6
6
6
6
6
7
7
8
9
9
9
9
9
9
10
10
11
11
12
12
12
13
l3
14
15
16
17
18
18
18
18
$::
ndk ~
(1)
POUT
where k represents the queue type (1, 2 or 3 for the EF, AF and DE queue, respectively) and
POUT
is the desired outage probability, i.e., the probability of the
queue length exceeding nk. In other words, Equation (1) simply states that, with a probability of 1-
POUT,
queue k does not exceed nk packets. Queues requiring
lower delays (sizes), e.g., the EF queue, have lower nk values. A queue is deemed to receive satisfactory QoS if the above criterion is satisfied.
3.2. Background and previous work Since the scheduler assigns MF-TDMA frame slots to the UTs in response to their capacity requests, the slot assignment is demand-based; furthermore, any free (unassigned) slots remaining in the frame after ail the UT requests have been satisfied are distributed among the UTs in a process called Free Capacity Assignment (FCA).
This hybrid assignment scheme, consisting of both a
demand-based component
and
FCA,
is
called
Combined
FreelDemand
Assignment Multiple Access (CF-DAMA) [20], developed in order to improve the delay and Iink utility performance of a geosynchronous satellite link supporting multiple users with bursty input traffic. Since the CF-DAMA concept does not specify the actual algorithms used for the requests and assignments, the 48
CF-DAMA family encompasses a wide range of possible DCA schemes, including the one proposed in this thesis. An alternative to the structured demand-assignment model of CF-DAMA is random slot access, in which the UTs simply transmit their traffic in randomly selected slots, risking collisions with other transmitting UTs. As there is no need to wait for capacity assignments, this method offers immediate slot access, at the cost of poor satellite link utiIity.
In the case of the Slotted Aloha (S-Aloha)
random access scheme, for example, the maximum theoretical link utility is 36.8% [21]; this is considered unacceptable for most satellite networks, given the scarcity and high cost of satellite bandwidth. Consequently, DCA schemes based on CF-DAMA have enjoyed increased popularity.
Since demand-based
assignment is combined with FCA, slot access is immediate at lower network loads (since the bulk of the frame slots are then assigned using FCA), th us matching the latency performance of S-Aloha (at similar loads); as the load increases, CF-DAMA's demand-based component gains more importance, allowing the Iink utility to approach 100%. The original CF-DAMA design in [20] has smce been subjected to detailed performance analysis, and has enjoyed a number of enhancements and refinements, resulting in numerous variants. These variants differ mainly with regard to the request signaling strategy. In [22], the au th ors provide an analysis of the average delay and delay variation performance of a CFDAMA-PB scheme with capacity requests piggybacked (PB) onto payload slots, as described in Section 2.1.4. This request signaIing strategy benefits the UTs already having slot assignments, since the se UTs can immediately transmit capacity requests, while other UTs must wait to receive slot assignments via FCA in order to transmit their requests. Piggybacking the requests onto payload slots results in low signaling overhead, since the requests need not be carried separately in the MF-TDMA frame's signaling area (see Section 2.1.2). In [23] and [24], two other request signaIing strategies are proposed and compared by simulation and analysis, both strategies relying on the MF-TDMA frame's signaIing area. The first pre-assigns (reserves) a signaIing slot for each UT in the network; since the number of UTs
49
typically exceeds the number of signaling slots in the frame, each UT can only access its pre-assigned (PA) slot every n frames. This request signaling strategy is called CFDAMA-PA. The second strategy allows random access (RA) to the signaling slots, risking collisions between capacity requests from multiple UTs; this strategy is called CFDAMA-RA.
It is shown that the PA strategy offers
excellent delay-throughput performance for a low/medium UT population size, while the RA strategy becomes more efficient as the population size increases. Considering the advantages of the PB strategy, reported in [22] and further analyzed in [25], the authors recommend the use of a hybrid PBIRA strategy capable of providing optimal performance across a wide range of population sizes.
This recommendation has been considered in the DVB-RCS standard,
which supports both PB and RA strategies, in addition to the PA strategy (for full flexibility). The hybrid PBIRA strategy described above is further analyzed in [26] under the name "combined request" (CFDAMA-CR). Two methods are proposed to control access to the RA slots, in order to prevent their overuse by certain UTs to the de tri ment of others, and thus, to improve the overall delay-throughput performance. Since controlling access to the RA slots can be considered unfair, a new request signaling strategy is proposed in [27], based on round-robin (RR) assignment of the signaling slots to the UTs; this is a variant of the PA strategy. The performance of the new strategy is assessed by simulation for various input traffic models (Poisson, Pareto ON-OFF, exponential ON-OFF) and compared with the performance of the other request signaling strategies described above. While performance for Poisson traffic is invariant with regard to the signaling strategy, improved delay-throughput performance is obtained with the RR scheme for the ON-OFF traffic models; the distribution of ON and OFF state sojoum times (Pareto or exponential) was found to be less relevant. In [28], a predictive CF-DAMA scheme is proposed (PRDAMA). The scheme uses the variation in the number of packets in each UT's input queue at successive sampling instants in order to predict the traffic's future arrivai trend; this method is based on the local linear approximation (LLA) method [29]. The prediction is
50
used to perform FCA: the free capacity is assigned to the UTs in proportion to each UT's predicted future traffic arrivai trend. Simulation results illustrate the effectiveness of PRDAMA, with beneficial impact on the average packet queuing delay and jitter performance. The literature cited above is concemed primarily with request signaling strategies to improve the performance of CF-DAMA schemes; the actual determination of the capacity request amounts is not considered in great detail, however. Typically, the request amount is simply set to the number of packets currently in the UT queue minus the outstanding request amount; this is true even for the more advanced PRDAMA scheme [28], since the scheme's predictive component is only used for FCA. In addition, a fundamentallimitation of the above CF-DAMA schemes is that they are ail based on a single queue per UT; such schemes cannot be used in a BSA environment supporting service differentiation for multimedia applications, since service differentiation requires managing capacity among multiple queues.
The present thesis addresses this issue in the context of the
DiffServ framework (Section 2.2.3), and suggests specific enhancements to CFDAMA in terms of the UT architecture/functionality and the algorithms and equations used to determine the capacity request and assignment amounts, in accordance with the research issues defined in Section 1.3. In particular, the main advantages of our proposed DCA scheme with regard to those reviewed in the above literature survey are summarized below: •
UT architecture reflecting the DiffServ service classes (see Section 2.3.2).
•
Built-in support for DiffServ service classes in the capacity request and assignment algorithms and equations, as described in Section 3.6 below.
•
Novel capacity request and assignment equations taking the required QoS into account: an analytical model of the queuing performance is used to calculate the amount of capacity required in order to satisfy the QoS criterion of Equation (1) (Section 3.1) for each of the UT's MAC queues, as described in Section 3.6.1 below.
•
Effectiveness with both SRD and LRD input traffic types, i.e., the proposed DCA scheme is not tied to a particular traffic type. This is not true of the
51
PRDAMA scheme described above, for example, because the performance of its predictive component depends on specific characteristics of the input traffic (in particular, strong time correlation). •
Built-in mechanisms for optimizing the DCA performance in vlew of the various tradeoffs described in Section 1.3; in particular, these mechanisms include the moving-average sliding window size described in Section 3.4 below, and the request transmission threshold described in Section 3.6.3.
3.3. Input traffic modeling Although UT hardware and service costs have been steadily decreasing due to advances in multi-beam antenna technology (see Section 2.1.3), the costs are still not low enough for BSA technology to be widely adopted by individual users, especially in geographical areas where terrestrial access alternatives (e.g., cable, DSL) are available. Consequently, we assume that the UTs are typicallY deployed in multi-user environments so the equipment and service costs are shared, lowering the per-user cost; the traffic entering a UT th us represents an aggregate of IP users.
We assume that each UT is connected to several small IP-based
LANs as shown in Figure 6; each sm ail LAN consists of one or more user devices (e.g., PCs) connected to the UT through an aggregation device such as a low-cost Internet access router (available commercially from several manufacturers). Each LAN may represent, for example, a home network in an apartment building (given the increasing number of multiple-computer households) or a corporate network in an office building. Due to the nature of LAN technology, LAN traffic is characterized by an alternation of bursts and idle periods. During the bursts, one of the stations (user devices) connected to the LAN transmits its data at a constant rate, the LAN rate (e.g., 10, 100 or 1000 Mbps for Ethernet); during the idle periods, none of the stations is transmitting. Consequently, the output traffic from each of the small LANs connected to the UT can be modeled by an ON-OFF source with packets generated at the LAN rate in the ON state, and no packets generated in the OFF state, as shown in Figure 6. The state sojourn times of the ON-OFF sources are 52
speeified by a probability distribution. This distribution may be exponential, with probability density funetion (PDF) and me an given by Equation (2):
f(x)
= À.e-,lx E(x)
x>0
(2)
= 1/À.
In this case, the resulting traffie is said to exhibit short-range dependenee (SRD). Altematively, the distribution may exhibit the heavy-tailed property, as for example the Pareto distribution with PDF and mean given by Equation (3): ca
c
f(x)=~
x ca E(x) = - c-l
a:O::::xl
The tail of the PDF deeays more slowly, as suggested by the "heavy-tailed" terminology, and eonsequently, the variance is usually mueh higher; the Pareto distribution of Equation (3), for instance, has an infinite variance (but finite mean) for 1 < c < 2. A heavy-tailed state sojoum time distribution results in traffie exhibiting long-range dependenee (LRD) [30].
~S~~~ SIl1:lIlIP LAN
Output TraHie
J1JlLf
User Tenninal
Output Traftic
SmalilPLAN
•• •
J1JlLf SmalllPLAN
Output TraHie
Figure 6: Typical UT LAN connectivity in a multi-user environment
The SRD and LRD properties refer to the relative deeay rates of the traffie's time autoeorrelation funetion: the deeay rate follows a power law for LRD traffie, and an exponential law (with a faster deeay rate) for SRD traffie. The LRD property 53
indicates that the underlying traffic exhibits self-similarity, i.e., that the traffic appears the same when observed at many different time sc ales ranging from milliseconds to hours. LRD and self-similarity have significant implications for queuing performance: LRD input traffic in queuing systems generally results in longer queues (and thus, increased packet queuing delays and losses) than SRD traffic [30].
Measurements performed on real-world LAN traffic flows have
shown that these flows exhibit LRD and thus, self-similarity [31] [32] [33]. Flow aggregates, however, may exhibit SRD behavior, depending on the number of aggregates. In this thesis, both SRD and LRD input traffic types are therefore considered. Since the output traffic from each small LAN can be modeled as an ON-OFF source as described above, it follows that the aggregate traffic entering the UT from aIl the small LANs is a superposition of ON-OFF sources.
Such a
superposition can be modeled by a switched Poisson process, as described in [34] [35] [36]. In this thesis, we consider a two-state switched Poisson process as illustrated in Figure 7. The packet arrivaI processes in both states are Poisson processes with mean arrivaI rates ÀH and ÀL, so the packet inter-arrivai times are exponentially distributed with means I/À H and lIÀ L , respectively. The state with the higher À value, state.
ÀH ,
is called the "high" state; the other state is called the "Iow"
The mean sojoum times in the high and low states are lIrH and lIrL,
respectively, where rH and rL are the mean transition (switching) rates from the high state to the low state and from the low state to the high state, respectively. The sojoum times are exponentially or Pareto-distributed, depending on the distribution of the ON and OFF times of the individual ON-OFF traffic sources. The resulting switched Poisson process is called a Markov-Modulated Poisson Process (MMPP) [37] in the former case and a Pareto-Modulated Poisson Process (PMPP) [38] in the latter case. If the ON and OFF times of the individual sources are exponentially distributed (as for SRD traffic), their superposition can be modeled by an MMPP [34] [35]; if the ON and OFF times are Pareto-distributed (as for LRD traffic), the superposition can be modeled by a PMPP [36].
54
Figure 7: Two-state switched Poisson process model
In summary, the aggregate traffic at the input of the UT can be modeled by an MMPP (for SRD traffic) or PMPP (for LRD traffic). Consequently, we model the aggregate input traffic in each of the UT's three MAC queues by a two-state MMPP or PMPP traffic source. Each source switches (toggles) between its two states independently of the other sources, i.e., the state switching points are not synchronized. Each UT queue and its associated traffic source together form an
MMPP/OII or PMPP/O/1 queuing system. The mean sojoum times, 1/rH and 1/rL, are set greater than the DCA cycle time defined in Section 2.1.4, so that each
traffic source can be assumed to remain in the same state for the entire duration of a DCA cycle. Consequently, the traffic within the DCA cycle behaves as simple (non-switched) Poisson traffic, so that within this time interval, the queuing system can be treated as an MlO/1 system, which lends itself more easily to analysis than an MMPP/GII or PMPP/G/1 system. This simplification is used in the derivation presented in Section 3.6.1 of the service rate (capacity) required for each of the UT's MAC queues in order to satisfy the QoS criterion of Equation (1) (Section 3.1).
3.4. Moving-average estimation orthe mean traffic arrivai rate Recall from Section 2.3.2 that one of the functions of the UT's Capacity Estimator module (more specifically, the Traffic Parameter Estimator sub-module) is to estimate various parameters of the input traffic in each of the UT's MAC queues. Since the traffic can be treated as simple (non-switched) Poisson traffic during a DCA cycle, as described in Section 3.3, the only relevant traffic parameter is the mean arrivaI rate during the cycle, which is either ÀH or ÀL depending on the input
55
traffic source's CUITent state. In this section, we describe a method for estimating the mean arrivai rate in each queue (service c1ass) using a moving time-average, also called a sliding-window average, of cell arrivais. First, we define the following variables:
•
L: The sliding window size in frames, i.e., the number of consecutive MFTDMA frames over which the time average is taken.
•
ak:
A list of length L storing a history of the number of cell arrivais in the
UT's queue k for the last L frames. Elementj of ak (j = 1,00 .,L) is denoted by akj
and represents the number of cell arrivalsj-l frames ago, withj=l denoting
the CUITent frame (at the head of the Iist) andj=L, the oldest (at the tail). The list is updated once per frame:
akL
(the number of cell arrivais L-l frames ago)
is removed from the tail and the number of cell arrivais in the CUITent frame is added to the head; this is the sliding-window mechanism. The moving timeaverage is then recalculated using the updated list. •
TF: The MF-TDMA frame time, i.e., the frame's duration.
We assume
TF=26.5 ms, typical for real-world satellite communication systems. With the above definitions, the estimated mean traffic arrivai rate in queue k,
À-k,
is given by the moving average:
(4)
With a smaller window size L, the moving average covers a shorter time span (fewer frames) and thus, follows the instantaneous traffic arrivai rate more c1osely, responding more quickly to traffic transients and to state changes of the switched Poisson input traffic source. This implies high variation in the estimated mean. As Lis increased, the estimated mean becomes smoother, i.e., the estimate is of better quality, possibly leading to improved DCA performance; the downside is that the estimate responds more slowly to traffic variations such as the traffic source's state switching point, with the opposite effect of reducing DCA performance.
As noted in Section 1.3.2, there is thus a tradeoff between the
estimate's quality and its responsiveness; this tradeoff is investigated in Chapter 4
56
through the optimization of the window Slze
In
order to maximize DCA
performance.
3.5. Network overload probability and mean overload time As described in Section 3.3, the input traffic in the BSA network is modeled by two-state switched Poisson traffic sources (one source for each UT MAC queue). With the parameters of the se sources (.,{H, À.t, rH and rd defined in Section 3.3, the mean rate À. of the traffic generated by each source is given by ÀH
À
rH
rL
1
1
rH
rL
L -+-
,1=
(5)
-+-
It foIlows that the aggregate mean traffic arrivaI rate in an uplink beam (from aIl the UTs in the beam) is simply given by multiplying the per-source mean rate of Equation (5) by the total number of traffic sources, which is equal to three times the number of UTs in the beam since each UT has three MAC queues with one source per queue. If enough of the switched Poisson traffic sources in an uplink beam are
simultaneously in their "high" state, the aggregate traffic arrivaI rate in the beam may momentarily exceed the beam's total uplink transmission capacity, although the aggregate mean arrivaI rate does not.
This situation is caIled a network
overload, and persists until sorne of the traffic sources in the "high" state switch to the "low" state. During network overloads, the traffic arrivaI rates to the UT queues exceed the queue service rates because there is insufficient transmission capacity available in the affected uplink beam; the queues therefore bec orne unstable (build up), resulting in increased queuing delays and/or packet losses (i.e., worse QoS performance). Consequently, the overloads'
occurrence
frequency and duration both affect the performance; overloads should only occur rarely (i.e., the overload probability should be low) and their duration should be short, in order to minimize their performance impact. The overload duration is related to the state sojoum times of the traffic sources: longer sojoum times lead
57
to longer overload times, because more time elapses before traffic sources in the "high" state switch to the "Iow" state, th us ending the overload. As described in Section 3.3, LRD PMPP traffic, with its heavy-tailed Pareto sojourn time distribution, generally exhibits longer sojourn times with higher probabilities than SRD MMPP traffic (for the same mean sojourn time). The network overload times are thus presumably longer with PMPP input traffic (and LRD traffic in general); to determine the difference, the overload times with MMPP and PMPP traffic must be compared.
The reduced QoS performance resulting from the
prolonged overload times with PMPP traffic can be counteracted by lowering the network traffic load; this is investigated in Chapter 4. In this section, we derive expressions for the network overload probabiIity and mean overload time; numerical results obtained using these expressions are presented in Chapter 4, along with corresponding simulation results for comparison and discussion.
3.5.1. Network overload probability First, we define the following variables: •
N: The total number of UTs in the uplink beam.
•
M
H
:
The total number of switched Poisson traffic sources in the upIink
beam that are currently in the "high" state. The number of sources in the "Iow" state is given by 3N - M H • •
S: The total uplink transmission capacity (in cells/sec), obtained by dividing the number of payload slots in the MF-TDMA frame by the frame time (duration) TF.
The aggregate traffic anival rate
IS
M H ÀH + (3N - M H )ÀL .
It follows that the
network overload probability can be succinctly expressed as
P{(M HÀH + (3N - MH )ÀL » S} or equivalently,
(6) Equation (6) states that the desired probability is given by the survival function of
58
M
H
.
Since M H is the number of switched Poisson traffic sources that are currently
in the "high" state (out of a total 3N traffic sources), and the sources operate independently of each other (i.e., a source's state changes do not affect the state changes of other sources), M H is binomially distributed. Denoting the mean state sojoum time in the "high" and "low" state by
Pr{M
H
}
SH = lIrH
and
SL
=
lIrL,
respectively,
is thus the binomial probability mass function (PMF):
(7) Consequently, Equation (6) is the binomial survival function, i.e., the one's complement of the binomial cumulative distribution function (CDF). Since there is no simple closed-fonn expression for this CDF, the desired survival function can be calculated using the PMF of Equation (7):
where
LJdenotes the floor operator.
3.5.2. Mean network overload time In this section, we derive an expressIOn for the mean duration of a network overload, i.e., the mean overload time. Our derivation uses Markov analysis and is thus only valid for MMPP input traffic.
The corresponding derivation for
PMPP traffic is considerably more complex and is not considered in the thesis; instead, simulation is used to evaluate the mean overload time for PMPP traffic. Let MH(t) be a continuous-time, integer-valued random process representing the number of traffic sources in the uplink beam that are in the high state at time t. MH(t) remains at a given value (state) until a state transition occurs in one of the
traffic sources: if a source moves from the high to the low state, MH(t) decreases by 1 and conversely, if a source moves from the low to the high state, MH(t) increases by l. Consequently, the sojoum time of MH(t) at a given value (state) is the minimum of the state sojoum times of the 3N traffic sources in the uplink beam. By definition, the state sojoum time of an MMPP source is exponentially 59
distributed so the state sojoum time of MH(t) is the minimum of 3N independent exponentially distributed random variables, which is also an exponential random variable l . Consequently, since the state sojoum time of MH(t) is exponentially distributed, MH(t) is a Markov chain. To determine the mean transition rate of MH(t) from state 0 to state 1, we recognize that such a transition signifies that one of the 3N traffic sources in the uplink beam has moved from the low state to the high state, with ail the other sources in the "Iow" state. Since rH and rL are the mean transition rates of the traffic sources out of the high and low states, respectively, the mean transition rate of MH(t) from state 0 to state 1 is th us 3NrL (the minimum of 3N i.i.d. exponential random variables with rate rL is also exponential with rate 3Nrd. Similarly, a transition from state 1 to state 2 signifies that one of the 3N - 1 traffic sources that were still in the low state has just moved to the high state; consequently, the me an transition rate from state 1 to state 2 is (3N - l)rL. Generally, the transition rate from state m to state m + 1 is (3N - m)rL. By the same reasoning, it is not difficult to see that the transition rate from state m to state m - 1 is mrH. Consequently, since the only possible transitions out of state mare to the adjacent states m+ 1 or m-l (i.e., MH(t) is a birth-and-death process), the me an transition rate out of state m is (3N - m)rL
+ mrH. The mean sojoum time in state m is th us 1 /
[(3N - m)rL +
mrH]. Figure 8 shows the state transition diagram of MH(t). 3Nr
(3N-1)rL
r
2r
(3N-2)rL
3N-1
(3N-1)rH Figure 8: State transition diagram of MH(t)
Next, from Equation (6), the threshold number of traffic sources that must be in the high state in order to cause a network overload is:
1
From probability theory, the minimum of n independent exponential random variables with rates is an exponential random variable with rate)./ + ... + ).n.
)./, "").n
60
M H*
=lS-3NÀL ÀH -ÀL
+IJ
An overload occurs for MH(t) 2: M H*. We can th us group the states of MH(t) into two categories: the "overload" states for which MH(t) 2: M H* and the "nonoverload" states for which MH(t) < M H*. MH(t) can thus be abstracted as a twostate system, as shown in Figure 9:
nonoverload
Figure 9: Two-state abstraction of M H «()
We are interested in calculating r2, the me an transition rate of MH(t) out of the overload state, because the mean overload time that we wish to derive is simply given by the inverse of this rate. We note that the only possible way for MH(t) to leave the overload state is by moving from the threshold state MH * to state MH*-1; this is because MH(t) is a birth-and-death process so only transitions between adjacent states are possible. r2 is thus given by r2
= Pr{MH(t)=MH+1 MH(t) is in overload} • (transition rate from state M H+ to state M H+= pr{MH(t)=MH+1 MH(t)~MH+} • (transition rate from state MW to state M H+ - 1)
1)
(9)
The first term in Equation (9) is the probability that MH(t) is in state M H* given the knowledge that there is a network overload, i.e., that MH(t) 2: M H*. The second term in Equation (9) is the state transition rate from MH * to MH *-1. Thus, we have P{MH(t)=M H*} e
3N
Ip{M H (t)
M H*
rH
= m}
m=M II '
The mean overload time is th us given by 3N
Ip{M m=M
r2
H
(t)
= m}
II "
(10)
P{MH(t)=MH+}eMH*r H
The state probabilities Pr{MH(t)
=m} in Equation (10) are binomially distributed, 61
as described in Section 3.5.1 (Equation (7».
3.6. Proposed DCA scheme As described in Section 2.3.2, each UT's DCA functionality is split between the Capacity Estimator and MAC Management modules; the former is responsible for estimating the input traffic parameters and using them to calculate the capacity required in order to satisfy the QoS criterion of Equation (1) (Section 3.1), and the latter is responsible for calculating the capacity request amounts, transmitting the requests to the scheduler, and distributing the capacity assigned by the scheduler among the UT's three MAC queues. The scheduler uses the received capacity requests to assign the MF-TDMA frame slots to the UTs. Recall from Section 2.3.2 that if the scheduler's operation is assumed to conform to the DVB-RCS standard, each UT must perform a mapping between the capacity request amount for each MAC queue (EF, AF and DE) and the DVB-RCS capacity request categories.
In this section, however, to avoid
obscuringldiluting our discussion of the proposed DCA scheme, we exclude this mapping operation. The work of Sections 3.1, 3.3 and 3.4 is now integrated coherently into our proposed DCA scheme.
An evolutionary approach is taken in presenting the
scheme using three study cases, each in itself a self-contained, operational DCA scheme. These three cases represent a logical evolution of the capacity request and assignment algorithms, allowing us to evaluate and compare multiple DCA design options that are in the end consolidated under the third (final) case. Thus, the first two cases are intended only as intermediate steps towards the final case. The three cases are described in the following subsections, and their anticipated performance differences are described.
Subsequently, simulation is used in
Chapter 4 to evaluate the performance of the three cases, and thus, to verify the anticipated differences; the simulation results show that the third (final) case represents the best compromise (tradeoff) between QoS performance, signaling overhead and algorithmic complexity.
62
3.6.1. Case 1 (Cl): Frame-based reguests with known traffic arrivai rates (as baseline) This case serves as our starting point, in order to establish a reference (baseline) performance level for subsequent comparison with the performance of the two other cases, whose design is derived from this baseline case. Each UT sends a capacity request and receives an assignment from the scheduler every MF-TDMA frame; the DCA is thus performed on a frame-by-frame basis. The number of MF-TDMA slots requested by the UT for each of its MAC queues is equal to the number of new cell arrivais in the queue since the last request (in the previous frame); this strategy is similar to that used by the CF-DAMA schemes reviewed in the literature survey of Section 3.2.
In addition to the
number of new arrivais in each queue, however, our scheme's capacity request message also contains estimates of the capacity required for each queue in order to satisfy the QoS criterion of Equation (1) (Section 3.1). The scheduler uses these estimates to perform FCA of any remaining unassigned slots in the frame after all UT requests have been satisfied, as previously discussed in Section 3.2 (details of the scheduling algorithm are provided later in this section).
As
explained in Section 2.3.2, the estimation of the required capacity is performed by the UT's Capacity Estimator module, consisting of the Traffic Parame ter Estimator and Required Capacity Calculator sub-modules. The operation of the former was detailed in Section 3.4. Below, we describe the operation of the latter. Recall from Section 3.3 that each UT MAC queue and its associated switched Poisson input traffic source together form an MMPP/OIl or PMPP/O/l queuing system that can be treated as a simpler MlOIl system for the duration of a DCA cycle, because the mean state sojoum times of each traffic source are set greater than the DCA cycle time, so that each source can be assumed to remain in the same state during the DCA cycle. With a constant queue service rate, the MlO/l system becomes MlD/l.
Of course, in reality the service rate is not constant
because the capacity assigned to each UT by the scheduler is variable, depending on the UT's capacity request amounts as well as the request amounts of the other UTs in the same uplink beam. For the moment, however, let us assume that the
63
service rate is constant. An upper bound for Pr{ Q~n} for an MlDIl system is given in [39]: Pr{ Q~n} :5 e-J'fl
(11)
In the above expression, yis the solution of the following equation:
peY=y+p
(12)
where p = À/C is the normalized queue load, À is the mean packet arrivai rate to the queue and C denotes the queue service rate_ It is not difficult to derive an expression for C as a function of À, n and Pr{ Q>n}_
Noting that
Pr{ Q>n }=Pr{ Q~n+ 1} and using Equation (11) as an approximation rather than an upper bound, we obtain y==
lnPr{Q > 11) 11
(13)
+1
Now, from Equation (12), e Y -1
(14)
C=À-y
Equations (13) and (14) aIlow us to calculate the capacity required for each of the UT's MAC queues in order to satisfy the QoS criterion of Equation (1) (Section 3_1): Pr{ Q>n} in Equation (13) is set to the desired outage probability is set to the desired
nk
POUT,
and n
value for queue k. Equation (14) indicates that the required
capacity C> À. Furthermore, as n is decreased, yincreases, so C aiso increases; intuitively, this is logical since lower
11
values indicate sm aIler required queue
sizes and delays (in other words, more stringent QoS requirements). The mean traffic arrivaI rate À in Equation (14) can be estimated using a moving time-average of ceIl arrivais, as described in Section 3.4; this is applied to the second and third DCA cases, described in Sections 3.6.2 and 3.6.3 below. For this initial (baseline) case, however, we assume that the me an traffic arrivai rates ÀH and ÀL of each MAC queue's input traffic source are known by the UT, and
that the UT can detect the traffic source's state changes, aIlowing the required capacity C to be recalculated whenever a state change occurs, using Equation (14) with the À value corresponding to the new state (ÀH or À L).
The above
assumptions (that the mean arrivai rates and state switching points are known) are
64
admittedly somewhat unrealistic; their purpose is simply to provide a point of reference for assessing the DCA performance degradation, if any, resulting from estimating À (rather than assuming it known) in our second and third DCA cases. As noted previously, the capacity assigned to each UT by the scheduler is variable; the UT may not al ways obtain ail of its requested capacity due to contention from the other UTs in the same uplink beam, particularly during periods of high network load. Consequently, the service rate of each MAC queue f1uctuates around the optimal value given by Equation (14); when the service rate is less than this optimal value, the QoS criterion of Equation (1) may be momentarily violated until the service rate increases.
Nevertheless, Equations
(13) and (14) provide a good guideline (approximation) of the capacity required. The method used by each UT to distribute the capacity assigned by the scheduler among its three MAC queues is described below, after defining the following variables: •
Ai: The number of MF-TDMA frame slots assigned to UT
by the
scheduler in the current frame.
•
Dik: The number of slots distributed by UT i to its queue k (with k
= 1,2,3
representing the EF, AF and DE queues, respectively).
•
Ck: The required capacity (service rate) calculated by UT i for its queue k using Equations (13) and (14).
The UT distributes the assignment Ai from the scheduler among its MAC queues in proportion to the required capacities Ck:
(15)
Assuming that the queues are non-empty, Equation (15) is equivalent to Weighted Fair Queuing (WFQ) [40] with the weight of queue k equal to Ck. The capacity distribution dynamically adapts to changing input traffic conditions as the Ck'S are updated (recalculated) in response to state changes of the corresponding input traffic sources. Since queues with more stringent QoS requirements (Iower nk
65
values), e.g., the EF queue, have higher Ck values, these queues receive a larger share of the assigned capacity A;. Fractional slots cannot be distributed, so
Dik
rounded down to an integer number of slots, as indicated by the floor operator
is
LJ
in Equation (15); this rounding may result in a small number of leftover slots, 3
since Ai - LDik may be > 0; in this case, the remaining slots are distributed using k=l
a priority queuing scheme [40] with the EF queue given the highest priority and the DE queue, the lowest
(EF~AF~DE);
this is reasonable, since the EF queue
has the most stringent QoS requirements, followed by the AF queue (by definition, the DE queue has no QoS requirements and thus, receives the lowest priority). Once per frame, the scheduler runs an algorithm to assign capacity to ail the UTs in the uplink beam. The scheduler maintains a list of ail these UTs, and performs three successive passes through the list, assigning capacity for the EF service class, followed by the AF class, and finally the DE class, as shown in the pseudocode in Figure 10. We define the following variables: •
N : The total number of UTs in the uplink beam.
•
Rik:
The capacity requested by UT i for its queue k (equal to the number of
new cell arrivais in queue k since the last frame, as described previously). •
Rk_CUMULATlVE:
A cumulative counter of the outstanding (ungranted)
capacity requested by UT i for its queue k.
This counter is further
described below. •
carrier_capacity: The total number of payload slots per carrier in the MF-
TDMA frame. Recall from Section 2.1.2 that the UT cannot transmit on multiple carriers simultaneously in order to reduce the complexity and cost of its transmitter; the number of slots assigned to the UT per frame must therefore not exceed carrier_capacity. •
SF : The total number of payload slots in the frame (the frame capacity).
66
= =
SF total numberofpayload slots inframe for i 1, ... ,N
A=O
=
for k 1, ... ,3 for i 1, ... ,N
=
=
Rik_CUMUL4TlVE Rik_CUMUL4TlVE + Rk assignment min(Rk_CUMUL4TlVE, carrier_capa city, SF) Rik_CUMUL4TlVE R ik_CUMUL4TlVE - assignment SF SF - assignment Ai A + assignment
=
= =
=
Figure 10: Scheduling algorithm (pseudo-code)
We make the following observations regarding the above scheduling algorithm: •
The three-pass process (k
= 1,2,3) gives higher assignment priority to service
classes with lower k values: aIl the EF capacity requests (k
= 1) are granted
first, followed by the AF requests (k = 2), and finally the DE requests (k = 3). During periods of high network load, the scheduler may run out of frame slots to assign (SF may be decremented to zero) before completing the third pass, in which case the service classes with higher k values are deprived of capacity. •
As noted above, the scheduler may run out of frame slots before completing the capacity assignment process. In order to avoid giving an unfair advantage to UTs nearer to the beginning of the UT list, the assignment process does not always begin with the first UT in the list (i=l) as indicated in Figure 10. Instead, the scheduler records the list position of the last UT served before running out of frame slots; the assignment process in the next frame begins with the next UT in the list. This behavior is not shown in Figure 10, in order to avoid cluttering the pseudo-code.
•
The scheduler accumulates the capacity requests received from the UTs by maintaining cumulative request counters R ik_CUMUL4TlVE for ail i and k. Each new capacity request Rik is added to Rik_CUMUL4TlVE; similarly, any capacity assigned to a UT is subtracted from the corresponding Rik_CUMUL4TlVE, as shown in Figure 10. In simpler terms, the scheduler "remembers" capacity requests that have not yet been granted and eventually assigns this outstanding
67
capacity, possibly spread out over multiple frames (depending on the availability of capacity in the system and the assignment restriction imposed by the carrier capacity limit described above). If there are unassigned (free) slots remaining in the frame after ail the capacity
requests have been granted (i.e., if SF > 0 upon completion of the scheduling algorithm in Figure 10), the scheduler performs free capacity assignment (FCA). The free slots are assigned in proportion to each UT's required capacity values
Ck; denoting the number of free slots by F, we have 3
IC;k -;-;,,-,k==,-;I:---F
N
3
(16)
IIC;k ;=1 k=1
As in Equation (15), the rounding in Equation (16) may result in a small number of leftover (unassigned) slots, which are distributed among the UTs in a roundrobin fashion.
3.6.2. Case 2 (C2): Frame-based requests with estimated traffic arrivai rates This case is defined primarily
In
order to assess the DCA performance
degradation, if any, resulting from estimating the mean traffic arrivai rate rather than assuming it known as in Cl; this comparison is performed in Chapter 4. Recall that in the baseline DCA case Cl (Section 3.6.1), we assumed that the mean traffic arrivai rates ÀH and ÀL of each MAC queue's input traffic source are known by the UT, and that the UT can detect the traffic source' s state changes, allowing the required capacity Ck to be recalculated whenever a state change occurs, using Equation (14) with the À value corresponding to the new state (À H or
Àd. Now, for our second case
C2, a more practical approach is used: we
incorporate the work from Section 3.4 into the DCA scheme, allowing À in Equation (14) to be estimated using the moving time-average of cell arrivais; the value of this average is updated every frame.
Apart from estimating À, C2 is
otherwise identical to Cl.
68
3.6.3. Case 3 (C3): Reduced request and assignment freguency (signaling) and simplified scheduling algorithm This final case is defined with two objectives in mind: first, to reduce the required signaling overhead (as compared to the first two cases Cl and C2); and second, to reduce the complexity of the scheduIing algorithm. Both of these objectives are desirable in practical BSA networks: reducing the signaIing overhead makes satellite transmission bandwidth previously used for signaling available for user traffic, decreasing the service cost per unit bandwidth; similarly, reducing the complexity of the scheduIing algorithm simplifies its implementation, reducing computation al requirements and thus, cost. In Chapter 4, the performance of C3 is compared to that of the previous cases in order to determine whether the reduced signaling and complexity of C3 incur a performance penalty. As noted above, the first goal of this DCA case is to implement a mechanism allowing the amount of signaling required for the capacity requests and assignments to be reduced. This is accompli shed by reducing the request and assignment frequency; recall that in Cl and C2, the DCA is performed on a frame-by-frame basis, meaning that each UT sends a capacity request per frame. Now, in C3, a request for service c1ass (queue) k is only sent if the required capacity for queue k in the CUITent frame,
Cik_CURRENT,
differs by more than a
specified percentage from the required capacity at the time of the previous capacity request,
Cik]REVlOUS
(recall that the required capacities are calculated
using Equation (14». Denoting the relative change in A. _
LJ,k -
Cik
ICik _ CURRENT - Cik _ PREV/OUS 1
by ih, (17)
C ik _ PREV/OUS
Each UT i calculates J ik for k
= l, ... ,3 once per frame.
The UT sends a capacity
request for queue k only if J ik > J TH , where J TH is the request transmission threshold. At the scheduler, a request remains valid until it is replaced by a new request, i.e., if in the CUITent frame the scheduler does not receive a new request from UT i for queue k, the UT's request for queue k is set equal to the last request received for queue k from the UT. As J TH is increased, the amount of signaIing decreases because fewer capacity
69
requests and assignments are transmitted per unit time. The inconvenience is that the scheduler must rely on older request information for the capacity assignment process; depending on the L1 TH setting, this older information may no longer reflect the CUITent input traffic conditions at the UT, resulting in sub-optimal capacity assignments (and thus, decreased performance).
In other words, the
DCA becomes less responsive to input traffic variations as L1 TH is increased. As noted in Section l.2, a tradeoff (compromise) is thus required between DCA performance and signaling overhead. Since L1 TH allows the signaling overhead to be adjusted, it is the primary parameter used to investigate this tradeoff. The moving-average window size L described in Section 3.4 also affects the signaling overhead, albeit indirectly: as L is increased, the average traffic arrivai rate ::i k becomes smoother (Jess variable), as does the required capacity linear dependence on ::i k through Equation (14). changes
L1ik
in
Cik
are generally smaller, meaning that
Cik
due to its
Consequently, the relative L1ik
is less likely to exceed a
given L1 TH , thus decreasing the request frequency and signaling overhead. L could therefore be used as a secondary parameter for investigating the performancesignaling tradeoff;
L1 TH
is the preferred parameter, however, due to its more direct
relationship to the signaling overhead, as described above. The optimization of
L1 TH and L is performed in Chapter 4. The second goal of our final DCA case is to simplify the scheduling algorithm as compared to the algorithm used in Cl and C2, described in Section 3.6.1 (Figure 10). Simplification is especially important if the scheduler is located on board the satellite where computing and power resources are more limited, but is also desirable with a ground-based scheduler. The simplified algorithm assigns the entire frame capacity (slots) purely in proportion to each UT's required capacity values
Cik.
Recall that in the previous cases (Cl and C2), only the free capacity
was assigned in this manner using Equation (16); the bulk of the frame capacity was assigned using the scheduling algorithm in Figure 10. In our final case, the capacity Ai assigned to UT i is th us simply given by
70
3
LC;k SF LLC;k k=1
N
(18)
3
;=1 k=1
where SF denotes the total number of payload slots in the frame, as defined previously. The entire scheduling algorithm is th us elegantly reduced to Equation (18), greatly simplifying the scheduler's operation. As before, any leftover slots due to rounding in Equation (18) are assigned to the UTs in a round-robin fashion. In addition to providing simpler operation, the new scheduling algorithm also reduces the signaling overhead independently of the request transmission threshold mechanism described previously (Equation (17».
Recall that in our
previous DCA cases (Cl and C2), each capacity request message contains: •
The originating UT's unique identifier i.
•
The capacity request amounts
Rik
for k
= 1, ... ,3,
equal to the number of
new cell arrivais in queue k since the previous request. •
The required capacity
Cik
for k = 1, ... ,3, calculated using Equation (14).
In Cl and C2, the Rik'S were used by the scheduling algorithm in Figure 10. Since the simplified algorithm (Equation (18» only uses the
Cik'S,
the Rik'S are no longer
included in the capacity request messages, reducing their size, and thus, the signaling overhead. Furthermore, in Equation (18), only the sum of the
Ck'S
over
ail k is used, so the UT can calculate and send this sum instead of the individual
Ck values in order to further reduce the signaling overhead (this is also true for Cl and C2). The reduced complexity of C3's scheduling algorithm may come at the price of decreased DCA performance; as described in Section 1.2, a performancecomplexity tradeoff may therefore be required, and is investigated in Chapter 4.
71
Chapter 4 : PERFORMANCE EVALUATION In this chapter, we use mainly simulation (but also sorne analytical) results to evaluate the performance of the DCA scheme proposed in Section 3.6, including the three defined cases.
Simulation is used for the optimization of the DCA
elements/parameters described in Section 1.3; in particular, this optimization includes the selection of a case from among the three defined cases (in view of the performance - algorithmic complexity tradeoff), and the setting of the traffic averaging window size (in view of the quality-responsiveness tradeoff defined in Section 3.4) and request transmission threshold (in view of the performancesignaling tradeoff).
In Section 4.1, we describe the simulation model' s
configuration and select appropriate simulation scenarios allowing us to evaluate the desired aspects of the DCA performance, facilitating the aforementioned optimization. Next, in Section 4.2 we present and analyze the simulation results (comparing them to analytical results where appropriate), drawing conclusions regarding the DCA optimization. FinaIly, in Section 4.2.4 we consider the case of fast-switching input traffic (see Section 1.3.6), as opposed to the slow-switching traffic considered hitherto; simulation is used to determine how fast-switching traffic affects the DCA performance, and thus, whether the proposed DCA scheme must be adjusted to compensate.
4.1. Simulation model description To evaluate the DCA performance, we developed a simulation model of the BSA network's upstream uplink traffic path and DCA-related functionality, using OPNET network simulation software. The simulation model includes a centralized scheduler and a number of UTs with switched Poisson input traffic sources generating the uplink traffic, as described in Section 3.3; the architectures and functionalities of the various components in the simulation model conform to the descriptions given in the previous chapters of the thesis. The performance results collected by the model include the average cell queuing delays in the UT MAC queues, the queue size survival functions, the network overload probability,
72
mean overload time and overload time survival function. Since upstream traffic enters the BSA network via the UTs and exits via the gateways, the total delay experienced by upstream traffic
in
the BSA network consists of the
aforementioned UT queuing delay, the cell transmission time and the satellite hop delay. Since the cell transmission time and satellite propagation delay are fixed and known, our study focuses on the queuing delay.
4.1.1. Model configuration To maintain reasonable simulation run times and computer memory requirements, we only simulate a single uplink beam. This does not limit the generality of our results, however, because in a multi-beam environment each uplink beam's transmission resources (carriers) are independent of other beams' resources, so the DCA process is simply duplicated: each uplink beam conceptually has its own scheduler that serves only the UTs in that beam, as described in Section 2.3.1. Aiso in the interest of maintaining reasonable run times and memory requirements, we simulate a scaled-down BSA network consisting of fewer UTs and a correspondingly sm aller MF-TDMA frame than in typical real-world networks. Our results and conclusions, however, also apply to full-size networks. The configuration of our simulation model is presented below. This configuration is common to ail the simulation scenarios described subsequently in Section 4.1.2. User terminais: There are 32 UTs, of which 24 are "Iow-traffic" and the remaining 8 are "high-traffic". As the se designations imply, the traffic sources in the high-traffic UTs generate traffic with a higher mean rate than the sources in the low-traffic UTs, as specified by our network loading strategy in Section 4.1.2.1. The reason for using two types of UTs instead of a single homogeneous group is to better reflect the conditions in real-world networks, where users often have different bandwidth requirements. Satellite hop delay: The satellite hop delay is the propagation time required for a single ground-satellite-ground hop, 270ms for a geo-synchronous satellite. We assume that the scheduler is ground-based, so the process of making a capacity request and receiving an assignment requires two satellite hops (540ms); this is 73
the DCA cycle time or request-to-assignment time. Input traffic sources: As described in Section 3.3, each UT's aggregate traffic flow (from the UT's users) is modeled by a switched Poisson process; we use two-state MMPP and PMPP traffic sources to model SRD and LRD traffic, respectively.
There are three identical sources per UT, each generating input
traffic for one of the UT's three MAC queues (EF, AF and DE). Recall from Section 3.5 that the mean rate À of the traffic generated by each source is given by Equation (5), copied below for convenience: ÀH
À
rH
rL
1
1
rH
rL
L -+-
À=
-+-
The values of ÀH and ÀL of each traffic source are chosen so as to obtain various total network loads (from aIl the traffic sources), as specified by our network loading strategy in Section 4.1.2.1. We set ÀH = 5À L , i.e., the me an traffic rate in the "high" state is five times that in the "Iow" state; this difference creates burstiness in the generated traffic. We use equal me an state sojoum times in both states: lIrH
= lIrL = 3.25
seconds, approximately 6 times the DCA cycle time
specified above (6*0.540=3.24 seconds), in accordance with our assumption in Section 3.3 that the mean state sojoum times are greater than the DCA cycle time. MF-TDMA frame: The frame consists of 8 carriers, each with 32 payload timeslots, for a total of 256 payload slots per frame. The frame time (duration) TF is 26.5 ms, which is typical for existing satellite networks. The slot size is 53 bytes, coinciding with the cell size in Asynchronous Transfer Mode (ATM) networks [40]; numerous existing satellite networks are ATM-based because ATM was the transport architecture of choice when these networks were designed.
We
therefore use this slot size for compatibility purposes, but we emphasize that the BSA architectures described in this thesis are based on IP and DiffServ, not ATM. With the frame parameters given above, the total upstream uplink information transmission rate 2 is 4 Mb/s, or 512 kb/s per carrier. As noted in Section 2.1.2, a
2 The information transmission rate is the useable rate for user traffic, exc\uding coding, signaling and other transmission overhead.
74
UT cannot transmit on multiple carriers simultaneously in order to reduce the complexity and cost of its transmitter, so the UT's maximum transmission rate is 512 kb/s (the carrier capacity). OoS parameters: Recall from Section 3.1 that the queue size
nk
(in celIs) is used in
Equation (1) to specify the required QoS for each UT MAC queue (service class), with k = l, 2, 3 denoting the EF, AF and DE queue, respectively. We set
n2=115 and n3=150, with the out age probability
POUT
= 10.3.
nI =75,
Thus, the EF, AF
and DE queues must not exceed 75, 115 and 150 celIs, respectively, with a probabilityof 1_10. 3 = 0.999.
4.1.2. Simulation scenarios We use the following simulation scenarios to evaluate and highlight vanous aspects of the DCA performance, in accordance with the research issues and DCA optimization defined in Section 1.3.
4.1.2.1. Network loading
To evaluate and compare the performance of the proposed DCA cases under various network loading conditions ranging from light to heavy, simulations are run for normalized network loads of 50, 60, 70, 75, 80, 85, 90 and 95% of the total uplink capacity (4 Mb/s, as given in Section 4.1.1). Performance differences between the DCA cases are expected to become more apparent as the load is increased, since the DCA is more heavily stressed.
The load is split evenly
between the low-traffic and high-traffic UTs: the 24 low-traffic UTs generate 50% of the network load and the remaining 8 high-traffic UTs generate the other 50%. The load generated by a single low-traffic UT is thus 50/24=2.08% of the network load; for a high-traffic UT, the generated load is 50/8=6.25% of the network load, i.e., three times as much as a low-traffic UT. The load generated by each UT is split equally among the UT's three switched Poisson input traffic sources; each source's ÀH and ÀL values used to obtain the desired network loads, and the corresponding values of À given by Equation (5) (Section 3.5), are presented in
75
Table 2 below. Note that these values are per traffic source; since each UT has three sources, the given À values must be multiplied by three to obtain the mean traffic rate generated by each UT.
Total Load (%)
95 90 85 80 75 70 60 50
(eells/s) LowHighTraffle Trame UT UT 63.73 191.19 60.38 181.13 57.02 171.07 53.67 161.01 50.31 150.94 46.96 140.88 40.25 120.75 33.54 100.63
ÀL (eells/s)
À
LowTrame UT 21.24 20.13 19.01 17.89 16.77 15.65 13.42 11.18
HighTrame UT 63.73 60.38 57.02 53.67 50.31 46.96 40.25 33.54
(eells/s) LowHighTrame Trame UT UT 318.66 106.22 301.89 100.63 95.04 285.12 268.34 89.45 251.57 83.86 234.80 78.27 67.09 201.26 167.71 55.90 ÀH
Table 2: Tramc source parameters for various network loads
4.1.2.2. SRD vs. LRD traffle
As noted in Section 3.3, the LRD and self-similar properties in network traffic have significant implications for queuing performance: LRD input traffic in queuing systems generally results in longer queues (and thus, increased queuing delays and packet losses) than SRD traffic [30]. Recall that in this thesis, SRD and LRD traffic is modeled by MMPP and PMPP sources, respectively; the se two source types are differentiated by their state sojoum time distributions exponential for MMPP, and Pareto for PMPP. Simulations are run with both source types in order to compare the resulting DCA performance. To provide a fair basis for comparison, we use the same mean state sojoum time for both source types, 3.25 seconds as stated in Section 4.1.1. The PM PP traffic's self-similarity is measured by the Hurst parameter H; selfsimilar traffic with 0.5 < H < 1 is also long-range dependent, with H values c\oser to 1 resulting in burstier traffic [38]. The Hurst parameter is given by [38]: 3-c H=-2
1n})
As noted in Section 3.1, the queue size survival function Pr{Q>n} is a convenient measure of the QoS experienced by cells in the UT' s MAC queues.
In this
section, plots of the UT queue size survival functions for case C3 are presented. 82
These plots are used to determine whether the QoS criterion of Equation (l) (Section 3.1) is satisfied for each MAC queue, and to optimize the DCA parameters described in previous sections, i.e., the moving-average sliding window size Land request transmission threshold L1 TH .
High network loads
ranging between 80 and 95% are used for the plots because, as noted previously, performance differences and trends are most apparent when the network is heavily loaded since the DCA is more heavily stressed. Figure 14 shows the queue size survival functions at 95% network load with MMPP and PMPP input traffic. The moving-average sliding window size L is set to 19 frames and the request transmission threshold L1 TH is set to 0.0, as in ail previous Figures. We note that for ail three queues, the PMPP curves decay more slowly than the MMPP curves, indicating higher probabilities of obtaining larger queue sizes with PMPP input traffic; this finding parallels the results obtained in [38], as weil as the average queuing delay results obtained in Section 4.2.1 of the present thesis (PMPP traffic was found to result in higher queuing delays). This behavior is due to the long-range dependence and self-similarity of the PMPP traffic. Next, we note that each survival function curve in Figure 14 appears to be composed of two regions: for small queue sizes (below approximately 10 cells), the slope of the curve is steeper than for larger queue sizes. This dual-slope shape is most apparent for the EF queue, but is also visible for the two other queues. The shape is characteristic of queuing systems with switched (modulated) traffic arrivai processes, like those used in this thesis. The first region (with the steeper slope) is called the ceU region, and the other, the burst region [41]. To facilitate our discussion of these regions, recall from Section 3.1 that the queue size survival function can be interpreted as the cell loss probability of a queue with finite length n. For small n (i.e., in the cell region), the loss is due mainly to the cell variability of the Poisson traffic arrivai process within each state of the switched traffic source. In the cell region, increasing n allows this variability to be absorbed by the larger queue size, so the cell loss rapidly decreases as indicated by the steep slope of the survival function. As n is further increased, the
83
burst region is entered and the loss due to cell variability becomes negligible, resulting in a decreased slope of the survival function. In the burst region, the cell loss is caused mainly by the input traffic source's transitions into its "high" state, because the new mean cell anival rate ÀH momentarily exceeds the queue service rate, leading to a queue build-up. The DCA process causes the service rate to be increased ta compensate for the new, higher anival rate, but this only occurs after the DCA cycle time lag described in Section 2.1.4. We now use Figure 14 to determine whether the QoS criterion of Equation (1) (Section 3.1) is satisfied for each of the UT's MAC queues, with the nk queue size values specified in Section 4.1.1 (k = 1, 2, 3 denotes the EF, AF and DE queue, respectively): n1=75, n2=1l5 and n3=150 ceIls, and the out age probability POU"i-1O· 3 . For the EF queue, we note that at the specified queue size n1 =75 ceIls, Pr{ Q>n1} with both MMPP and PMPP traffic is weIl below the specified outage probability, hence the QoS criterion is satisfied for the EF queue despite the very high network load used in Figure 14 (95%). The QoS criterion is violated for the AF and DE queues, however, i.e., the outage probability requirement is not met at the specified queue sizes n2=1l5 and n3=150 ceIls, respectively.
o~~~::::==-~~~
................... ~ ...............~~............................................. .,
·0.5
·1
·1.5
·25
·3
·3.5
·4
o
40
20
60
80
100
140
120
Queue Size n (ceU.) 1_ _
EF MMPP -
AF MMPP ----- DE MMPP ••••• EF PMPP •• lit •• AF PMPP ••
+ .. DE PMPP
1
Figure 14: Queue size survival functions, 95% load, case C3, MMPP and PMPP trame
84
In order to determine the maximum network load at whieh the outage probability requirement is met for the AF and DE queues, Figure 15 shows Pr{ Q>nd (with and
113
112
as above) for these two queues vs. the network load. We note that for the
AF queue, the outage requirement is met at loads not exeeeding approximately 92% with MMPP traffie and 90% with PMPP traffie; similarly, for the DE queue the outage requirement is met at loads not exeeeding approximately 87% with MMPP traffie and 84.5% with PMPP traffie.
Thus, with PMPP input traffie,
lower network loads are required than with MMPP traffie in order to obtain the same QoS. o,-----------------~----------------~----------------__.
.. -1
1
..........• -3
-4
0.8
0.85
0.9
0.95
Nonnallzed Network Load ! - A F MMPP --+-DE MMPP" *"AF PMPP' ·.··DE PMPP!
Figure 15: Pr{Q>nd (n2=115, n3=150) vs. network load, case C3, MMPP and PMPP trame
4.2.2.1. Effects ofthe moving-average slidillg window size We now eonsider the effeets of the moving-average sliding window Slze L. Reeall from Section 3.4 that with a smaller L, the moving average used to estimate the mean traffie arrivaI rate in eaeh UT MAC queue eovers a shorter time span (fewer frames) and thus, follows the instantaneous traffie arrivaI rate more c1osely, responding more quiekly to traffie transients and to state changes of the
85
queue's switched Poisson input traffic source. This implies high variation in the estimated mean. As L is increased, the estimated mean becomes smoother, i.e., the estimate is of better quality, possibly leading to improved DCA performance; the downside is that the estimate responds more slowly to traffic variations such as the traffic source's state switching point, resulting in slower updates of the capacity assigned to the UT by the scheduler, with the opposite effect of reducing DCA performance. There is thus a tradeoff between the estimate's quality and its responsiveness to input traffic variations. O~~--~--~----~----~----~----~----~----~----~----.
····c,· ,,' ..•..• ~.. : :~: :::~~::_:... ....,........ ..••
-0.5
--.. -- ............. -
-1
...... _-
-15
'ê'
'."
A
"
';:'
a..
-2
.. -- .
"
J
"
-2.5
"
-3
"
.,
-35
-4
o
20
40
60
80
100
120
140
160
180
200
Queue Size n (ceUs)
-EFL=10 -.,.- EFL=19 -----EFL=80 -AFL=10 - .. - AFL=19 ------AFL=80 --DEL=10 - .. - DE L=19 --+, -DE L=80
Figure 16: Queue size survival functions, 95% load, ease C3, MMPP trallie, L=10,19,80 frames
Figure 16 and Figure 17 show the queue size survival functions for L and 1, 5, 10 frames, respectively.
= 10, 19, 80
The effects of changing Lare clearly
observable: for ail three queues, lower L values result in survival functions that decay more quickly, implying sm aller queue sizes and thus, better performance. In terms of the estimate quality-responsiveness tradeoff described above, we therefore conclude that the estimate's improved quality at higher L values is outweighed by its reduced responsiveness to input traffic variations.
Hence,
86
lower values of L are preferable, subject to diminishing returns: decreasing L from 19 to 10 frames results in improved performance for ail three queues, but a further decrease from 10 to 5 frames only results in further slight improvement for the AF and DE queues.
The final decrease from 5 frames to 1 results in slight
improvement for the DE queue, but not the EF and AF queues; in fact, we note that for these two queues, better performance is actually obtained with L = 5 than with L = lover certain queue size ranges (though the differences are very small). We therefore conclude that the good window size is in the range of 5 tolO frames. O~----~----~--~----~----~----~----~----~----~--~
-05
-1
-1.5
-25
.', .'.....
-3
\ \
,,
Il -3.5
,
0-
\ \
Il -4
o
20
40
60
80
100
120
140
160
160
200
Queue Size n (cells) I - - E F L=1 - , . - EF L=5·· - ··EF L=10 _ _ AFL=1 - . - AF L=5 ----. ·AFL=10 _ D E L=1 - .. - DE L=5·
.+. ·DE L=10 1
Figure 17: Queue size survival funetions, 95% load, ease C3, MMPP traffie, L=I,5,10 frames
4.2.2.2. Effects ofthe request transmission threshold Recall from Section 3.6.3 that the UT's request transmission threshold mechanism is used to determine whether a capacity request should be transmitted, based on the relative change in the request amount since the previous request. The request transmission threshold L1 TH is the minimum relative change required to transmit a request. As L1 TH is increased, the amount of signaling used for DCA decreases because fewer capacity requests are transmitted per unit time. The tradeoff is that
87
the scheduler must rely on older request information for the capacity assignment process; depending on the L1 TH setting, this older information may no longer reflect the CUITent input traffic conditions at the UT, resulting in sub-optimal capacity assignments, and thus, decreased queuing performance. In other words, the DCA becomes less responsive to input traffic variations as L1 TH is increased. A tradeoff (compromise) is thus required between DCA performance and signaling overhead. L1 TH is the parameter used to investigate this tradeoff. Figure 18 shows the queue size survival functions for L1 TH
=0.0, 0.2 and 0.5.
We
note that generally, lower values of L1 TH result in survival functions that decay more quickly, implying smaller queue sizes and thus, better performance. We emphasize, however, that the observed differences are smalt. Increasing L1 TH from 0.0 to 0.2 results in no performance penalty for the EF queue, and only minimal penalties for the AF and DE queues; a further increase to 0.5 results in a minimal performance penalty for the EF queue as the queue size n increases, and slightly more substantial penalties for the AF and DE queues. Overall, the EF queue is th us almost unaffected by L1 TH changes. O=---------~----------~--------~~--------~--------~
-1
-1.5 c:
•
"...
"i:"
-2
'l -2.5
-3
-3.5
50
100
200
250
Queue Size n (cell.) ___ EFTh=O.O - . - EFTh=O.2 ·--··EFTh=O.5 _AFTh=OO
-+- DE Th=O.O
- -te - DE Th=O.2 • - +
..
AFTh=O.2 ··---·AFTh=O.5
.. DE Th=O 5
Figure 18: Queue size survival funetions, 95% load, ease C3, MMPP trame, Lf TH =O.O,O.2,O.5
88
Now, let us consider the signaling overhead with the above L1 TH values.
The
signaling overhead is measured/quantified by the proportion of frames in which capacity requests are transmitted for each queue (service class): a lower proportion signifies less signaling; a proportion of 1.0 indicates that a request is transmitted in every frame. Table 3 shows these proportions for the above L1 TH values. First, we note that for each L1 TH value, the request proportions for the three queues are nearly identical, which is understandable since the input traffic sources used for the queues are homogeneous (i.e., all have the same parameters), so the resulting traffic in each queue has similar characteristics. Next, we note that even with L1 TH=O.O, the request proportion is less than 1.0, signifying that requests are not transmitted in every frame, because the request amount is sometimes identical from frame to frame (depending on the traffic arrivaI pattern). Since the request proportions for the three queues are nearly identical as noted above, we use the EF queue for illustrative purposes. We note that the request proportion decreases from 0.755 to 0.102, representing an 86.5% reduction in the amount of signaling, by increasing L1 TH from 0.0 to 0.2; by contrast, a signaling reduction of 96.4% is achieved by increasing L1 TH from 0.0 to 0.5, i.e., only an additional 10% reduction is achieved by the increase to 0.5.
ATH 0.0 0.2 0.5
Re( uests per frame EFQueue AFQueue DE Queue 0.755 0.102 0.027
0.755 0.102 0.028
0.754 0.106 0.027
Table 3: Capacity requests per frame with multiple ATH values, MMPP trame
In summary, increasing L1 TH from 0.0 to 0.2 results in no queuing performance penalty for the EF queue and only minimal penalties for the AF and DE queues, while reducing the signaling overhead by 86.5%; slightly more substantial performance penalties result from further increasing L1 TH to 0.5, while only reducing the signaling by an additional 10%. We therefore conclude that L1 TH=0.2 is a good choice in view of the performance-signaling tradeoff.
89
4.2.3. Network overload Recall from Section 3.5 that a network overload occurs when the aggregate traffic anival rate from ail the UTs in an uplink beam momentarily exceeds the beam's total transmission capacity (although the aggregate mean anival rate does not), because too many switched Poisson input traffic sources are simultaneously in their "high" states. During network overloads, the traffic anival rates to the UT queues thus exceed the queue service rates because there is insufficient transmission capacity available in the affected uplink beam; the queues therefore become unstable (build-up), resulting in increased queue sizes and delays. Consequently, the overloads' occurrence frequency (probability) should be low, and their duration should be short, in order to minimize the performance impact. Table 4 shows the network overload probability and me an network overload time (duration) at 95% load, obtained both analytically and by simulation.
The
overload probability derivation presented in Section 3.5.1 is independent of the state sojoum time distribution of the switched Poisson input traffic sources, and is thus valid for both MMPP and PMPP traffic.
We note that the simulation
overload probability values are in close agreement with the analytical value. In addition, the simulation values for MMPP and PMPP traffic are also in close agreement with each other, which is unsurprising since, as noted above, the overload probability should not depend on the state sojoum time distribution.
Simulation MMPP PMPP 0.238 0.249 0.243 Overload Probability Mean Overload Time 0.25435 sec 0.2880 sec 0.3031 sec Analytical
Table 4: Simulation and analytical network overload probabilities and mean network overload times at 95 % load
The mean overload time derivation presented in Section 3.5.2 uses Markov analysis, and is thus only valid for MMPP input traffic, with its exponentially distributed state sojoum times. From Table 4, we note that the analytical value is in close agreement with the simulation value for MMPP traffic. In addition, the simulation values for MMPP and PMPP traffic are also close, despite the different state sojoum time distributions of these traffic types. This is because the mean
90
state sojoum times are the same for both traffie types (as noted in Section 4.1.2.2), resulting in the same mean time elapsed before traffie sources in the "high" state switeh to the "Iow" state, th us ending the overload. o.-------~--------~--------~------~--------~------__.
·0.5
., ., 5 :;:A
t:.
li: ~
·2
-.\. ..
·2.5
-.: .......... ,.............•
·3
·35
·4 0
4
2
5
6
Overload Tlme t (0) I-MMPP .... "PMPP 1
Figure 19: Network overload time survival funetions, 95 % load, MMPP and PMPP trame
We now eonsider the survival funetion of the overload time. Figure 19 shows the survival funetions with MMPP and PMPP input traffie. We note that the MMPP eurve decays more quiekly than the PMPP eurve, indieating higher probabilities of obtaining longer overload times with PMPP traffie (although the mean overload time remains the same, as noted above). This behavior is due to the heavy-tailed Pareto state sojoum time distribution used for PMPP traffie: longer sojoum times are obtained with a higher probability than in the case of distributions that are not heavy-tailed (e.g., the exponential distribution used for MMPP traffie); eonsequently, longer network overload times are also obtained with a higher probability beeause more time elapses before traffie sources in the "high" state switeh to the "Iow" state, th us ending the overload. The effeets of these longer overload times on the UT's queuing performance were observed in the simulation results of Sections 4.2.1 and 4.2.2: inereased queuing delays and
91
queue sizes with PMPP traffic, as compared to MMPP traffic. In particular, it was found in Section 4.2.2 that with PMPP traffic, the network load must be reduced in order to maintain the same QoS performance as with MMPP traffic.
4.2.4. Effects of traffic state switching rate on DCA performance So far, it was assumed that the mean state sojourn times of the switched Poisson input traffic sources are greater than the DCA cycle time; this is referred to as slow-switching (SS) traffic. This assumption allowed us to treat the traffic within
a DCA cycle as simple (non-switched) Poisson traffic, since each traffic source was assumed to remain in the same state for the entire duration of a DCA cycle, as described in Section 3.3. This simplification guided the derivation in Section 3.6.1 of the service rate (capacity) required for each of the UT's MAC queues in order to satisfy the QoS criterion of Equation (1) (Section 3.1); the results of this derivation played a key role in the design and operation of our proposed DCA scheme. We now consider fast-switching (FS) input traffic; in this case, the mean state sojourn times of the traffic sources are smaller than the DCA cycle time, so it is no longer possible to make the simplifying assumption that each traffic source remains in the same state for the entire duration of a DCA cycle. Simulation is used to determine how FS traffic affects the DCA performance, and thus, to ascertain whether the DCA scheme must be adjusted for operation with FS traffic. Recall from Section 4.l.1 that the DCA cycle time is 0.54 seconds, and that for SS traffic, the mean state sojourn times of the traffic sources in the "high" and "low" states, lIrH and lIrL, respectively, are both set to 3.25 seconds.
Now, for FS
traffic, we set the mean sojourn times to 0.5, 0.05 or 0.005 seconds (for comparison). Figure 20 and Figure 21 show the queue size survival functions at 95% network load with SS and FS (with mean sojourn time of 0.5 seconds) MM PP and PMPP input traffic, respectively. We note that for ail three queues, the FS curves decay more quickly than the SS curves, indicating sm aller queue sizes (better performance) with FS traffic. To further illustrate this trend, Figure 22 shows the survival functions with SS and FS (mean sojourn times = 0.5, 0.05 and 0.005 seconds) MMPP traffic; for comparison, simple (non-switched) Poisson 92
traffic is also included. To avoid c1uttering the figure, only the curves for the EF queue are shown, but the performance trend is the same for the other two queues. o~--------~----------,---------~----------,---------~-----------
·0.5
-1
-2
le.
-25
-3
o
50
100
150
200
300
250
Queue Size n (cells)
l---EF SS _ A F SS ___ DE SS·· .··EF FS·· lI!--AF FS·· *. ·DE FS
1
Figure 20: Queue size survival functions, 95 % load, case C3, SS and FS (mean sojourn time =0.5 sec) MMPP tramc O.----------r----------r----------,----------r---------~--------__.
-05
-1
"2
rcS
-1.5
J -2
-2.5
~x ___ .L.. .. _ _ _ .__
-3 -
o
50
100
----_. . - - - - - - - - - - - -. . _ - - - - 150
200
250
--~ 300
Queue Size n (cells)
Figure 21: Queue size survival functions, 95% load, case C3, SS and FS (mean sojourn time =0.5 sec) PMPP tramc
93
o.-----~----~----~----~----~----~------~----~--__.
-0.5
-1
ê
S ';:' Cl.
-1.5
î -2
-2.5
-3
o
10
15
20
25
30
35
40
45
Queue Size n (œlll)
1- - . - -Poisson - F 5 (0.005 sec) ---+-F5 (0.05 sec) _ F 5 (0.5 sec) - 5 5 (3.25 sec) 1
Figure 22: EF queue size survival funetions, 95% load, case C3, SS and FS MMPP and Poisson trame
In Figure 22, the best perfonnance (fastest decay of the survival function) is obtained with the Poisson traffic input. As the me an state sojoum time of the MMPP traffic is decreased, the overload time and hence the queuing delay due to the burst region (see Section 4.2.2) are also reduced, and the MMPP survival function curve approaches the Poisson one. For the mean sojoum time of 0.005 seconds, the MMPP and Poisson survival function curves are almost identical. It is also noticed that the survival function curve for slow-switching MMPP (with the mean sojoum time of 3.25 seconds) c1early exhibits two slopes corresponding to the cell and burst regions (as discussed in Section 4.2.2), while the curves for fast-switching MMPP (especially with the mean sojoum time of 0.005 seconds) seem to have only one slope corresponding to the cell region, as in the case of Poisson traffic. Figure 23 shows the probability density function (PDF) curves for Poisson and MMPP traffic models.
The PDF of slow-switching MMPP (with the mean
sojoum time of 3.25 seconds) exhibits two peaks corresponding to the me an cell rates of the "low" and "high" states,
À- L=21.24
and
À- H=106.22
cells/s (as shown in 94
Table 2, Section 4.l.2.1). As the me an state sojoum time is decreased, we note that the shape of the PDF gradually changes to that of the Poisson PDF with me an rate of 63.73 cells/s (as given by Equation (5), Section 3.5). 0.05
004
_ 0.03
S ~
~
IL
o
Il.
002
0.01
. .~+---~~~~
o~~~--~~~~~------~------~~~~ 40 100 o 20 60 80
140
120
Cell Rate (celllll)
1· .•.. Poisson
-
FS (0.005 sec) - + - FS (0.05 sec) - - - FS (05 sec) -
SS (3.25 sec)
1
Figure 23: Cell arrivai rate PDF, 95% load, SS and FS MMPP and Poisson traffie
Recall from Section 3.6 that the design of our DCA scheme was influenced by the assumption that with SS input traffic, the traffic within a DCA cycle time can be treated as simple (non-switched) Poisson traffic.
As shown by our above
simulation results, this assumption still holds with FS traffic, because the PDF of the switched Poisson traffic arrivaI process approaches the Poisson PDF as the mean state sojoum time decreases, implying that the switched traffic becomes equivalent to Poisson traffic. We therefore conclude that it is not necessary to adjust/modify our DCA scheme for operation with FS traffic.
95
Chapter 5 : SUMMARY AND CONCLUSIONS The main theme/objective of this thesis has been to propose a novel dynamic capacity allocation (DCA) scheme for IP-based broadband satellite access (BSA) networks.
The proposed scheme should be efficient with regard to satellite
bandwidth utility and satisfy user QoS requirements, while maintaining reduced signaling overhead and computational complexity.
The work and main
conclusions of the thesis are summarized below. In Chapter 2, we provided the background/context and reference BSA system architecture necessary for presenting our DCA-related research in subsequent thesis chapters.
We began with a survey/summary of previous work in BSA
network architectures and CUITent architectural trends, including the DCA concept. Next, we described the CUITent state of the two IP QoS architectures in teITestrial networks, IntServ and DiffServ, noting that DiffServ is currently the preferred architecture due to complexity and scalability concems regarding IntServ. Finally, we described our proposed architectures for a DiffServ-capable scheduler and user terminal (UT). In Chapter 3, we presented our proposed DCA scheme, which aims to provide high satellite bandwidth utilization and satisfy user QoS requirements, while maintaining reduced signaling overhead and algorithmic complexity. We began by defining an appropriate QoS performance measure, i.e., one that can be used to derive the basic QoS parameters of packet delay and loss. We then provided a survey/summary of previous work on DCA schemes for satellite networks. Next, we presented the input traffic model used in the BSA network, justifying its validity using results from the literature and assumptions regarding the typical operational environment of the UTs. We continued by describing the movingaverage estimator of the mean traffic arrivai rate, a key DCA input. Next, we described the network overload situation and its expected negative performance impact, setting the stage for our subsequent derivation of the network overload probability and mean overload time. Finally, we presented our DCA scheme. A key component of the scheme is an analytical expression for the capacity required
96
by each UT to achieve a target QoS for the user traffic; this expressIOn was derived using an analytical queuing model based on the previously selected input traffic model. Our DCA scheme was presented in the form of three study cases, each in itself a self-contained, operational DCA scheme.
These three cases
represent a logical evolution of the capacity request and assignment algorithms, allowing us to evaluate and compare multiple DCA design options that were in the end consolidated under the third (final) case. Thus, the first two cases were intended only as intermediate steps towards the final case.
Our subsequent
simulation results in Chapter 4 showed that this final case represents the best compromise (tradeoff) between QoS performance, signaling overhead and algorithmic complexity. In Chapter 4, we used mainly simulation (but also sorne analytical) results to evaluate the performance of the proposed DCA scheme. Simulation was used for the optimization of various DCA elements/parameters; this optimization included the selection of the capacity request and assignment algorithms (in view of the performance-complexity tradeoff), the traffic averaging window size (in view of the tradeoff between the estimate's quality and its responsiveness to input traffic variations), and the request transmission threshold (in view of the performancesignaling tradeoff). We began by describing the simulation model's configuration and selecting appropriate simulation scenarios to evaluate the desired aspects of the DCA performance and facilitate the aforementioned optimization. Next, we presented and analyzed the simulation results (comparing them to analytical results where appropriate), drawing conclusions regarding the DCA optimization. Finally, we considered the case of fast-switching input traffic, as opposed to the slow-switching traffic considered hitherto: simulation was used to determine how fast-switching traffic affects the DCA performance, and thus, whether the proposed DCA scheme must be adjusted for operation with fast-switching traffic. The conclusions established in Chapter 4 are summarized below: •
DCA algorithm selection: Among the three proposed DCA cases, C3 provides the best balance in terms of the tradeoff between queuing performance and algorithmic complexity: incurring only a minimal performance penalty
97
relative to the other two DCA cases, C3 employs a significantly simplified scheduling algorithm.
In addition, a request transmission threshold
mechanism allows C3' s signaling overhead to be reduced; C3' s capacity request messages contain less information than those in the other two DCA cases, further reducing the signaling overhead. For aIl these reasons, C3 is the preferred DCA case. •
Choice of moving-average sliding window size L: The good range for the moving-average sliding window size is 5-10 frames. Values above this range lead to decreased queuing performance because the estimated mean traffic arrivai rate is less responsive to input traffic variations (in particular, the traffic source's state switching point) for higher values of L. On the other hand, values below this range cause no further improvement to the queuing performance, and can actually impair it due to excessive variation in the estimated mean, thus reducing the estimate's quality.
•
Choice of request transmission threshold Ll TH : In view of the tradeoff between the DCA performance and the signaling overhead required by the DCA scheme, the good value for the request transmission threshold Ll TH is 0.2. This setting causes a very small queuing performance degradation (as compared to the case of LlTH=O.O), while reducing the signaling overhead by 86.5%. Increasing Ll TH beyond 0.2 results in decreased queuing performance with no further significant reduction of the signaling overhead.
•
Effects of correlated traffic: LRD input traffic in the BSA network results in longer network overload times than with SRD traffic. The effect of these longer overload times is reduced queuing performance (increased delays and queue sizes), due to inadequate queue service rates during the overload periods. To maintain the same queuing performance with LRD traffic as with SRD traffic, it is therefore necessary to reduce the network traffic load.
•
Effects of traffic state switching rate: Fast-switching input traffic results in better queuing performance than slow-switching traffic, because it becomes equivalent to simple (non-switched) Poisson traffic. The design of our DCA sc he me was influenced by the assumption that in the slow-switching case, the
98
traffic within a DCA cycle can be treated as Poisson. Since this assumption also holds in the fast-switching case, we conclude that it is not necessary to make any adjustments/modifications to our proposed DCA scheme for operation with fast-switching traffic.
In this thesis, the request transmission threshold L1 TH was selected by statically setting it to various values and using simulation to compare the resulting queuing performance and signaling overhead. In a practical BSA network, UT queuing performance feedback could be used to dynamically adjust L1 TH in response to changing queuing conditions. As the number of packets in each queue increases (i.e., as the queue builds up), L1 TH could be decreased in order to increase the request frequency, and thus, the DCA scheme's responsiveness to input traffic variations, leading to improved queuing performance (decreased queue length) because the assigned capacity would more closely follow the input traffic. For instance, the queue cou Id conceptually be divided into "green", "yellow" and "red" regions of operation cOITesponding to increasing queue lengths; the L1 TH setting would then depend on the queue's CUITent region,
with "red"
cOITesponding to the lowest setting (highest request frequency) and "green", the highest setting (Iowest request frequency). Altematively, the queue's Pr{ Q>ll} could be continually monitored, and if the out age probability threshold
POUT
is
crossed (violated) too often, L1 TH could be decreased. The UT queuing performance may be further improved by implementing a distributed congestion control scheme with the participation of both the scheduler and the UTs, using feedback from the scheduler regarding the global network congestion level: in any given MF-TDMA frame, if the sum of ail requested capacity in the network (from ail the UTs) exceeds the frame's capacity (i.e., if there is no free capacity available), the scheduler assumes that the network is congested and signaIs this to the UTs by setting a f1ag in the broadcasted slot assignment map.
Upon receiving this congestion indicator, each UT then
decreases its throughput by performing more aggressive connection admission control (e.g., refusing ail new connections) and in extreme cases, possibly even
99
dropping existing ones. While this congestion control policy would decrease the traffic volume carried by the UT, it may allow the QoS performance of existing connections to be maintained at acceptable levels even during periods of network congestion. The above issues, involving the use of queue length feedback to dynamically adjust the request frequency, and of global congestion level feedback for congestion control, could potentially lead to improved DCA performance. These issues are left for future researchers to explore.
100
REFERENCES [1]
Postel J. RFC 791: Internet Protocol, 1981.
[2]
Braden R, Clark D, Shenker S.
RFC 1633: Integrated Services
In
the
Internet Architecture: an Overview, 1994. [3]
Blake S et. al. RFC 2475: An Architecture for Differentiated Service, 1998.
[4]
Grossman D. RFC 3260: New Terminology and Clarifications for Diffserv, 2002.
[5]
Le-Ngoc T, Elshabrawy T.
Broadband satellite access for interactive
multimedia services. Space Communications 2001; 17:35-48. [6]
ETSI EN 301 790: Digital Video Broadcasting (DVB), Interaction channel for satellite distribution systems.
[7]
Le-Ngoc T. Dynamic resource allocation schemes for multimedia satellite communications. The 4 th International Symposium on Personal, Indoor and
Mobile Radio Communications (RIMRC) 1993; 552-556. [8]
Evans B.
Satellite Communication Systems; Institution of Electrical
Engineers (IEE), 1999. [9]
Verma D.
Supporting Service Level Agreements on IP Networks; Que,
1999. [10] Wang Z.
Internet QoS: Architectures and Meclzanisms for Quality of
Service; Morgan Kaufmann Publishers: San Francisco, 2001. [Il] Kota S, Marchese M. QuaIity of service for satellite IP networks: a survey. International Journal of Satellite Communications and Networking 2003; 21(4-5):303-349. [12] Braden R et. al.
RFC 2205: Resource Reservation Protocol (RSVP) -
Version 1 Functional Specification, 1997. [13] Wroclawski J. RFC 2210: The Use of RSVP with IETF Integrated Services, 1997. [14] Herzog S. RFC 2750: RSVP Extensions for Policy Control, 2000. [15] Shenker S, Partridge C, Guerin R. RFC 2212: Specification of Guaranteed QuaIity of Service, 1997.
101
[16] Wroc1awski J. RFC 2211: Specification of the Controlled-Load Network Element Service, 1997. [17] Handley M et. al. RFC 2543: SIP: Session Initiation Protocol, 1999. [18] Davie B et. al.
RFC 3246: An Expedited Forwarding PHB (Per-Hop
Behavior), 2002. [19] Heinanen J et. al. RFC 2597: Assured Forwarding PHB Group, 1999. [20] Le-Ngoc T, Mohammed J.1. Combined free/demand assignment multiple access (CF-DAMA) protocols for packet satellite communications. IEEE
Intemational Conference on Universal Personal Communications (ICUPC) 1993; 2:824-828. [21] Ha T.T.
Digital Satellite Communications; McGraw-HiII Publishing
Company, 1990. [22] Mohammed J.I,
T.
Le-Ngoc
Performance
analysis
of combined
free/demand assignment multiple access (CFDAMA) protocol for packet satellite
IEEE
communications.
Intemational
Conference
on
Communications (ICC) 1994; 2:869-873. [23] Le-Ngoc T, Krishnamurthy S.V.
Performance of combined free/demand
assignment multi-access (CFDAMA) protocol with pre-assigned request slots in integrated voice/data satellite communications. IEEE Intemational
Conference on Communications (ICC) 1995; 3: 1572-1576. [24] Le-Ngoc T, Krishnamurthy S.V. assignment
multiple-access
Performance of combined free/demand
schemes
in
satellite
communications.
Intemational Joumal of Satellite Communications 1996; 14(1): 11-21. [25] Le-Ngoc T, Jahangir LM. Performance analysis of CFDAMA-PB protocol for
packet
satellite
IEEE
communications.
Transactions
on
Communications 1998; 46(9):1206-1214. [26] Mitchell P.D, Grace D, Tozer T.c.
Performance of the combined
free/demand assignment multiple access protocol with combined request strategies via satellite.
IEEE Personal, Indoor and Mobile Radio
Communications Conference (PIMRC) 2001. [27] Mitchell P.D, Grace D, Tozer T.C.
Comparative performance of the
102
CFDAMA protocol via satellite with various terminal request strategies.
IEEE Global
Telecommunications
Conference (GLOBECOM)
2001;
4:2720-2724. [28] Jiang Z, Leung V.C.M. A Predictive Demand Assignment Multiple Access Protocol
for
Internet
Access
over
Broadband
Satellite
Networks.
International Journal of Satellite Communications and Networking 2003; 21(4-5):451-467. [29] Farmer J.J, Sidrowich J.J. Predicting chaotic time series. Physical Review
Letters 1987; 59:845-848. [30] Erramilli A, Narayan 0, Willinger W. Experimental Queuing Analysis with Long-Range Dependent Packet Traffic.
IEEE/ACM Transactions on
Networking 1996; 4(2):209-223. [31] Leland W.E., Wilson D.V. High time-resolution measurement and analysis of LAN traffic: implications for LAN interconnection. IEEE Infocom 1991; 1360-1366. [32] Fowler H.J., Leland W.E. Local area network traffic characteristics, with implications for broadband network congestion management. IEEE Journal
on Selected Areas in Communications 1991; 9(7): 1139-1149. [33] Leland W.E., Taqqu S.M., Willinger W, Wilson D.V. On the self-similar nature of Ethernet traffic (extended version). IEEE/ACM Transactions on
Networking 1994; 2(1):1-15. [34] Heffes H., Lucantoni D.M.
A Markov modulated characterization of
packetized voice and data traffic and related statistical multiplexer performance. IEEE Journal on Selected Areas in Communications 1986; 4(6):856-868. [35] Shah-Heydari S., Le-Ngoc T. MMPP modeling of aggregated ATM traffic.
Proc. Canadian Conference on Electrical and Computer Engineering (CCECE) 1998; 129-132. [36] Subramanian S.N., Le-Ngoc T. environment.
Traffic modeling in a multi-media
Proc. Canadian Conference on Electrical and Computer
Engineering (CCECE) 1995; 838-841.
103
[37] Fischer W., Meier-Hellstem K.
The Markov-modulated Poisson process
(MMPP) cookbook. Performance Evaluation 1992; 18: 149-171. [38] Le-Ngoc T, Subramanian S.N. (PMPP)
model
for
A pareto-modulated Poisson process
long-range
dependent
traffic.
Computer
Communications 2000; 23(2): 123-l32. [39] Huang A, McDonald D. Connection admission control for constant bit rate traffic at a multi-buffer multiplexer using the oldest-cell-first discipline.
Queuing Systems 1998; 29(1):1-16. [40] Leon-Garcia A, Widjaja 1.
Communication Networks: Fundamental
Concepts and Key Architectures; McGraw-Hill, 2000. [41] Shroff N.B., Schwartz M.
Improved Loss Calculations at an ATM
Multiplexer. IEEE/ACM Transactions on Networking 1998; 6(4):411-421.
104