Dynamic Event-based Monitoring in a SOA Environment Fabio Souza1 , Danilo Lopes1 , Kiev Gama2 , Nelson Rosa1 , and Ricardo Lima1 1
Federal University of Pernambuco, Center of Informatics, {fns, dvl, nsr, rmfl}@cin.ufpe.br 2 University of Grenoble, LIG laboratory, ADELE team,
[email protected]
Abstract. There is an increasing need to monitor quality attributes (e.g., performance and availability) in SOA environments. Existing approaches to monitor these attributes (commonly referred to as QoS attributes) do not allow reconfiguration while services are in execution. This paper presents a generic QoS-aware SOA mechanism able to monitor runtime quality attributes of services. The solution is dynamic, event-based, extensible, transparent and lightweight in such way that the performance impact on the application is minimal and the overall mechanism is easily reconfigurable. To validate our solution, we propose a typical SOA scenario and evaluate its impact on the performance of the service execution. Keywords: SOA, QoS, monitoring, events
1
Introduction
Service-Oriented Computing (SOC) [5] proposes the utilization of loosely coupled entities (services) as first-class elements. Services are published in a registry where they can be dynamically discovered, selected and bound by service consumers. Providers, consumers and registry compose the traditional “triangle” which is central to the architectural style referred to as Service-Oriented Architecture (SOA). In SOA, applications are developed as service compositions in which services are selected based on contracts defining their functional interface and non-functional attributes. Different QoS attributes can be considered in SOA environments. According to their nature, these attributes can be classified as deterministic (e.g., price) or nondeterministic ( e.g., response time, throughput, availability). The dynamic and distributed nature of SOA environments and the intrinsic characteristics of non-deterministic QoS attributes suggest the need for a continuous monitoring system, which checks whether a service is providing the expected level of quality. Despite the increasing demand for continuous monitoring systems, their development is complex. Key concerns are the number of quality attributes and the costs related to monitoring them. In fact, a monitoring system can hamper the overall performance of a system and negatively impact the availability of monitored services. Another aspect is how to introduce new and not foreseen quality attributes to be monitored, without interrupting service execution.
2
This paper proposes a dynamic, event-based, extensible, non-obtrusive and lightweight QoS monitoring system that supports continuous monitoring of non-deterministic attributes in SOA environments. The solution is dynamic because it can be enabled, disabled or reconfigured (e.g. changing the set of QoS attributes) at runtime without impacting the availability of services. It is event-based because its components interact by sending and receiving event notifications. It is extensible because the support for monitoring unforeseen attributes is provided using documented extension points. It is non-obtrusive because services are not aware of monitoring tasks. Finally, it is lightweight because the impact on performance is minimized by splitting data gathering and processing in asynchronous phases. The rest of this paper is organized as follows: Section 2 presents the proposed mechanism in details, whilst Section 3 presents its experimental evaluation. Related work is presented in Section 4, followed by the conclusions and future work in Section 5.
2
Monitoring System
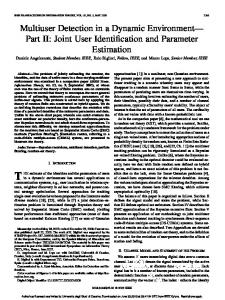
A monitoring system dynamically gathers, interprets and acts on data concerning an application while it executes. Monitoring systems can be used in different contexts such as security monitoring, correctness checking and debugging. Monitoring systems are configured through some kind of requirement specification that defines the target entities and the properties (or attributes) they are expected to observe. To collect data, a monitoring system attaches some sensors, which are triggered by the occurrence of events (e.g. the arrival of a message). The collected data are sent to an analyzer, which will evaluate them and eventually notify some handlers. Event handlers are responsible for the monitor’s reaction and can perform simple activities such as logging or take sophisticated decisions such as starting a reconfiguration process. Figure 1 presents a high-level view of the proposed monitoring system’s architecture, which is composed by three modules: management agent,data gathering center and data processing center. To promote loose-coupling, the communication between these modules is based on internal services and events. The proposed monitoring system has been implemented atop of an OSGi environment. This technology was selected because it has some very distinctive characteristics: it provides an inherently dynamic and modular platform, allowing loose coupling between modules thanks to a Service-Oriented Architecture. The OSGi specification defines a framework that leverages Java’s dynamic class loading feature for enhancing modularization and also introduces a runtime where modules can be installed, started, stopped, updated or uninstalled without stopping the application. 2.1 Management Agent The management agent is responsible for providing management interfaces that can be accessed through a local or remote management console. These interfaces support suspension and resumption of the monitoring system as well as the definition of the monitoring configurations, which define the target services and the quality attributes that are expected to be monitored.
3 Monitor Data Gathering Center Monitoring Services XML
Service Provider
Single event
Simple Event Handler
Monitoring Configuration Agent
TOPIC
XML
Monitoring Configuration
XML
Metric Computing Agents Composite event
Composite Event Handler TOPIC
Management Agent
Data Processing Center
Management Flow Request/Response Flow
Fig. 1. High level representathion of the QoS monitoring system.
When a monitoring configuration is defined, the management agent verifies whether there are monitoring services (see section 2.2 ) responsible for dealing with the corresponding quality attributes. If this condition is satisfied, the monitoring activity starts with the agent notifying the data gathering and the Data Processing centers. Otherwise, the monitoring configuration is marked as pending, being reanalyzed when the agent is notified about the registration of new monitoring services. 2.2
Data Gathering Center
The data gathering center uses the Invocation Interceptor pattern to intercept requests and replies exchanged between consumers and providers. It collects QoS-related data and wraps them in simple events that are asynchronously sent to the data processing center, reducing the impact of the monitoring activities since the aggregated metrics (e.g. average response time) are computed in parallel. This computed data can then be stored in a service registry enabling QoS-based service selection. The data gathering center is composed of two kinds of components: monitoring services and simple event handlers. Essentially, a monitoring service is responsible for collecting data required to compute metrics related to a particular QoS attribute, e.g., response time. To perform this task, it uses sensors, which are implemented as QoS interceptors dynamically (at runtime) interposed between consumers and providers. To connect the QoS interceptors to a service, we developed a chainer interceptor, which is added to the beginning of each service’s chain when it is published (this is done through middleware configuration and is transparent to the developer). This interceptor modifies the chain by adding the QoS interceptors provided by the monitoring services. To select the QoS interceptors to be included, the chainer must know what
4
QoS attributes are configured for the service. This information is in the monitoring configurations related to the service, so the chainer is notified each time one of these configurations is defined. In summary, based on the QoS attributes defined in the configurations, the chainer discovers the monitoring services that it has to interact with in order to obtain the QoS interceptors (sensors) that ought to be plugged in the chain. In order to support an extensible collection of QoS attributes, our monitoring system should be able to dynamically support new QoS interceptors. As these interceptors are provided by the monitoring services, our monitoring system must dynamically discover when a new monitoring service is available. To cope with this requirement, we use a service registry that triggers an event each time a new monitoring service is published. When our management agent is notified about the occurrence of this event, it realizes that it must allow the definition of monitoring configurations that enable the monitoring the corresponding QoS attribute. Another key component in our solution is the publisher, which should be added as one of the last interceptors in the chains. Its purpose is to forward the collected data to the components responsible for processing them (simple event handlers). The communication between publisher and handlers is asynchronous. In fact, we adopt an event-based solution built atop of a publish/subscribe communication model. Simple event handlers can be used, for example, to keep historical data. In our solution, the event handlers are services that are dynamically discovered. This design decision enables defining alternative ways to handle QoS data at runtime. In fact, our monitoring mechanism includes a default handler implementation that forwards monitoring events to the Data Processing Center where the aggregated QoS metrics are computed. In summary, the architecture of the Data Gathering Center is quite flexible once it does not prescribe what QoS attributes can be monitored, or how the collected data should be processed. In fact, it allows the definition, design and deployment of new monitoring services which can be dynamically plugged into the proposed monitoring system, providing support for the monitoring of unforeseen QoS attributes without impacting running services. New simple event handlers can also be independently deployed, defining alternative ways to deal with the monitored data. In fact, this architecture supports the subscription of various simple event handlers simultaneously, each one of them manipulating the same data in a different manner. 2.3 Data Processing Center To compute aggregated QoS metrics, different design alternatives can be considered. A usual solution is to store simple events containing QoS related data in a database and process them a posteriori. This approach is directly supported by our monitoring mechanism through the development of a simple event handler that stores simple events in a database. This database is processed by a background task that computes the metrics. That approach has some important drawbacks. As mentioned before, supporting dynamic service composition requires runtime monitoring. At runtime a monitoring system can produce a huge volume of primitive events. Storing these events in a database forces frequent I/O operations and imposes unlimited storage demands. Besides, extracting valuable information from such volume of data is expensive and time-consuming.
5
So, the capacity of taking real-time decisions based on events is clearly affected. To perform online monitoring, we usually need to process a continuous flow of events that is constantly changing, i.e., an event stream. In such situations, the use of an Event Stream Processing (ESP) engine is recommended. In our context, the monitoring events generated by the data gathering center compose event streams that are forwarded to the data processing center. The core component of this center is the Esper engine, which computes aggregated metrics defined through queries provided by a set of metric computing agents. These agents are build dynamically (at runtime) when the data processing center is notified that there is a new monitoring configuration available. In fact, it is important to mention that, besides the data concerning the target service and the QoS attribute, a monitoring configuration defines which statistical operator should be used to calculate the aggregated QoS metric. It also contains information concerning the interval (in terms of time or number of events) that the agents will use to define their queries. Aggregated metrics are wrapped in composite events which are forwarded to a collection of composite event handlers that have subscribed to receive metrics computation results. These handlers analyze the metrics using embedded rules and take the necessary actions. In order to dynamically support new ways of dealing with aggregated metrics, our composite event handlers are designed as services and are dynamically discovered from the service registry. Different composite event handlers can be realized in a SOA environment. An example is a composite event handler that verifies SLA contracts and notifies parties when violations are detected [4]. Although our monitoring mechanism does not deal with SLA verification, it includes a handler that updates our QoS-aware service registry based on the aggregated metrics enabling the proposition of a QoS-aware composition layer.
3
Experimental Evaluation
To validate the monitoring system, some experiments were performed on a controlled environment. The validation scenario consists of service consumers periodically invoking a service provider to get the price of stocks. To evaluate the impact of the monitoring system, two performance metrics were considered, namely “throughput” and “response time”. Both metrics were measured from the consumer’s point of view. We use these metrics to evaluate the behavior of the system with and without monitoring. The experiments were performed on an isolated network composed by 3 hosts: 1 Pentium dual-core with 3GB running a CXF DOSGi environment that supports the service provider; 1 Pentium dual-core with 2GB emulating the service consumers modeled as threads in a test plan; and 1 Pentium dual-core with 1 GB running an Apache Derby database (storage of the stock prices) and a Zookeeper-based service registry. Different workloads were designed by varying the number of simultaneous consumers. Experiments containing 1, 25, 50, 75, 100, 125 and 150 consumers (submitting 1 request/second) were performed on two different configurations: 1) monitoring mechanism enabled; 2) monitoring mechanism disabled. Each user submits 1.000 requests. For the purpose of the experiments, the data gathering center includes a single monitoring service measuring the time required to process each request at the service
6
provider side. The monitoring mechanism wraps the measured time in a primitive monitoring event that is sent to a monitoring topic to which a single primitive event handler is subscribed. This handler forwards each received event to the data processing center. To compute the aggregated metrics, the data processing center uses a collection of queries provided by agents defined through the monitoring configurations. In our experiments, they define queries that compute maximum, minimum, and average processing time over windows composed of collections of 500 events. These metrics are wrapped in derived events that are forwarded to derived event handlers. In our environment, just one handler is subscribed to receive the events. It reads the metrics and updates our QoS-aware service registry. Figure 2 shows the throughput with and without enabling the monitoring mechanism. Despite the increasing number of consumers, these measures are very close. The greatest difference is around 1.3% (at 100 users). This is an indication that the monitoring infrastructure has a low impact on the performance.
Fig. 2. Throughput on the consumers’ side.
The response time measures are presented in Figure 3. It shows that the measures with and without monitoring are close. In fact, the greatest difference is around 6% (at 50 simultaneous users). According to Figures 2 and 3, we can infer some information concerning the system’s operation status that is not related to monitoring itself. Figure 2 shows that the throughput varies linearly with the workload. Furthermore, regardless of the submitted load, the system’s throughput is reasonably close to its nominal value, meaning that the system can process requests at a rate close to that demanded by the users. As an example, a demand equivalent to 150 simultaneous users, each one operating at 1 request/s, is 150 requests/s. The measured throughput (with and without monitoring) is around 133 requests/s, i.e., around 89% of the users’ demand. Figure 3 shows that the response time also varies linearly with the workload.
7
Fig. 3. Response time on the consumers’ side.
4
Related Work
Several researches in academia and industry discuss the importance of monitoring QoS attributes in SOA environments [5], although there is neither a standard QoS model for services nor a standard way to use QoS data. For instance, Baresi and Guinea [2] propose an extension to a BPEL engine using aspects, allowing the definition of selfsupervising BPEL processes enhanced by supervision rules (e.g., declarative monitoring directives, recovery strategies). However, the rules are static and after compiled they cannot be changed dynamically. A monitoring specification language called SECMOL [3] is used for specifying functional requirements and QoS constraints in BPEL processes. It allows splitting activities of data collection, aggregation and computation, but lacks the capacity of dealing with unforeseen QoS attributes at runtime. A probing tool for client-side monitoring called QUATSCH [6] generates stubs, based on WSDL files, in which performance code is woven. These stubs are used to submit requests to the web services and collect QoS data, which are combined with information obtained through low level sniffing in order to infer server side performance data. This is a non-invasive approach that captures QoS as seen by the client. However, it is not ”live data” and may not represent the current state of the service provider. A QoS monitoring mechanism proposed in [4] collects data from both client and server sides. The client-side monitoring is based on QUATSCH [6], and server-side monitoring is based on Windows Performance Counters (WPC) and processes real service invocations. Besides monitoring, this paper proposes a SLA validation mechanism which is supported by an event stream processor. This solution, however, is not able to dynamically support unforeseen QoS requirements. A discussion [7] of possible approaches to enable monitoring QoS on the client and server sides includes: performing low-level package sniffing, interposing a proxy between consumers and providers, and modifying a SOAP engine. They chose this last
8
option in order to enable intercepting consumer and provider exchanges. They implemented a prototype using Apache Axis arguing that the impacts in terms of memory and time were not significant. However their solution is not easily extensible, and cannot cope with new QoS requirements without modifying its code. Finally, a complete approach for enabling end-to-end support of non-functional properties in web services scenarios is presented in [1]. They define a representation of those properties, an architecture for measuring and updating QoS data, and an implementation based on Axis. Like our solution, they also use interceptors for supporting data collection. However, their interceptors cannot be changed dynamically and new metrics can only be supported through a redeploy.
5
Conclusion and Future Directions
QoS monitoring in Service-Oriented Architectures allows verifying quality attributes (e.g., availability, performance) of services at runtime. Monitoring these attributes is fundamental for implementing QoS-aware service compositions, as well as for validating Service-Level Agreements. Although there is no consensus on which and how QoS attributes should be monitored, there are different researches and industrial efforts that already collect and analyze QoS data in non-standardized ways. Existing mechanisms lack flexibility concerning on-the-fly reconfiguration of QoS monitoring and data analysis. In this paper, we proposed an extensible, dynamic, event-based, flexible, lightweight and transparent monitoring mechanism for continuous monitoring QoS observable attributes in a non-obtrusive way. This mechanism was implemented atop of CXF/DOSGi and validated using a typical SOA scenario. For future work we plan to enhance our monitoring events with semantic information in order to enable the development of an autonomic management infrastructure and to use it for validating SLAs and for detecting SLA violations.
References 1. Agarwal, V., Jalote, P.: Enabling end-to-end support for non-functional properties in web services. In: Service-Oriented Computing and Applications (SOCA). pp. 1 –8 (2009) 2. Baresi, L., Guinea, S.: Self-supervising BPEL processes. Software Engineering, IEEE Transactions on 37(2), 247 –263 (2011) 3. Guinea, S., Baresi, L., Spanoudakis, G., Nano, O.: Comprehensive monitoring of BPEL processes. Internet Computing, IEEE PP(99), 1 (2009) 4. Michlmayr, A., Rosenberg, F., Leitner, P., Dustdar, S.: Comprehensive qos monitoring of web services and event-based sla violation detection. In: Proc. of the 4th International Workshop on Middleware for Service Oriented Computing. pp. 1–6. ACM, New York, NY, USA (2009) 5. Papazoglou, M., Traverso, P., Dustdar, S., Leymann, F.: Service-oriented computing: State of the art and research challenges. Computer 40(11), 38 –45 (2007) 6. Rosenberg, F., Platzer, C., Dustdar, S.: Bootstrapping performance and dependability attributes ofweb services. In: Proc. of the IEEE International Conference on Web Services. pp. 205–212. IEEE Computer Society, Washington, DC, USA (2006) 7. Thio, N., Karunasekera, S.: Automatic measurement of a qos metric for web service recommendation. In: Proc. of the 2005 Australian conference on Software Engineering. pp. 202– 211. IEEE Computer Society, Washington, DC, USA (2005)