Dynamic Monitoring of Structures Using a Robotic Total Station Daniel PALAZZO, Raul FRIEDMANN, Carlos NADAL, Mauro SANTOS FILHO, Luis VEIGA and Pedro FAGGION, Brazil
Key words: robotic total station, dynamic monitoring, geodetic techniques
SUMMARY In recent years, some researches have revealed the advantages of using a robotic total station (RTS) for dynamic monitoring of structures. The advantages include the automatic target recognition, autonomous operation, once lock to the target has been manually set by an operator, monitoring of moving objects, the possibility of measuring indoors. However, the use of robotic total station for monitoring the movement of civil structures is still limited to the fact that angles and lengths are measured with time slide that the size is not known yet. This paper reports sets of experiments performed at LAIG (Geodetic Instrumentation Laboratory) of Federal University of Paraná. These experiments were conducted to gauge the accuracy of Leica TCRA 1205 for monitoring of a moving target on vertical plane. A particular equipment was designed to simulate the “up and down” movement of a low frequency deformatting structure. Furthermore, the robotic total station was conducted to a field experiment. A historical bridge was monitored using the RTS for measuring angles and distances at a 2 Hz data rate. RESUMO Estudos recentes têm revelado as vantagens do uso de estações totais robotizadas (ETR) no monitoramento dinâmico de estruturas. As vantagens incluem o reconhecimento automático de alvos, aquisição de dados de forma autônoma, uma vez que a estação tenha travado no alvo indicado pelo usuário, monitoramento de objetos em movimento, além da possibilidade do monitoramento em locais fechados. Contudo, o uso de estações totais robotizadas no monitoramento dinâmico de estruturas civis continua limitado pelo fato das medições de ângulos e distâncias serem realizadas em tempos diferentes, sendo esse intervalo de tempo ainda desconhecido. Este artigo apresenta uma série de experimentos realizados no LAIG (Laboratório de Instrumentação Geodésica) na Universidade Federal do Paraná - UFPR. Tais experimentos forma realizados com a finalidade de se conhecer a acurácia da estação total TCRA 1205 da Leica, no monitoramento de alvos em movimento. Um equipamento em particular foi desenvolvido com intuito de simular o movimento vertical de uma estrutura com baixa freqüência de deslocamento. Além disso, experimentos com a TCRA 1205 foram realizados em uma ponte histórica. Neste caso, a taxa de aquisição das medidas dos ângulos e das distâncias foi fixada em 2 Hz
TS 78 – Survey Control and Monitoring of Buildings 1/10 Daniel R. Palazzo, Raul M. P. Friedmann, Carlos A. Nadal, Mauro L. Santos Filho, Luis A. K. Veiga and Pedro L. Faggion Dynamic Monitoring of Structures Using a Robotic Total Station Shaping the Change XXIII FIG Congress Munich, Germany, October 8-13, 2006
Dynamic Monitoring of Structures Using a Robotic Total Station Daniel PALAZZO, Raul FRIEDMANN, Carlos NADAL, Mauro SANTOS FILHO, Luis VEIGA and Pedro FAGGION, Brazil
1. INTRODUCTION There are an increasing number of bridges in Brazil that require informed decisions to be made about their continued safety and serviceability. The deterioration of materials and the increasing of traffic loads are the major problem in many countries throughout the world. In accordance to Long et al. (2001), 50% of the expenditure in construction industry in Europe is spent on repairings, maintenance and remediation. In Brazil these numbers are unknown. But recent incidents, as the collapse of the bridge over Capivari River (Faé, 2005), demonstrates the need of a more reliable information about bridges “health” in order to achieve a better management of the existing founds. Dynamic tests have become more prevalent in recent years. They are considered the most complete technique for monitoring of bridges (Soares, 2000), which are capable to provide a global assessment of the bridges. Geodetic techniques have been used over the last decades for the monitoring of structures. Recent developments allow total stations track, to make measurements of distances and angles to a target in motion and to store data automatically. It has been demonstrated that robotic total stations (RTS) can be used for dynamic deformation monitoring of structures in certain circumstances with good results (Cosser et al., 2003). The aim of this paper is to report sets of experiments performed at LAIG (Geodetic Instrumentation Laboratory) of Federal University of Paraná - UFPR, which were conducted to gauge the accuracy of Leica TCRA 1205 for monitoring of a moving target. Two different prisms were used (standard and 360). A particular equipment was designed to simulate the “up and down” movement of a low frequency deformatting structure. In addition, the robotic total station was conducted to a field experiment. A historical bridge was monitored using the RTS for measuring angles and distances at a 2 Hz data rate. 2. TESTS INSTRUMENTATION 2.1 Robotic Total Stations The LAIG owns a Leica TCRA 1205 robotic total station and a Leica TC2002 total station. These two instruments were used in the laboratory experiments and at the UFPR campus experiments. The bridge trial was conducted using only the TCRA 1205 in order to verify the response of the bridge to dynamic traffic load. TS 78 – Survey Control and Monitoring of Buildings 2/10 Daniel R. Palazzo, Raul M. P. Friedmann, Carlos A. Nadal, Mauro L. Santos Filho, Luis A. K. Veiga and Pedro L. Faggion Dynamic Monitoring of Structures Using a Robotic Total Station Shaping the Change XXIII FIG Congress Munich, Germany, October 8-13, 2006
Table 1 shows TCRA 1205 and TC2002 accuracy for static and dynamic modes (Leica, 2004; Wild, 1994). Tab. 1 - TCRA 1205 and TC2002 accuracy
Static Mode Tracking Mode
Measurements
TCRA 1205
TC 2002
Distance
2mm + 2ppm
1mm + 1 ppm
Angle
5”
0,5” ± 0,1”
Distance
5mm + 2ppm
------
Angle
5”
------
2.2 2D Oscillator The 2D oscillator is an equipment developed in LAIG - UFPR for dynamic and stop-and-go experiments with robotic total stations. It’s formed by three basic units: an arm, which forces the prism to move up and down in a maximum range of 1,4 m; a motor, which enables automatic movement of the prism and; an electronic unit, which controls the period that the target stands on the higher or lower position. This period does not depend on the amplitude of the prism oscillation and is limited to a range of 1s until 25s. Figures 1 and 2 show oscillator 2D.
Fig. 1 - The oscillator 2D and the standard prism positioned on the industrial pillar
Fig. 2 - The oscillator 2D and the standard prism positioned on the the wall of LAIG
3. INICIAL TESTS Experiments using Leica TCRA 1205 robotic total station were carried out on two different places at UFPR. The first set of experiments was conducted at LAIG and the other one on the University Campus. Figures 3, 4 and 5 show the equipments used during the tests. TS 78 – Survey Control and Monitoring of Buildings 3/10 Daniel R. Palazzo, Raul M. P. Friedmann, Carlos A. Nadal, Mauro L. Santos Filho, Luis A. K. Veiga and Pedro L. Faggion Dynamic Monitoring of Structures Using a Robotic Total Station Shaping the Change XXIII FIG Congress Munich, Germany, October 8-13, 2006
Fig. 3 - TCRA 1205
Fig. 4 - 3600 Prism
Fig. 5- TC 2002
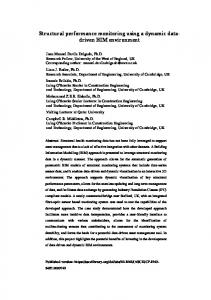
3.1 Laboratory Testes Laboratory testes were carried out to investigate RTS capabilities for continuously monitoring of moving targets and a better understanding about colleted data with different sampling rate. A Leica standard prism was attached to the 2D oscillator and was moved up and down in the vertical plane. The amplitude of this movement was fixed on 0,6 m. The RTS was positioned onto the top of an industrial pillar. The horizontal distance from the RTS to the 2D oscillator was arranged to 3,45 m due to laboratory space limitations. Two sessions of 240 s of observations at 2 Hz and 0,5 Hz were recorded. Additionally, the TC 2002 was employed to provide independent observations, in static mode, of the coordinates on the lower and upper points. Since TC 2002 is a more precise total station than TCRA 1205 (see Table 1), the coordinates provided from TC 2002 total station were defined as the standards for all experiments. Figure 6 shows the slope distances recorded on these tests. It can be seen that better results are achieved when a higher sampling rate is used. The reason for the difference between the results of the two sets of tests is the fact that the amount of colleted data is higher using a higher sampling rate, because the colleted observations are made in a shorter period of time. The robotic total station could not record all data measuring angles and distances at a 0,5 Hz data rate. The maximum coordinates deviations verified from the TC 2002 to the TCRA 1205 are shown in Table 2. The maximum deviation values of X, Y and Z coordinates are smaller than the accuracy of the RTS. Tab. 2 - Maximum coordinates deviations of laboratoy tests Sampling Rate
Maximum Deviation (mm) X
Y
Z
0,5 Hz
1,5
0,4
2,2
2,0 Hz
1,9
0,2
1,6
TS 78 – Survey Control and Monitoring of Buildings 4/10 Daniel R. Palazzo, Raul M. P. Friedmann, Carlos A. Nadal, Mauro L. Santos Filho, Luis A. K. Veiga and Pedro L. Faggion Dynamic Monitoring of Structures Using a Robotic Total Station Shaping the Change XXIII FIG Congress Munich, Germany, October 8-13, 2006
3,530
Slope Distance (m)
3,520 3,510 2 Hz
3,500
0.5 Hz
3,490
Low er Point
3,480
Upper Point
3,470 3,460 3,450 0,0
25,0
50,0
75,0
100,0
125,0
150,0
175,0
200,0
225,0
Time (s)
Fig. 6 - Results of Laboratory Tests
3.2 Tests on the University Campus Tests at the University Campus were carried out to investigate the accuracy of TCRA 1205 on dynamic experiments collecting data with different sampling rates, with different prisms and different standoffs for the RTS. Also in this case, all data provided from TC 2002 total station were defined as the standards for a comparison with TCRA 1205. The prism was attached to the 2D oscillator and was moved up and down in the vertical plane. The RTS was positioned onto the top of an industrial pillar. Eighteen setups were carried out with changes on prisms (standard and 360), sampling rate (1 Hz, 2 Hz and 10 Hz) and distance between the prisms and the RTS (40,574 m, 100,773 m and 146,435 m). Observations of every setup were recorded in sessions of 150s. Table 3 presents the discrepancies on the results of the tests carried out at the University Campus. Discrepancies of slope distances are smaller than de accuracy of the TCRA 1205, maximum 1 mm for the standard prism and 1,9 mm for the 360o prism. For the 360o prism, the amount of 23,1 mm, which refers to the prism constant, must be decreased from the discrepancies verified in table 3. The maximum deviations of X and Y coordinates are also smaller than the accuracy of the RTS. These values correspond to: 4,6 mm in the X direction; and 3,4 mm in the Y direction. The maximum amplitude deviation verified between the TC 2002 and the TCRA 1205 (59 mm) is almost 10 times greater than the accuracy of RTS for tracking mode. Furthermore, it’s clear that these deviations are increasing by the influence of distance. These differences are mainly explained by initial deviations, the influence of the curvature of the Earth, the ATR (automatic target recognition) and the latency.
TS 78 – Survey Control and Monitoring of Buildings 5/10 Daniel R. Palazzo, Raul M. P. Friedmann, Carlos A. Nadal, Mauro L. Santos Filho, Luis A. K. Veiga and Pedro L. Faggion Dynamic Monitoring of Structures Using a Robotic Total Station Shaping the Change XXIII FIG Congress Munich, Germany, October 8-13, 2006
Tab. 3 - Discrepancies on the results of the tests on the University Campus TCRA1205
TC2002
Discrepancy
TCRA1205
TC2002
Discrepancy
Amplitude
Amplitude
between TCRA1205
Mean Slope
Mean Slope
between TCRA1205
and TC2002
Distance
Distance
and TC2002
(Hz)
(mm)
(mm)
(mm)
(m)
(m)
(mm)
Standard
1,0
301,7
10,70
40,575
Standard
2,0
306,0
15,00
40,574
40,574
0
Standard
10,0
310,1
19,10
40,574
360
1,0
307,1
360
2,0
306,2
360
10,0
309,7
Standard
1,0
310,7
Standard
2,0
314,2
Standard
10,0
360
1,0
Prism
Sampling Rate
291,00
293,1
14,00
40,574
13,10
40,574
16,60
40,574
1 0 23 40,551
23 23
15,80
100,773
19,30
100,773
305,4
10,50
100,773
0
302,4
7,90
100,773
24
37,20
100,773
36,30
100,773
360
2,0
331,7
360
10,0
330,8
Standard
1,0
304,3
Standard
2,0
324,2
Standard
10,0
354,7
360
1,0
340,4
360
2,0
352,5
360
10,0
351,2
294,9
294,5
295,7
297,2
8,60
146,436
28,50
146,436
59,00
146,436
43,20
146,436
55,30
146,436
54,00
146,436
0 100,773
100,749
0
24 24 1
146,435
1 1 25
146,411
25 25
The analysis of recorded observations provides the information that an offset of about 4 mm is verified in all tests. In accordance with Leica user’s manual (1994), the accuracy distance in tracking mode is 5 mm + 2 ppm and angle accuracy is 5”, but when ATR sensor is working, to minimize measurement time the telescope’s crosshairs are only positioned within a 16” tolerance of the prism center. These positioning tolerances may produce an offset of 12 mm between two different points, 146m far from the RTS. Moreover, the influence of the curvature of the Earth provides an error 1,6 mm. This error is obtained from the following equation: (1) ε = 0,00008*d1,9887 where: d = horizontal deviation and considering: R = 6364630 m (Earth radius on the tests location; Earth is supposed to be spheric) Rt = 0,13 (refraction coefficient) The quantities already mentioned result in 17,6 mm total error. The differences from this error for the discrepancies observed in the table 3 are related to the latency phenomenon related by Radovanovic and Teskey (2001). TS 78 – Survey Control and Monitoring of Buildings 6/10 Daniel R. Palazzo, Raul M. P. Friedmann, Carlos A. Nadal, Mauro L. Santos Filho, Luis A. K. Veiga and Pedro L. Faggion Dynamic Monitoring of Structures Using a Robotic Total Station Shaping the Change XXIII FIG Congress Munich, Germany, October 8-13, 2006
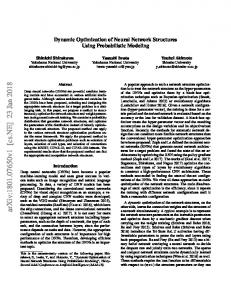
The last results analysis show that observation acquisitions were stable during session tests where sampling data rate was 1 Hz and 2 Hz. However, sampling data rate set up to 10 Hz was not constant and varied around 8 Hz. 4. BRIDGE TESTS The bridge tests were conducted at Rio Pelotas Bridge which links Rio Grande do Sul State and Santa Catarina State, South of Brazil. Rio Pelotas Bridge is a prestressed concrete bridge, which was constructed in 1966. The bridge measures 250 m in length, with the main span being 189,0 m long and 7,5 m wide. Figure 7 shows bridge location.
Figure 7 - Bridge location
249
4
E
94,5 H
G
F
Rio Grande do Sul
30 I
15,4
19
15
124,5 94,5
30
A D B
C
19
Santa Catarina
3,6
124,5
Figure 8 - Bridge dimensions (m)
TS 78 – Survey Control and Monitoring of Buildings 7/10 Daniel R. Palazzo, Raul M. P. Friedmann, Carlos A. Nadal, Mauro L. Santos Filho, Luis A. K. Veiga and Pedro L. Faggion Dynamic Monitoring of Structures Using a Robotic Total Station Shaping the Change XXIII FIG Congress Munich, Germany, October 8-13, 2006
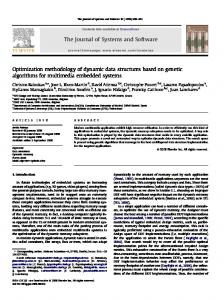
Initial experiments were conducted at Rio Pelotas Bridge in order to test the RTS in a high frequency environment. Figure 9 shows the layout the monitoring stations location and RTS reference station. RTS was located on the bedrock, on concrete pillars, about 180 m away from the monitoring points. Two standard prisms (P1 and P2) were mounted on the bridge’s handrail. The total station was set up to collect data, resultant of bridge dynamic traffic load, on two sessions of 85 s, at a rate of 10 Hz. As well the tests at the University Campus,the results analysis show that sampling data rate was not constant during bridge tests and varied around 7 Hz.
P2
P1
RTS reference station
Pelotas River
Figure 9 - Rio Pelotas Bridge and monitoring points
The TCRA 1205 observations yielded the precisions and the amplitudes showed in table 4. It can be seen that there is a different behavior of the bridge, concerning to the reflector’s response. This must be explained by the fact that different dynamic loads were applied on bridge during session tests. In first case (reflector P1), traffic loads were mainly composed by passenger cars and in the other case (reflector P2), traffic loads were mainly composed by trucks. So the amplitudes in all directions, provided by the reflector 2 are greater than that from the reflector 1. The maximum standard deviation values are close to the distance accuracy of RTS shown in table 1. The maximum displacements calculated for reflectors 1 and 2 are close to that empirically observed, approximately 40 mm. Tab. 4 - Standard deviations and displacement amplitudes of bridge test Prism
Standard Deviations (mm)
Displacement Amplitudes (mm)
σN
σE
σZ
N
E
Z
P1
0,5
1,0
5,4
3,0
5,0
18,0
P2
2,6
1,2
6,2
13,0
11,0
26,0
Figures 10a and 10b refer to total station displacements in Z dirction. It’s clear the difference of displacements range on both reflectors.
TS 78 – Survey Control and Monitoring of Buildings 8/10 Daniel R. Palazzo, Raul M. P. Friedmann, Carlos A. Nadal, Mauro L. Santos Filho, Luis A. K. Veiga and Pedro L. Faggion Dynamic Monitoring of Structures Using a Robotic Total Station Shaping the Change XXIII FIG Congress Munich, Germany, October 8-13, 2006
REFLECTOR 1
REFLECTOR 2 15,0
15,0
10,0 Displacem ents (m m )
Displacem ents (m m )
10,0 5,0 0,0 -5,0
0,0 -5,0 -10,0
-10,0 -15,0 00:00:00
5,0
00:00:17
00:00:35
00:00:52
00:01:09
Tim e (H:m in:s)
Fig. 10a - Displacementes of reflector 1
00:01:26
-15,0 0:00:00
0:00:17
0:00:35 0:00:52 Tim e (H:m in:s)
0:01:09
0:01:26
Fig. 10b - Displacementes of reflector 2
5. CONCLUSIONS The aim of all experiments were achieved with success. The TCRA 1205 robotic station dynamic capabilities on monitoring of structures were verified. Three different tests were conducted in order to verify RTS accuracy and precision. The first tests were conducted in a laboratory ambient with changes made on sampling rate. At low speed, RTS measured the movement target well. It was noticed that a higher sampling rate could provide better results, because a larger amount of data is recorded. The tests at the University Campus showed that in dynamic monitoring of targets both satandard prism and 360o prism may be used, provinding good precision. In addition, the influence of the growing distance is reflected on the aplitudes of the displacement of the targets. The results from the Rio Pelotas Bridge tests showed that monitoring displacements resulted good precisions. The observed displacement amplitudes were close to the empirical amplitude. In all experiments, the RTS precision was above or close to the accuracy provided by Leica. But, the phenomenum of latency produces changes in observations that may be investigated in the future. Other experiments will be conducted by the researches of LAIG in order to identify and mitigate tihs effect. ACKNOWLEDGEMETS The authors wish to acknowledge the collaborative work of the undergraduate students (Daniel, Niarkios and Érica) and the postgraduate students (Ernesto) of the Department of Geomatics. The authors are also grateful to MANFRA for providing all technical information about Leica TCRA 1205.
TS 78 – Survey Control and Monitoring of Buildings 9/10 Daniel R. Palazzo, Raul M. P. Friedmann, Carlos A. Nadal, Mauro L. Santos Filho, Luis A. K. Veiga and Pedro L. Faggion Dynamic Monitoring of Structures Using a Robotic Total Station Shaping the Change XXIII FIG Congress Munich, Germany, October 8-13, 2006
REFERENCES COSSER, E.; ROBERTS, G. W.; MENG, X.; DODSON, A. (2003) Measuring The Dynamic Monitoring of Bridges Using a Total Station. In: 11th Symposium On Deformation Measurements, Santorini, Greece: FIG. FAÉ, C. L. (2005) Desabamento de Ponte no Paraná Levanta a Discussão Sobre o estado atual das Obras-de-Arte no Brasil e a Falta de Manutenção Preventiva. Téchne, São Paulo, n. 98, maio 2005. Avaliable at: [15 set. 2005] (in Portuguese). LEICA GEOSYSTEMS. (2004) TPS1200 Series - User’s Manual. Heerbrugg, Switzerland. WILD. (1994) TC 2002 - User’s Manual. Heerbrugg, Switzerland. LONG, A. E.; HENDERSON, G. D.; MONTGOMERY, F. R. (2001) Why assess the properties of near-surface concrete? Construction and Building Materials, n. 15, p. 65-79. Avaliable at: < http://www.elsevier.com/locate/conbuildmat> [23 set. 2003] RADOVANOVIC, R. S.; TESKEY, W. F. (2001) Dynamic Monitoring of Deforming Structures: GPS Versus Robotic Tacheometry Systems. In: 10th FIG INTERNATIONAL SYMPOSIUM ON DEFORMATION MEASUREMENTS, Orange, USA: FIG, p. 61-70. BIOGRAPHICAL NOTES Daniel Palazzo, MSc. Study Civil Engineering UFPR 1991-1996. Master study in Civil Construction UFPR 2000-2002. Doctor study since 2004 in the field of Engineering Surveying. Research in the field of structure health monitoring, dynamic behavior of structures and automated measuring systems. CONTACTS Daniel PALAZZO Department of Geomatics, Federal University of Paraná - UFPR Curitiba BRAZIL Tel. +55 41 33234122 Email:
[email protected] Web site:
TS 78 – Survey Control and Monitoring of Buildings 10/10 Daniel R. Palazzo, Raul M. P. Friedmann, Carlos A. Nadal, Mauro L. Santos Filho, Luis A. K. Veiga and Pedro L. Faggion Dynamic Monitoring of Structures Using a Robotic Total Station Shaping the Change XXIII FIG Congress Munich, Germany, October 8-13, 2006