DYNAMIC MORPHOLOGY-BASED CHARACTERIZATION OF STEM CELLS ENABLED BY TEXTURE-BASED PATTERN RECOGNITION FROM PHASE-CONTRAST IMAGES Mahnaz Maddah and Kevin Loewke Cellogy Inc., Menlo Park, CA 94025, USA.
[email protected],
[email protected]
ABSTRACT The increased use of stem cells to study disease states in vitro has created a need for tools that provide automated, non-invasive, and objective characterization of cell cultures. In this work, we address this need by developing a novel framework for stem cell assessment using time-lapse phase-contrast microscopy and automated texturebased analysis of images. We capture and quantify morphological changes during stem cell colony growth by segmenting each image of the time-lapse sequence into five distinct classes of cells. We apply our automated classification to enable non-invasive estimation of cell doubling time, and demonstrate applications of the presented framework for quantitative assessment of cell culture conditions. 1. INTRODUCTION Stem cell research holds enormous potential for studying and treating a wide range of human diseases [1]. Numerous large-scale studies using stem cells are underway, where thousands of lines are cultured and differentiated to cell types affected by the disease being studied. Conventional methods to characterize stem cells typically use destructive biochemical assays at sparse time points [2]. Important dynamics of stem cell growth and differentiation, which are crucial in understanding the response to stress or drugs, are thus not often captured. Furthermore, the stability, quality, and consistency of the cell cultures are mostly assessed through periodic visual inspection, which is time consuming and subjective. Therefore, there is a need for new tools that can provide automated, non-invasive, and objective characterization of stem cell cultures. Non-invasive time-lapse microscopy can provide continuous monitoring of stem cell cultures without disturbing cell growth. Automated image analysis techniques can then offer objective assessment of stem cell cultures for a variety of applications, such as quality control during stem cell culture, characterizing the dynamic response of cells to stress and drugs, evaluating new protocols, developing new types of media, and training new scientists on the aforementioned activities. Despite these broad applications, limited research has been done for non-invasive imaging and image analysis of stem cells. In early work [3, 5], single-time-point images of cell colonies were classified to pluripotent and differentiated using multiresolution wavelet texture analysis. In a later work, a texton-based approach was proposed for improved segmentation of colonies from background [4]. More recently [6], images of stem cell colonies were labeled as pluripotent and non-pluripotent based on the size and shape of the colonies. To our knowledge, no work has characterized the dynamics of stem We thank Uzma Shoukat-Mumtaz for preforming iPSC cultures.
Intensity Histogram
…
LBP Histogram
…
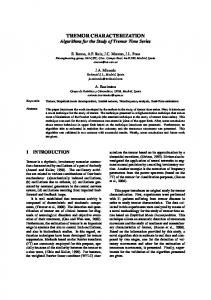
SVM Classifier Sample patches in training set Single cell Medium Compaction Full Compaction Dead Cell Differentiated
… … … … …
Fig. 1. Overview of the presented classification framework. For a given input image, each image patch is mapped to a 1-dimensional feature vector consisting of the zero-mean histogram of intensity and histogram of local binary patterns of the patch. An SVM classifier is trained on feature vectors computed from the manually labeled patches of five cell stages, and then used for classification of new images.
cell colony growth using time-lapse imaging and morphology-based image analysis. In this work, we present a framework for automated analysis of phase-contrast images of stem cells, with a focus on induced pluripotent stem cells (iPSCs) [2], to capture and quantify morphological changes during colony growth. We focus on the period of iPSC expansion and maintenance, when iPSCs are vulnerable to sporadic changes as well as variations in handling and culture. Our framework takes time-lapse images of iPSC cells as the input, processes each image, and classifies each foreground pixel based on the local texture pattern to five classes: single-cell, medium-compaction (where neighboring cells have gaps between them, visible via the presence of bright phase-contrast halos), full-compaction (where cells are flat and in full contact with neighbors), differentiated cells, and dead cells. Such multiclass segmentation provides a rich description of iPSC colony growth and enables the measurement of quantitative morphological changes in response to different cell culture conditions such as variations in the media type and environmental factors. This is especially important when studying changes that do not nec-
essarily induce cell differentiation yet impact the colony morphology and overall quality. An overview of our framework is shown in Figure 1. Our input data consists of time-lapse images of iPSC growth 1 . Images are first processed and segmented to foreground and background. We then follow a patch-based image representation [7] and map each image patch to a 1-dimensional feature vector that captures local texture and intensity information for the center pixel of that patch. We then train a Support Vector Machine (SVM) classifier [8] on feature vectors computed from the manually labeled patches of five cell stages, and employ the classifier in segmentation of new images. To our knowledge, this is the first demonstration of an automated analysis of stem cell growth dynamics, which enables quantification of cell culture morphology over time, including the extraction of different compaction patterns and differentiated cells. In the following sections, we first describe the method and demonstrate its performance and robustness. We then present three example applications of our method for stem cell characterization: a) non-invasive estimation of the doubling time, a widely-used but typically invasivlymeasured metric of cell growth, b) quantifying the prevalence of differentiated cells over time under stress conditions, and c) quantifying the changes in compaction patters when cells are cultured in two different media types. 2. METHOD 2.1. Image Enhancement and Background Estimation Time-lapse images are acquired at multiple focal planes at each time point. Images are first processed to have optimal focus, illumination, and contrast. We identify the best in-focus image from the z-stack of images at every time point by applying a Sobel filter. The image with highest edge strength is then corrected for background illumination inhomogeneity and enhanced for contrast. Cells are segmented by removing the background image, estimated first by generating a local entropy map of the image intensity, followed by thresholding to create a binary image, and then further processed through morphological operations to remove small clusters and holes. 2.2. Feature Extraction Stem cells exhibit different textural patterns in the course of colony formation including: single-cell, medium-compaction, fullcompaction, dead cells, and differentiated cells. Our goal is to classify each foreground pixel I(m, n) of the image I to one of these five classes. First a local binary pattern (LBP) [9] of the image is constructed:
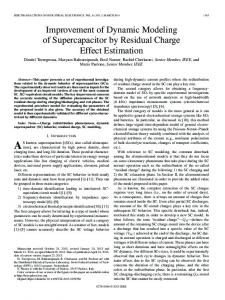
where bi and bl are the bins for the intensity and LBP histograms, respectively. This feature vector is used to classify each pixel as described in the next subsection. 2.3. Classification To classify image pixels based on their corresponding feature vectors, we employ a standard approach using a one-against-one multiclass SVM [8]. First we build a library of patches for each class labeled manually by an expert and calculate their corresponding feature vectors. After normalizing the feature vectors to the range [1,1], we optimize the parameters of the classifier with a Gaussian kernel to obtain the highest classification accuracy in predicting labels in the training set. This resulted in 98.6% accuracy using 5-fold cross-validation. Once trained, the classifier is applied to classify each foreground pixel in a given image to one of the five cell stages. For regions that are classified as dead cells, further processing is performed to infer the type of region underneath them (dead cells float on top of colonies). If a dead cell region is surrounded by pixels classified as full-compaction, for example, that dead cell region takes a new label that indicates dead cell on top of full-compaction region. If dead cell region is mostly surrounded by the background, it keeps the class label of dead cells. Figure 2 shows the results of our method for sample images of two datasets. The image regions are successfully classified as single-cell (red), medium-compaction (yellow), full-compaction (green), dead-cell (blue) and differentiatedcell (cyan). 3. EXPERIMENTS AND RESULTS Imaging of iPSCs was performed on two custom built live-cell imaging and incubation systems with integrated software for image capture and storage. Images were collected using low-light phase contrast illumination with a 10x objective, every 30 minutes, in 12-well dishes and at six different x-y locations per well to obtain an adequate sample of the cells. The images were acquired at 7 focal planes per position to capture a range of focus. Media changes on the culture were performed during time intervals when the time-lapse images were not being captured. In a single experiment over 3-4 days, up to 100,000 images can be captured. To manage this large volume of data, directly after capture, images were automatically uploaded to a secure cloud-based system for subsequent processing and analysis. Successful processing of over 500 time-lapse sequences and visual assessment of the resulting segmentation by independent experts demonstrated the robustness of the proposed framework. 3.1. Non-Invasive Estimation of Cell Doubling Time
LP,R (m, n) = LBPP,R (I(m, n)), for m = 1, · · · , M and n = 1, · · · , N
(1)
where M × N is the dimension of the image. In this work we used P = 8 and R = 1. Then, at each pixel I(n, m) a patch I(m − k...m + k, n − k...n + k) is selected, where each patch is a (2k + 1) × (2k + 1) subset of I and k = 25 pixels. The histogram of the image intensity and the LBP are calculated over each patch and a feature vector is defined at each pixel as the concatenation of the two histogram vectors: Fm,n = [hist(I(µ, ν), bi ), hist(LP,R (µ, ν), bl )] for µ = m − k, ..., m + k and ν = n − k, ..., n + k 1 An
(2)
example dataset can be found at: http://www.cellogy.com/isbi2014/
Cell-stage classification enables us not only to quantify the compaction pattern over time but also to estimate number of cells in an automated and non-invasive way from phase-contrast images. Given the output of cell stage classification and an average cell density per class, the total number of cells is estimated by summing over the area of each class weighted by their corresponding cell density. The number of cells (per unit area) for each cell class (single-cell, medium compaction, and full-compaction) was trained and validated on a sampling of phase contrast images with corresponding DAPI-stained images and segmented nuclei as the ground truth. To calculate the cell doubling-time, T, we fit the following function to the cell count curve: ( y0 2(t−t0 )/T , if t ≥ t0 y(t) = (3) y0 , otherwise
Fig. 2. Results of automated cell stage classification for two datasets. A sampling of images from (top) a standard time-lapse iPSC experiment and (bottom) an experiment with a stressor added to induce differentiation. The image regions are successfully classified as single-cell (red), medium-compaction (yellow), full-compaction (green), dead-cell (blue), and differentiated-cell (cyan).
where y(.) is the cell count, y0 is the initial number of cells, and t0 is the short period where the number of cells stays relatively constant. Figure 3 shows an example doubling time measurement for one of the images sequences, as well as a boxplot of doubling time measurements for 12 clones across over 300 time-lapse image sequences. We treat the exponential fit error as both a metric for reliability of estimated doubling time as well as a measure of quality of stem cell culture, since they are expected to follow a exponential growth. The average doubling time across all iPSC lines was approximately 15 hours, which shows high consistency with previously reported doubling times for iPSCs [10] and human embryonic stem cells [11]. 3.2. Quantification of Stress Conditions The quality of iPSC cultures is often assessed through the prevalence of unwanted spontaneously differentiated cells. To further evaluate the ability of our software to detect differentiated cells, we performed an experiment under stress conditions by adding a small amount (2 uM) of retinoic acid to the culture media 20 hours from start of imaging. The addition of retinoic acid generated a sudden and rapid process of cellular differentiation that included enlargement and flattening of the cells, similar but not identical to sponta-
neously differentiated cells. Figure 4 shows the variation in prevalence of each type over time. Our method clearly identifies a dramatic reduction in medium- and full-compaction cells around frame 40, relative to the control cell populations, as well as a corresponding increase in the prevalence of differentiated cells. 3.3. Evaluation of Media Types The selection of media is an important aspect of iPSC culture. There are a variety of commercially available media types, as well as new media being developed by research groups. Media types are typically evaluated through their impact on stem cell proliferation (e.g. doubling time), morphology (e.g. compactness), and pluripotency. We therefore designed an experiment to evaluate the effects of two different iPSC media types using time-lapse imaging and automated analysis. Prior to imaging, iPSCs were transitioned to the two media types and maintained for at least two passages to allow adaptation. The plots in Figure 5 show results of a preliminary study revealing that Media Type 1 generated less fully-compacted cells relative to Media Type 2. The difference increases over time and after 37 hours from the beginning of the experiment, one-way analysis of variance yields p-value