Dynamic Reweighting of Three Modalities for Sensor Fusion Sungjae Hwang1*, Peter Agada3, Tim Kiemel3, John J. Jeka1,2 1 Department of Kinesiology, Temple University, Philadelphia, Pennsylvania, United States of America, 2 Bioengineering, Temple University, Philadelphia, Pennsylvania, United States of America, 3 Department of Kinesiology, University of Maryland, College Park, Maryland, United States of America
Abstract We simultaneously perturbed visual, vestibular and proprioceptive modalities to understand how sensory feedback is reweighted so that overall feedback remains suited to stabilizing upright stance. Ten healthy young subjects received an 80 Hz vibratory stimulus to their bilateral Achilles tendons (stimulus turns on-off at 0.28 Hz), a 61 mA binaural monopolar galvanic vestibular stimulus at 0.36 Hz, and a visual stimulus at 0.2 Hz during standing. The visual stimulus was presented at different amplitudes (0.2, 0.8 deg rotation about ankle axis) to measure: the change in gain (weighting) to vision, an intramodal effect; and a change in gain to vibration and galvanic vestibular stimulation, both intermodal effects. The results showed a clear intramodal visual effect, indicating a de-emphasis on vision when the amplitude of visual stimulus increased. At the same time, an intermodal visual-proprioceptive reweighting effect was observed with the addition of vibration, which is thought to change proprioceptive inputs at the ankles, forcing the nervous system to rely more on vision and vestibular modalities. Similar intermodal effects for visual-vestibular reweighting were observed, suggesting that vestibular information is not a ‘‘fixed’’ reference, but is dynamically adjusted in the sensor fusion process. This is the first time, to our knowledge, that the interplay between the three primary modalities for postural control has been clearly delineated, illustrating a central process that fuses these modalities for accurate estimates of self-motion. Citation: Hwang S, Agada P, Kiemel T, Jeka JJ (2014) Dynamic Reweighting of Three Modalities for Sensor Fusion. PLoS ONE 9(1): e88132. doi:10.1371/ journal.pone.0088132 Editor: Maurice J. Chacron, McGill University, Canada Received November 26, 2013; Accepted January 7, 2014; Published January 31, 2014 Copyright: ß 2014 Hwang et al. This is an open-access article distributed under the terms of the Creative Commons Attribution License, which permits unrestricted use, distribution, and reproduction in any medium, provided the original author and source are credited. Funding: This study was supported by NIH Grant R01 NS35070 (John J. Jeka, principal investigator). The funders had no role in study design, data collection and analysis, decision to publish, or preparation of the manuscript. Competing Interests: The authors have declared that no competing interests exist. * E-mail:
[email protected]
sensory system or the combined influence of two sensory systems. Here we investigate the combined influence of all three sensory systems for the control of human upright posture. This is the first time, to our knowledge, that the interplay between the three primary modalities for postural control has been clearly delineated, illustrating a central process that fuses these modalities for accurate estimates of self-motion.
Introduction Control of human upright stance during standing requires sensory input from multiple sources to detect center of gravity of gravity excursions and to generate appropriate muscle responses for upright stance control. Without appropriate knowledge of selforientation, equilibrium control is severely compromised [1]. Estimation of body position/velocity (i.e., self-motion) is heavily dependent upon the integration of information from multiple sensory modalities including visual, vestibular and somatosensory (touch, pressure, proprioception); as evidenced by numerous studies that have shown that the stimulation of visual [2–7], proprioceptive [8–11], or vestibular systems [12–15] evoke body sway. Numerous studies have demonstrated that the integration of sensory information (i.e., sensor fusion) appears to be dynamically regulated to adapt to changing environmental conditions and the available sensory information, a process referred to as ‘‘sensory reweighting’’ [1,16–23]. Sensory reweighting is the process through which the nervous system changes the ‘‘emphasis’’ of a particular sensory input due to neurological injury or when environmental conditions change. For example, during eyes-closed stance on a fixed, level surface, the primary sensory source for information about body orientation in space is proprioceptive, but under conditions where the platform moves, the primary source of sensory information shifts from proprioceptive to vestibular [16,23]. Most of these previous studies stimulated an individual PLOS ONE | www.plosone.org
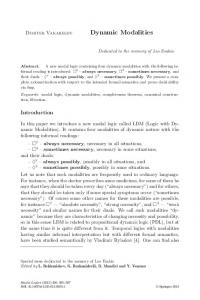
Materials and Methods Experimental Methods Subjects. Ten healthy young subjects (6 males, 4 females; weight 73614 kg and height 174.267.0 cm), aged 21–35 yr, were participated in the study. They all reported no musculoskeletal injuries or neurological disorders that might affect their ability to maintain balance. The procedures used in the experiment were approved by the Institutional Review Board at the University of Maryland and all the subjects gave written informed consent to participate as approved by the committee. Experiment setup. Subjects stood in the middle of the visual cave and faced the front wall, as shown in Figure 1. Subjects assumed a foot position with heels at a distance of ,11% of their heights and an angle of 14u between each foot and the midline [24]. The instruction to the subjects was to look straight ahead at the front screen and stand upright comfortably. Foot position was marked in order to be consistent throughout the experiment. Subjects were tested in four conditions; standing with low 1
January 2014 | Volume 9 | Issue 1 | e88132
Three Modality Sensor Fusion
amplitude visual scene movement - vibration - GVS (L-V-G); standing with low amplitude visual scene movement - GVS – no vibration (L-G); standing with high amplitude visual scene movement - vibration - GVS (H-V-G); standing with high amplitude visual scene movement - GVS - no vibration (H-G). Four trials from each condition were run in randomized order, repeated seven times for a total of twenty eight trials. The length of each trial was 125 seconds with 5 seconds added at the beginning and end of each trial (total 135 seconds) to allow the visual and vestibular sensory perturbations to ramp up and ramp down. The ramping was not applied to the vibration signal because of the electronic functional limitation of the vibrator to turn on and off quickly to approximate a square-wave periodic stimulus.
in anterior-posterior direction (i.e., sagittal plane). The visual stimulus was presented at different amplitudes (0.2 deg and 0.8 deg rotation about ankle axis) at 0.2 Hz to measure: the change in gain (weighting) to vision, an intramodal effect; and a change in gain to vibration and galvanic stimulation, both intermodal effects. For the proprioceptive sensory perturbation, bilateral vibration of Achilles tendons was applied through two 20 mm vibrator motors, driven at 80 Hz and 1 mm amplitude displacement. While vibration is a common technique, it is typically used in an always-on or always-off manner (e.g., Capicikova et al, 2006) [25]. For this study, we designed the vibrator to turn on and off quickly to approximate a square-wave periodic stimulus of a specified frequency with equal on and off time durations. The vibrators are enclosed in a hollow rectangular PVC container (3.563.863.5 cm) with a flexible recessed surface mounted on the contact face for comfortable fitting around the Achilles tendon. The enclosure was held in place by an elastic strap. The proprioceptive sensory perturbation was applied to different conditions (standing with vibration or standing without vibration) at 0.28 Hz. For the vestibular sensory perturbation, two linear isolated stimulators (Biopac Systems, Inc., Goleta, California, USA) were used as a binaural-monopolar galvanic vestibular stimulation (GVS). Independent stimuli were delivered to each side via a pair of circular electrodes secured over the mastoid
Visual, proprioceptive and vestibular sensory perturbations. For the visual sensory perturbation, we used
the visual display (called as visual cave) which was projected by JVC projectors (Model: DLA-M15U, Victor Company, Japan) to three mirrors, which reflected and rear-projected onto a visual cave consisting of three 2.6763.33 m screens (Fakespace, Inc, Marshalltown, Iowa, USA). The visual display consisted of 500 randomly distributed white triangles (3.463.463 cm) on a black background. To reduce aliasing effects in the foveal region, no triangles were displayed within a horizontal band of 65 degree at eye height. The frame rate of the visual display was 60 Hz. A visual signal was displayed as a visual rotation around ankle joint
Figure 1. Experimental setup showing standing subject with simultaneous visual, vibration and galvanic vestibular perturbations. The visual stimulus at different amplitudes (0.2, 0.8 deg rotation about ankle axis) at 0.2 Hz, the 80 Hz vibratory stimulus to subject’s bilateral Achilles tendons (stimulus turns on-off at 0.28 Hz) and a 61 mA bilateral monopolar galvanic vestibular stimulus at 0.36 Hz were simultaneously applied. doi:10.1371/journal.pone.0088132.g001
PLOS ONE | www.plosone.org
2
January 2014 | Volume 9 | Issue 1 | e88132
Three Modality Sensor Fusion
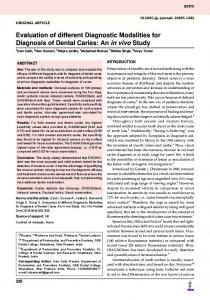
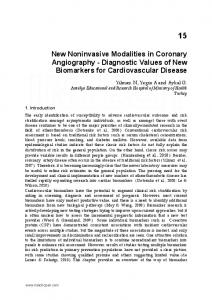
process with an elastic headband and 2 cm ipsilateral to the T2 spinous process [26]. The electrodes were secured using adhesive tape and conductive electrode gel was applied at the electrode– skin interface to improve conductance. GVS consisted of a 61 mA sinusoidal galvanic stimulus at 0.36 Hz and the polarity of stimulation was always the same for the two sides (binauralmonopolar GVS) to perturb subjects in the sagittal plane. GVS was applied to subjects in every trial of all conditions. Different frequencies for each stimulus were chosen so that we could measure a response to each modality independently and so that they did not share common low-order harmonics. Figure 2 shows an example of a trial showing the stimulus signals and segments angles used for signal processing. Kinematics. Kinematics were captured by Vicon MX digital optical motion capture system with six infrared cameras (Vicon, UK). The head (the temple), shoulder (the scapula), hip (the greater trochanter), knee (the lateral femoral condyle), ankle (the lateral malleolus) and foot (the first metatarsal head) were measured by attaching twelve reflective markers on both sides of the subject to measure subject’s anterior-posterior movement in the sagittal plane. The leg segment angle h1(t) and trunk segment angle h2(t) with respect to vertical were determined by the anteriorposterior (AP) and vertical displacement of the shoulder, hip and ankle markers, as shown in Figure 3. Kinematics were sampled at 120 Hz.
Figure 3. Schematic diagram of the body showing the leg segment angle h1 and trunk segment angle h2. doi:10.1371/journal.pone.0088132.g003
the 50-s window contains an integer number of cycles of each perturbation signal. The frequency response function (FRF) is the CSD divided by the PSD of the input. Gain, the absolute value of the FRF, is the amplitude of the output divided by the amplitude of the input at each driving frequency. For example, if the amplitudes of a segment angle response and the visual perturbation at the driving frequency are the same, the unitless gain (deg/ deg) will equal one. Phase of the FRF is a measure of the temporal relationship between the input and output; the output may lead
Analysis Spectral analysis. For any two signals x(t) and y(t), the power spectral densities (PSDs) pxx(f) and pyy(f) and cross spectral density(CSD) pxy(f), where f is frequency, were computed using Welch’s method [27] with 50-s Hanning windows and 50% overlap and then averaged across trials. Note that 25 s is an integer multiple of the periods of all three perturbation signals, so
Figure 2. An example of a trial showing the stimulus signals and segments angles used for signal processing. doi:10.1371/journal.pone.0088132.g002
PLOS ONE | www.plosone.org
3
January 2014 | Volume 9 | Issue 1 | e88132
Three Modality Sensor Fusion
leg gain relative to visual (Figure 4A) and GVS (Figure 5A) stimuli decrease from the L-V-G and H-V-G conditions, respectively (F(1,9) = 5.7, p,.05; F(1,9) = 5.4, p,.05). These intermodal effects suggest that vibration changes processing of proprioceptive information at the foot/ankle, forcing the nervous system to compensate by upweighting vision and vestibular information in the L-V-G and H-V-G conditions. Similar effects were observed for trunk gain for the visual stimulus in Figure 4B (F(1,9) = 5.1, p,.05), but no significant effects were observed for trunk gain relative to the GVS stimulus in Figure 5B.
the input (positive values) or lag behind it (negative values). Bootstrap standard errors were also computed for gains and phases using 1000 bootstrap resamples [28]. Statistical analysis. In order to determine effects due to a change in visual amplitude and effect due to vibration on/off, values for gain and phase of leg angle h1(t) and trunk angle h2(t) relative to visual stimulus signal and GVS were respectively assessed using visual amplitude effect (low vs high amplitude visual scene movement)6vibration effect (vibration or no vibration) two way repeated-measures ANOVA. For the vibration perturbation, the cluster of FRF values for different subjects surrounded the origin in the complex plane. Therefore, to test gain and phase we analyzed the FRF values using the maximum-likelihood method of Jeka et al. (2008) [29], which is designed for this case. For the visual and GVS perturbations, FRF values were clustered away from the origin, so we used the simpler method of computing gain and phase for each subject and then analyzing gain and phase separately using ANOVAs. Therefore, the maximum-likelihood method was applied to determine differences of gain and phase of leg and trunk angle relative to vibration between L-V-G and H-VG. A gain/phase response can be measured only with vibration turned on (L-V-G and H-V-G) because it cannot be measured with vibration turned off (L-G and H-G). Differences were accepted to be significant at p,0.05.
Phase Phase of the leg/trunk segments relative to each of the sensory stimuli shown in Figures 4–6 C–D indicated no differences across conditions. However, absolute differences in phase were observed relative to the mode of sensory stimulation. Leg/trunk segment angles displayed similar phase lags of 25 deg,30 deg relative to vision and phase advances of 50 deg and 25 deg, respectively, relative to vibration. Relative to the GVS stimulus, leg phase was zero and trunk phase was advanced by ,25 deg.
Discussion In this study, we investigated how the primary trio of modalities (visual, vestibular and proprioceptive system) that are crucial for flexible postural control are processed in order to provide estimates of self-motion that are optimal to stabilize upright stance. Theoretically, one can decompose sensory feedback into individual feedback components from each sensory modality. However, these modalities are not processed independently; when sensory conditions change an adaptive process known as sensory re-weighting changes the relative importance of each modality in a coordinated fashion. For the first time, we experimentally elucidate the sensor fusion process for all three modalities simultaneously during standing to understand how the nervous system adjusts the emphasis on each modality under different combinations of static and dynamic sensory input. In order to achieve these results, we used vibration in a novel way to induce and measure the effects of sensory re-weighting. Vibration is a common technique to perturb proprioceptive input; it can either be applied in a sustained manner [25,32] or turned on and off stochastically [33,34]. The second approach allows one to measure responses across a range of frequencies. Here we turned vibration on and off periodically to focus on a single stimulus frequency, allowing us to detect the effects of sensory re-weighting more precisely at this frequency. We designed the vibrator to turn on and off quickly to approximate a square-wave periodic stimulus at the specified frequency, allowing calculation of gain/phase of trunk and leg segments relative to the vibration stimulus. This was critical in allowing us to compare changes in gain/phase between each modality and allow interpretation of how each was reweighted as visual amplitude was manipulated.
Results Leg and trunk gain and phase responses are shown on separate plots relative to each sensory perturbation in Figures 4–6. Small white square represents standing with low amplitude visual scene movement – vibration – GVS (L-V-G), small black square represents standing with low amplitude visual scene movement GVS – no vibration (L-G), large white square represents standing with high amplitude visual scene movement - vibration - GVS (HV-G) and large black square represents standing with high amplitude visual scene movement - GVS - no vibration (H-G). It is most informative to digest how each sensory modality reacts to the same condition by comparing gains and phases across Figures 4–6.
Gain responses to visual amplitude change In Figure 4A, leg and trunk gain relative to vision decreases from the L-V-G condition to the H-V-G condition and from the L-G condition to the H-G condition (F(1,9) = 106.0, p,.001), reflecting a clear intramodal downweighting of vision as visual scene amplitude increased, consistent with previous studies [16,30,31]. This effect was observed for trunk gain relative to vision as well (F(1,9) = 91.4, p,.001), as shown in Figure 4B. We also observed intermodal effects due to a change in visual amplitude. For example, Figure 5A illustrates a significant increase in leg gain relative to the GVS stimulus (F(1,9) = 5.9, p,.04) when visual amplitude increases (L-V-G to H-V-G, L-G to H-G), reflecting an intermodal vestibular upweighting to compensate for visual downweighting. These effects were not observed for trunk gain relative to the GVS stimulus. There were also not any significant intermodal effects of visual amplitude change on leg/trunk gain relative to vibration (Figure 6).
Gain The results illustrate both intramodal and intermodal reweighting of trunk/leg segment responses relative to the three sensory perturbations. When visual amplitude was increased from the LV-G to the H-V-G condition, leg/trunk segment gain relative to vision decreases, suggesting downweighting of vision, consistent with previous studies [16,30,31]. With the increase in visual amplitude, we also observed an increase in vestibular gain relative to the galvanic stimulus, suggesting an intermodal upweighting of the vestibular information to compensate for visual downweighting. Intermodal upweighting of the proprioceptive channel was not
Gain responses to vibration on/off Intramodal effects were not observable with vibration because a gain response cannot be measured with vibration turned off. However, the effect of turning vibration on/off was clearly observed through intermodal effects on visual and GVS stimulation. When vibration is turned off in the L-G and H-G conditions, PLOS ONE | www.plosone.org
4
January 2014 | Volume 9 | Issue 1 | e88132
Three Modality Sensor Fusion
Figure 4. Gain and phase of segment angles relative to vision, showing intramodal visual reweighting (blue solid line) and intermodal visual-proprioceptive reweighting (red dashed line). Blue color indicates gain responses about changing of visual amplitude and red color indicates gain responses about vibration. Solid line indicates intramodal reweighting and dashed line indicates intermodal reweighting. The asterisk indicates significant reweighting effects (** for p,.01 and * for p,.05). A, gain of the leg segment angle relative to vision. B, gain of the trunk segment angle relative to vision. C, phase of the leg segment angle relative to vision. D, phase of the trunk segment angle relative to vision. Error bars denote bootstrap standard errors. doi:10.1371/journal.pone.0088132.g004
This interplay of intramodal (vision) and intermodal (proprioceptive and vestibular) effects reflect a central ‘‘sensor fusion’’ process that continuously incorporates sensory input to generate the most reliable estimates of self-motion for the maintenance of upright equilibrium. We also observed effects based upon body segment, as the trunk and leg segments did not respond equivalently to different types of stimuli. The contrast between segment effects based upon visual and vestibular gain are particularly striking. Intramodal and intermodal effects on visual gain were almost equivalent across the leg and trunk segments. This is consistent with the view that although the nervous system interprets visual information in the context of multi-segment dynamics, responses to visual information involves a single control signal that determines the activation of all muscles [35,36]. In contrast, intermodal effects of vision or vibration on vestibular gain were observed for the leg segment, with no significant effect on the trunk segment. This suggests that vestibular information not only provides information about intersegmental control, but that vestibular information is also used to differentially activate different muscles, consistent with previous work [37]. Clearly each modality is playing a specific role in controlling the multi-segment body.
observed. This may be due to the ‘‘local’’ nature of the vibratory stimulus. While the visual and vestibular modalities are anatomically organized so that a stimulus can bias the entire peripheral organ, muscle spindles are distributed throughout the musculature. A vibration localized to the Achilles tendon biases the sensory signals from an important muscle group related to posture, but there are many other muscles that play an active role in maintaining upright stance. Thus, intermodal effects of visual change on proprioception may be difficult to achieve because the bias is distributed across many proprioceptive sensors and in different body segments. Interestingly, intermodal effects of vibration on visual and vestibular gain were observed. The increase in trunk/leg gain relative to the visual and GVS stimuli from the L-G and H-G conditions to the L-V-G and H-V-G conditions, respectively, shows how the visual and vestibular modalities are upweighted when vibration is turned on. These intermodal effects are observed because vibration changes proprioceptive inputs at the ankles thereby making these inputs a less reliable indicator of self-motion. Disruption of proprioception, even locally at the ankles, seems to affect visual and vestibular processing much more than a change in the visual stimulus affects proprioception. This intermodal asymmetry emphasizes the delicate interplay between the modalities.
PLOS ONE | www.plosone.org
5
January 2014 | Volume 9 | Issue 1 | e88132
Three Modality Sensor Fusion
Figure 5. Gain and phase of segment angles relative to galvanic vestibular stimulation (GVS), showing intermodal reweighting. Blue color indicates gain responses about changing of visual amplitude and red color indicates gain responses about vibration. Dashed line indicates intermodal reweighting. The asterisk indicates significant reweighting effects (* for p,.05). A, gain of the leg segment angle relative to GVS. B, gain of the trunk segment angle relative to GVS. C, phase of the leg segment angle relative to GVS. D, phase of the trunk segment angle relative to GVS. Error bars denote bootstrap standard errors. doi:10.1371/journal.pone.0088132.g005
(