In an effort to develop control strategies for the wet-end of paper machines, dynamic ... A series of experiments were performed using a pilot paper machine.
Journal of Korea TAPPI Vol.39.No.1, 2007 Printed in Korea
Dynamic Simulation of Retention and Formation Processes of a Pilot Paper Machine Byoung-Uk Cho*1a , Gil Garnier*1b and Michel Perrier*2 (Received November 2, 2006: Accepted January 30, 2007)
ABSTRACT In an effort to develop control strategies for the wet-end of paper machines, dynamic models for retention and formation processes have been developed. The retention process, including headbox total and filler consistencies, white water total and filler consistencies, the basis weight and the ash content of paper, can be modeled from first-principles (mass balances). To include the effect of wet-end chemistry variables, first-pass retention was included as a parameter dependent on operating conditions. In addition, dynamics of formation was simulated by developing an empirical model of formation and coupling with the dynamic models for the retention process. A series of experiments were performed using a pilot paper machine. The experimental results and the model predictions showed relatively good agreement. Keywords : dynamic simulation, modeling, retention, formation
headbox pulp and filler consistencies, the white water pulp and filler consistencies, the basis weight and the ash content of paper; and the latter, related to the formation process, includes fiber flocculation in a headbox and formation of paper. What makes it difficult to control is the complexity of the wet-end process. More than 90 % of the white water is reused, and the effect of colloid chemistry at the wet-end on retention of solids and formation of
1. Introduction Wet-end control of papermaking has been a major issue in recent years due to its profound effect on paper quality and process efficiency. From the perspective of paper quality control, two important properties are: the machine direction (MD) variability and the uniformity of spatial distribution of solid materials in paper. The former, related to the retention process, includes the
8
paper has only been partially characterized yet. Hence, black box approaches have been mostly used to model and control the dynamics of the retention process (1-5). Using a first-principles modeling approach, the steady state and dynamic simulation of the wet-end of paper machines has already been established for decades (6-9). The main difficulty is to implement the effect of wet end chemistry on the retention process. Moreover, the dynamic modeling of formation has not been attempted yet. In a previous study (10), it was shown that the effect of wet end chemistry can be included by using first-pass retention as a variable dependent on certain process factors and simulation results of the dynamics of paper ash content were compared with experimental data. The objective of the present study was to model and to simulate the dynamics of the retention process (headbox and white water consistencies, basis weight and paper ash content) together with formation as a function of process variables.
machine at the Centre Spécialiséen Pâtes et Papiers (CSPP), CEGEP de Trois-Riviéres. The pilot paper machine is illustrated in Fig. 1. This is a Fourdrinier paper machine, 76 cm wide, operating typically at a velocity of 40 m/min (with maximum speed of 90 m/min). Pulp from a high consistency pulper is refined using a conical refiner, stored in stock chests, and sent to a machine chest. Thick stock from the machine chest is diluted with the white water from a wire pit, and then delivered to the centrifugal cleaners and to a pressure screen to remove contaminants. The headbox is of the open type. Drainage is achieved by 18 table rolls, 4 vacuum boxes and a couch roll. The drained water from the wire section is collected at the wire pit to be reused to dilute thick stock. The wet web is pressed with 2 nips, dried, and calendered. On-line sensors (ABB) are located after the calender to measure basis weight, ash content, formation, moisture content, caliper, brightness, and opacity of paper. Kajaani Rmi sensors are used to measure headbox total and filler consistencies and white water total and filler consistencies: the white water consistency sensor is installed at the white water tray.
2. Modeling 2.1 Process description
2.2 Dynamic modeling
The experiments were performed on the pilot paper
The paper machine representation was simplified as
Fig. 1. Pilot paper machine at the Centre Spécialisé en Pâtes et Papiers (CSPP), CEGEP de Trois-Riviéres.
9
펄프 종이기술
shown in Fig. 2, to highlight the short circulation loop of white water. The couch pit, savealls, machine chests, a screen, cleaners, etc. were omitted. The model is a three-fractional model, which handles fiber, fines and filler consistency. In the headbox and the white water tank, the mixing is assumed to be ideal, i.e. there is the same consistency everywhere in the volume. Thick stock was assumed to consist of fiber, fines and filler. The dynamics of the headbox consistencies C2,i (i = fines, filler and fiber, g/L) can be obtained from the mass balances around the headbox:
entering the wire section (i.e., in the headbox):
Ri =
F3C3,i F2C2,i
[3]
where F3 represents the flow rate of the wet web leaving the wire section and C is the consistency of each flow (g/L). Since F2 = F4 + F3 and F4 ≫F3, we could assume that F4 = F2. Then, the consistencies of white water C4,i (i = fines, filler and fiber) from the white water tray under the wire to the wire pit can be calculated with:
F2 = (1 − Ri )C2, i F4
dC 2 , i F 1 = ( F1C 1, i + F7 C 7 , i + F5 C 5 , i ) − 2 C 2 , i [1] dt V hb V hb
C4, i = (1 − Ri )C2,i
where, Vhb is the volume of the headbox (L) and Fj (j = 1, 2, 5 and 7) is the flow rate of each stream (L/min), i.e., F1 is the thick stock flow rate, F2 is the flow rate of the stock entering the wire section from the headbox, F5 is the flow rate of recirculating white water and F7 is the flow rate of filler slurry. The flow rate at the headbox F2 is controlled by the valve located just before the headbox. Hence, the flow rate of the recirculating white water is determined from the headbox flow rate and the flow rate of other input stream such as the thick stock flow and the filler flow:
The white water total consistency (C4,total) and the headbox total consistency (C2,total) are then given by:
F5 = F2 − ( F1 + F7 + Fpol + Fmp )
[4]
C j ,total = C j , fiber + C j , filler + C j , fines (j= 2 and 4) [5] The dynamics of the recirculating white water consistency C5,i are obtained from the mass balances around the wire pit:
dC5,i F4C4,i F4 = − C5,i dt Vwp Vwp
[6]
where Vwp is the volume of the wire pit and F4 is the flow rate of the white water from the white water tray to the wire pit. Assuming ideal mixing, C5,i = C6,i. The mass flow rate of solid materials leaving the wire section can be calculated with:
[2]
where Fpol is the flow rate of polymer solution and Fmp is the flow rate of microparticle suspension. From the mass balance on the wire, the first-pass retention of solid materials Ri (i = fines, filler and fiber) is defined as the ratio of the mass of the solids in the wet web leaving the wire section to that in the stock
F3C3,i = Ri F2C2,i (i = fiber, fines and filler)
[7]
The ash content of the web (Ash) leaving the wire section is:
Ash(%) =
F3C3, filler × 100 F3 (C3, fiber + C3, fines + C3, filler )
[8]
Assuming that there is not any loss of solids at the press and the drying sections, this can be used to represent the ash content of paper. The basis weight of paper (BW) is:
Fig. 2. Block diagram for the wet end of a paper machine.
10
BW ( g / m 2 ) =
F3 (C3, fiber + C3, fines + C3, filler ) ms ⋅ W ⋅ rs
Formation of paper is mainly affected by the crowding number (Ncrowd), the bridging strength (Sb) and the filler concentration in the wet end (11), assuming that the type of furnish and retention aids are chosen before papermaking, that the basis weight and the ash content of paper are decided for a given grade and that the shear in the headbox and on the wire section are optimized for a given grade and for a given paper machine. The filler in the headbox also affects fiber flocculation. Thus, formation can be modeled as a function of those parameters. An empirical model was developed to predict formation index (ROD) and to simulate the dynamics of formation.
[9]
where ms stands for the machine speed (m/min), W is the width of dry sheet after calendering (m) and rs is the shrinkage rate of the wet web, which is defined as:
rs =
width of dry sheet after calenderin g [ m ] [10] width of wet web before pressing [ m ]
It should be noted that the first-pass retention (Ri) was included in Eqs. [4] and [7]. First-pass retention is directly influenced by wet-end chemistry factors such as the type and the dosage of retention aids, pH, cationic demand, conductivity and the degree of refining. Hence, implementing thefirst-pass retention into the model makes it possible to relate the wet-end chemistry effect to the output variables such as the white water consistency and the paper ash content. The expression for first-pass retention can be developed by two approaches: a first-principles model and an empirical model. At this point no reliable theoretical model exists to predict first-pass retention from operating conditions. Thus, a simple, yet accurate way is still to perform a series of experiments and to obtain an empirical model for the first-pass retention. In this study, filler retention was measured and the empirical model was developed by nonlinear regression, which is expressed as a function of the mass flow of CPAM, bentonite, pulp and filler.
FI ( ROD) = a1Sb2 + a2 Sb + b1eb2 N crowd + cC filler + dSb N crowd + e
[12]
where ai, bi, c, d, and e (i = 1 and 2) are constants. The detailed models and discussions on calculating the crowding number and the bridging strength can be found elsewhere (11, 12).
3. Experimental The furnish onsisted of softwood bleached Kraft pulp. It was refined to a freeness of 360 mL CSF. The pH of the furnish was adjusted at 7.5 by adding sodium hydroxide to the stock chests. Precipitated calcium carbonate (PCC, 30% slurry, Albacar HO) was mixed with pulp at the blend chest (17% filler content in thick stock) for uniform mixing. A cationic poly (acrylamide) (CPAM, Allied colloids, Percol 292) of medium molecular weight (- 5 x 10⁶) and with a degree of substitution of 25% was used as received. CPAM was diluted to a concentration of 1.5 g/L. A commercial bentonite (Hydrocol O, Allied Colloids) was also used as received. The bentonite was dispersed at a concentration of 3 g/L. The CPAM solution was injected at the inlet of the pressure screen and the bentonite solution was added at the screen outlet. To investigate the effect of the process variables on
2 R filler = a1M pulp + b1C filler + c1M pol + c2 M pol + 2 d1M mp + d 2 M mp + g1M pulp M pol + g 2 M pulp M mp [11] + g3C filler M pol + g 4 M pol M mp + e
where Mpulp is the mass flow rate of pulp in the thick stock (g/min), Cfiller the filler addition (g of filler/g of pulp), Mpol the mass flow of polymer (g/min), Mmp the mass flow of microparticle (g/min), and a1, b1, ci, di, gi and e are constants. Since industrial paper machines are operated in narrow operating constraints, this simple approach can be a feasible solution to include the wet end chemistry effects.
11
펄프 종이기술
Consistency (g/L)
the dynamics of the wet end, step changes were applied to the CPAM dosage, the bentonite dosage, the fiber concentration, the initial filler concentration and the headbox flow rate. Only one variable was changed at a time. The dynamics of basis weight, ash content and formation were measured by on-line sensors (ABB) after calendering. The dynamics of headbox total and filler consistencies and white water total and filler consistencies were measured by Kajaani Rmi sensors. Typically, basis weight is automatically controlled by regulating the thick stock valve located after the machine chest, and moisture content by steam pressure of driers. The control system of the pilot paper machine is ACCURAY1190-ABB. However, in our experiments, the basis weight control loop was turned off.
(A) Headbox total consistency
9 7 5 3
(B) White water total consistency
Consistency (g/L)
0.5 0.4 0.3 0.2
(C) Basis weight
Basis weight 2 (g/m )
80 60 40
(D) Ash content
Ash content (%)
20 15
Formation index (ROD)
10 (E) Formation
2000 1500 1000
0
20
40
60 Time (min)
80
100
120
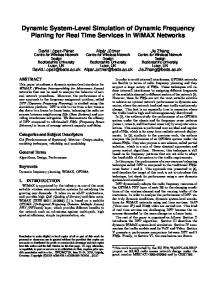
Fig. 3. Effects of dosages of retention aids on the dynamics of a paper machine At 0 min, CPAM = 0.2 mg/g and bentonite = 1 mg/g; at 25 min, CPAM = 0.2 mg/g and bentonite = 0 mg/g; at 56 min, CPAM = 0.35 mg/g and bentonite = 0 mg/g; at 89 min, CPAM = 0.35 mg/g and bentonite = 2 mg/g. The black line represents the simulated data and the gray line, the experimental data.
4. Results and Discussion The dynamics of the wet end and the dry end were simulated by solving the nonlinear models presented using the MATLAB/SIMULINK software. For the simulation, the first-pass retention of fiber was assumed to be unchanged by the perturbations: the value of 0.97 was used. Also, it was assumed that the first-pass retention values of fines and filler are identical (Rfines = Rfiller). Fig. 3 shows the effects of retention aids on the dynamics of the headbox and the white water total consistency and the basis weight, the ash content and the formation of paper. The changes in the white water consistency and the paper ash content were caused by the changes in the filler retention. When the first-pass retention of filler decreased, the white water consistency was increased and the paper ash content and the basis weight decreased, and vice versa. The magnitude of variations of the recirculated white water consistency is relatively smaller than the magnitude of noises of headbox consistency. Hence, small variations in the headbox total consistency were observed. The
changes in formation were caused by the changes in the bridging strength (11). Fig. 4 shows the effects of thick stock flow rate. When the thick stock flow rate was decreased, the headbox consistency decreased and hence the white water consistency and the basis weight of paper were decreased, and vice versa. Filler was mixed with pulp at the blend chest: i.e., the mass ratio of filler to pulp kept constant. Also, the variations in filler retention due to the changes in the mass flow rate of pulp were very small (13). Hence, the ash content of paper was observed to be almost constant. The changes in formation are due to the changes in the crowding number (11).
12
(A) Headbox total consistency
7 5 3
Consistency (g/L)
Consistency (g/L)
0.3
Basis weight 2 (g/m )
Basis weight (g/m2)
(B) White water total consistency
0.4 0.3 0.2
(C) Basis weight
80 60 40
(C) Basis weight
80 60 40
(D) Ash content
(D) Ash content
25 Ash content (%)
20 Ash content (%)
5
0.5
0.2
15 10
20 15
(E) Formation
2000
Formation index (ROD)
Formation index (ROD)
7
3 (B) White water total consistency
0.4
1500 1000 0
(A) Headbox total consistency
9 Consistency (g/L)
Consistency (g/L)
9
20
40
60
80
100
120
140
160
Time (min)
Fig. 4. Effects of the thick stock mass flow rate on the dynamics of a paper machine At 0 min, Thick stock mass flow rate (M1) = 1840 g/min; at 35 min, M1= 1580 g/min; at 90 min, M1 = 2100 g/min; and at 128 min, M1 = 1840 g/min. The black line represents the simulated data and the gray line, the experimental data.
(E) Formation
2000 1500 1000
0
10
20
30
40 50 Time (min)
60
70
80
Fig. 5. Effects of the filler addition on the dynamics of a paper machine At 0 min, filler addition (C filler) = 0.25 g/g; at 19 min, C filler = 0.30 g/g; and at 54 min, C filler = 0.20 g/g. The black line represents the simulated data and the gray line, the experimental data.
total consistency. Because of the sudden decrease of the headbox valve opening, the basis weight dropped sharply and recovered to its original value. Discrepancy is found between the experimental results of the basis weight and the simulated one (Fig. 6-(C)): the experimental results showed a high peak. This could be explained by a nonuniform mixing at the pipeline between the headbox and the headbox valve and at the headbox, while an ideal mixing was assumed in simulation. The filler addition was kept constant for this set of experiments, which resulted in constant ash content. The changes in formation of paper are due to the changes in headbox fiber consistency, which affect the crowding number. Some discrepancies are found in Fig. 3, 4, 5 and 6, but the experimental data and model predictions show relatively good agreement.
The effects of filler addition (g/g of pulp) on the dynamics of a paper machine are shown in Fig. 5 When the filler addition increased, the headbox total consistency, the white water total consistency, the basis weight and the ash content were increased and vice versa. When filler addition decreased at 54 min, formation index slightly increased. Fig. 6 shows the effects of the white water flow rate F5 on the dynamics of a paper machine.The recirculated white water flow rate was manipulated by changing the headbox flow valve (F2). When the headbox flow rate was decreased at 25 min, keeping the thick stock flow F1 constant, the recirculated white water flow F5 decreased. This resulted in the increase of the headbox total consistency and the white water
13
펄프 종이기술
Consistency (g/L)
simulated using the mathematical models describing the mass balances of solids in the paper machine coupled with empirical models of the first-pass retention and the paper formation.
(A) Headbox total consistency
10 8 6 4
(B) White water total consistency
Consistency (g/L)
0.4 0.3
Acknowledgement
0.2 (C) Basis weight
Basis weight (g/m2)
80
The authors wish to thank Dr. T.G.M. van de Ven for valuable discussions. Financial contributions from the Networks of Centres of Excellence (NSERC Canada) and PAR grant are kindly acknowledged.
60 40 (D) Ash content
Ash content (%)
20 15
Formation index (ROD)
10
Literature Cited
(E) Formation
2500 2000
1. Piirto, M. and Koivo, H., Advanced control of a paper machine wet end, Proc. IFAC Advanced Control of Chemical Processes, Toulouse, France, pp.47-52 (1991). 2. Rantala, T., Tarhonen, P., and Koivo, H. N., Retention modeling and control in the paper machine wet end, Proc. 12th IFAC World Congress, vol. 6, Sydney, Australia, pp.61-66 (1993). 3. Rantala, T., Tarhonen, P., and Koivo, H. N., Adaptive retention control in a paper machine, Pulp & Paper Canada, 95(8): T299-T302 (1994). 4. Isaksson, A., Hagberg, M., and Jönsson, L. E., Benchmarking for paper machine MD control: simulation results, Control Eng. Practice, 3(10): 1491-1498 (1995). 5. Piipponen, J. and Ritala, R., Basis weight and filler content: decoupled smith predictor approach, Control Eng. Practice, 3(10): 1463-1466 (1995). 6. St. Jacques, M., Computerized dynamic material balance of a paper machine wet end, Proc. Tappi Eng. Conf. Book 1, pp.97-110 (1982). 7. Miyanishi, T., Iida, K., and Iwatsu, T., Dynamic simulation for efficient paper machine grade change, Tappi J., 71(1): 49-56 (1988). 8. Syberg, O. and Wild, N.W., Introduction to Process Simulation, 2nd Edn., TAPPI Press, Atlanta, Georgia (1992). 9. Chen, S.-C., Modeling of paper machines for control: theory and practice, Pulp & Paper Canada, 96(1):
1500 1000
0
10
20
30
40
50
60
70
80
Time (min)
Fig. 6. Effects of the white water flow rate on the dynamics of a paper machine At 0 min, headbox flow rate (F2) = 340 L/min; at 25 min, F2 = 245 L/min; andat 57 min, F2 = 320 L/min. The black line represents the simulated data and the gray line, the experimental data.
5. Conclusions Dynamic models of a pilot paper machine for the retention process including headbox total and filler consistencies, white water total and filler consistencies, the basis weight and the ash content of paper were developed from first-principles (mass balances). To describe the wet end chemistry effect, first-pass retention was included in the model as a parameter dependent on operating conditions. In addition, an empirical model for formation was developed as a function of the crowding number, the bridging strength and the filler fraction in headbox stock and implemented into the dynamic simulation models. It was shown that the dynamics of retention and formation processes of a paper machine can be
14
289: 117-125 (2006). 12. Cho, B.-U., Dynamics and control of retention and formation on a paper machine using a microparticulate retention aid system, Ph.D. Thesis, McGill University, Canada (2005). 13. Cho, B.-U., Garnier, G., Paradis, J., and Perrier, M., Filler retention with a CPAM/bentonite retention system effect of collision efficiency, Nordic Pulp Paper Res. J., 16(3): 188-194 (2001).
T17-T21 (1995). 10. Cho, B.-U., Garnier, G., Paradis, J., and Perrier, M., The process dynamics of filler retention in paper using a CPAM/bentonite retention aid system, Canadian J. Chem. Eng., 79(6): 923-930 (2001). 11. Cho, B.-U., Garnier, G., van de Ven, T.G.M., and Perrier, M., A bridging model for the effects of a dual component flocculation system on the strength of fiber contacts in flocs of pulp fibers: implications for control of paper uniformity, Colloid and Surface A.,
15