International Journal of Human-Computer Studies This is “accepted” copy of the paper. The definitive copy of the paper can be downloaded from the ScienceDirect and located using the following DOI: http://dx.doi.org/10.1016/j.ijhcs.2015.01.010
Dynamic Text Presentation in Print Interpreting – an Eye Movement Study of Reading Behaviour Selina Sharmin*, Oleg Špakov, Kari-Jouko Räihä Tampere Unit for Computer–Human Interaction School of Information Sciences Kanslerinrinne 1 FI-33014 University of Tampere, Finland {firstname.lastname}@uta.fi *Corresponding author: Selina Sharmin (
[email protected]) Phone: +358 (0)50 318 6730 Fax: +358 (0)3 219 1001 Abstract: Print interpreting supports people with a hearing disability by giving them access to spoken language. In print interpreting, the interpreter types the spoken text in real time for the hard of hearing client to read. This results in dynamic text presentation. An eye movement study was conducted to compare two types of dynamic text presentation formats in print interpreting: letter-by-letter and word-by-word. Gaze path analysis with 20 hearing participants showed different types of reading behaviour during reading of two pieces of text in these two presentation formats. Our analysis revealed that the text presentation format has a significant effect on reading behaviour. Rereading and regressions occurred significantly more often with the word-by-word format than with the letter-by-letter format. We also found a significant difference between the number of regressions starting at the words that end a sentence and that of regressions starting at all other words. The frequency of rereading was significantly higher for incorrectly typed or abbreviated words than for the other words. Analysis of the post-test questionnaire found almost equal acceptance of the word-by-word and letter-by-letter formats by the participants. A follow-up study with 18 hard of hearing participants showed a similar trend in results. The findings of this study highlight the importance of developing print interpreting tools that allow the interpreter and the client to choose the options that best facilitate the communication. They also bring up the need to develop new eye movement metrics for analysing the reading of dynamic text, and provide first results on a new dynamic presentation context. Keywords: Dynamic text presentation, eye movements, regressions, reading, print interpreting 1 Introduction Print interpreting is a method for making spoken language available for people with a hearing disability. In print interpreting, the spoken utterances and other significant audible information are translated into print in real time simultaneously with the speech. The process is also called typing/writing interpreting, captioning, and real-time writing (Tiittula, 2009). The deaf can use other communication methods, such as sign language 1
or lip-reading, but these are virtually unknown among the hard of hearing and those with late deafness: they have acquired the language from hearing society and usually can speak. Therefore, sign language is not a suitable option for them; rather, they need interpretation that is as close as possible to the original speech. Print interpreting is widely used in seminars and meetings for the deaf and hard of hearing group of people. In print interpreting, spoken language is typed on a computer and the text is displayed either on another computer screen or on a projected bigger screen for a larger audience. The most common presentation format for the text on the display screen is the letter-by-letter format, where letters appear at the rate the text is written. In this dynamic text presentation system, the lines scroll up from the bottom. As soon as the screen is full, the top lines disappear and the new text appears from the bottom of the screen. Similarly, when a word is typed towards the right edge of the screen, if the screen width is exceeded before the word is complete, the characters already typed disappear from the current line and reappear on the next line. Thus the reader sees the text dynamically in real time. The letter-by-letter rendering of the text is the de facto standard used by professional print interpreters. However, reading text that appears letter-by-letter can be very different from the usual reading of static text where full sentences and paragraphs are in view. The print interpretation process demands that the text appears as soon as possible after the spoken utterance, so that those reading it can, e.g., understand the mimicry of the speaker and the reactions of the hearing audience. Nevertheless, buffering the text slightly so that it is rendered word-by-word, not letter-by-letter, would probably not have a significant effect on the real time requirement, and reading text presented in such manner would be somewhat closer to the normal reading experience. In addition, although errors in the final interpretation remain visible independently of the rendering method and may create distractions in the reading, the word-by-word presentation format has the advantage that it hides those typing errors that the print interpreter corrects on the fly before completing a word. This motivated us to create a tool, Sprintanium (Špakov, 2011), for studying the process of producing the interpretation and reading the resulting text. Of the many novel features included in Sprintanium, of particular relevance to this study is its ability to optionally produce the text letter-by-letter (the most common format) or one word at a time. Furthermore, it takes as input the real time keypress sequence of the print interpreter and can later render the text in either format at the original rate, allowing a comparative study involving several participants and different experimental conditions. How does one study the effect of the text and its presentation format on the reading process? Reading requires the visual processing of words, and therefore eye movements provide a window to the cognitive process of perception and comprehension that take place during reading. Eye movements reflect difficulties in understanding the document being read and can also be used to automatically recognize the quality of the text by integrating gaze data from several readers (Biedert et al., 2012).
2
Reading on-screen electronic text is one of the most widespread interactions between humans and computers. Several previous studies have analysed gaze behaviour in reading (Rayner, 1998). In reading, eyes make brief jumps along the line of the text. Rapid movement of eyes are called saccades. Stops in between the saccades are called fixations. Standard metrics in gaze data analysis are average number of fixations and average duration of fixations (Jacob and Karn, 2003). However, eyes do not move forward to read all the time. Often they also move backward for rereading. Saccades that move backward in the text that has previously been encountered by the reader are called regressions. Previous research has documented that regressions are an indicator of comprehension difficulties when reading static text (Rayner, 1998). Several studies have been conducted focusing on using dynamic text on small display screens of devices like wrist watches, mobile phones, pagers, and desktop phones (Chien and Chen, 2007; Laarni, 2002; Brewster and Murray, 2000). Many studies were conducted mostly to evaluate users’ comprehension rate with different text presentation formats; we give more details in Section 2. However, no formal study has compared different presentation formats in print interpreting, where the text appears dynamically, at the rate of spoken speech, on a computer screen or projected on the wall. Hence, we carried out an eye movement study where we compared eye movements in reading print interpreted text using two dynamic text presentation formats, word-by-word and letter-by-letter. Our study consists of two experiments. In the first experiment, presented in Section 3, we analysed eye movement data from 20 normal-hearing participants in reading two pieces of print interpreted dynamic text. The texts were presented on a computer screen with two presentation formats: word-by-word and letterby-letter. The goal of that experiment was to investigate the effect of text presentation format on eye movements and reading behaviour. Specifically, the interest was in finding out whether there are any differences in eye movements during reading that are due to differences in text presentation format. In addition to standard metrics, we examined rereading of the preceding words or sentences, and regressive eye movements during the pauses, during editing, or when an incorrect word is typed. For reasons discussed in Section 4, regressions proved to be a more useful metric than the traditional fixation and saccade related metrics. After the first experiment we carried out a follow-up experiment where 18 hard of hearing participants took part. In addition to the stimuli used in the earlier experiment, here we showed the video of the speakers without any sound. The follow-up esperiment is described in Section 5. What did we expect to find in the study? First, it is well known that people have different styles of reading static text (e.g., Wotschack, 2009), and there was no reason to assume otherwise for dynamic text. Similarly, it is known that end of sentence is a frequent trigger of rereading with static text (Hyönä, 1995), and we expected this to be the case with dynamic text as well. Moreover, because regressions are used to improve comprehension, we expected that incorrectly typed or abbreviated words would be reread more often than the other words. These considerations gave us our first three hypotheses: Hypothesis 1. People read dynamic text in different ways.
3
Hypothesis 2. More regressions start from the last words of sentences than from the other words. Hypothesis 3. Regressions land more often on incorrectly typed or abbreviated words than on the other words. The characteristic feature of dynamic text is that the pacing is not controlled by the reader. In print interpreting, in particular, there are many reasons why text does not appear at a regular pace, and it can be assumed that the pauses introduced between words that appear on the screen can have an effect on reading behaviour. Moreover, with the word-by-word presentation format the pauses are longer, so it can be expected that this shows up in the regression data. This yields the following two hypotheses. Hypothesis 4. The word-by-word format causes more rereading than the letter-by-letter format. Hypothesis 5. The length of the pause before a word appears affects the number of regressions starting from the preceding word. In general, all hypotheses were confirmed by our analysis. We will discuss the implications of the findings in Section 6. Results from the post-test questionnaire suggested almost equal preference for both presentation formats. The follow-up experiment showed a similar trend for the hard of hearing participants. Taken together, the results indicate that the word-by-word presentation format is a viable alternative to be used by print interpreters and should be supported by the tools available for them. For eye movement research the study pinpoints problems with the usual analysis methods, suggests an alternative, and provides the first results concerning reading the specific type of dynamic text that is encountered in print interpreting. 2 Background 2.1 Reading dynamic text In general, dynamic text – the presentation style used in print interpretation – comes in many forms. Common dynamic text presentation modes include scrolling, paging, leading, and RSVP (rapid serial visual presentation). In scrolling, the text is presented in the traditional form on a display area that may be larger than the screen. In vertical scrolling, text usually moves in a line-by-line manner. With paging also, the text is presented in the traditional form, but it is divided into pages that fit the screen area. In leading, the text is scrolled horizontally from right to left on a single line across the screen. Finally, in RSVP the text is presented successively in chunks of one or more words at a time in a fixed location on the screen at a predetermined rate. Scrolling, paging, leading, and RSVP have been evaluated thoroughly. For instance, Öquist and Lundin (2007) determined which text presentation format is best to use on a mobile phone. They did not find any significant differences in comprehension between formats, though RSVP was found to decrease eye movements significantly. Their results also showed that paging offered the greatest readability. In studying the most suitable dynamic text presentation method for different types of screens Laarni (2002) found that
4
scrolling was the fastest method when people read from display screens such as a laptop, a PDA and a business phone. He did find an optimal screen type for each presentation method. However, none of the above conditions match those used in print interpreting. A fundamental difference is that in print interpretation the pace of rendering the text is neither constant nor controlled by the reader. Instead, the variations in the speed of the speaker and the interpreter add a new and interesting aspect to the dynamicity. In print interpreting the screen, too, is larger than what has been used in previous studies of dynamic text presentation methods. Finally, in most of the dynamic text presentation formats (leading, scrolling, and RSVP), when text appears from one side of the screen, older text disappears from the other side. In print interpreting, the text fills the available space to the extent possible, and only then does older text start disappearing. This, too, creates more possibilities for regressions, since the previous text is available longer. Eye tracking, when applied to the study of reading, has generally been employed with reading of individual words, sentences, or pieces of text (cf. Rayner and Pollatsek, 1989; Radach et al., 2004). An eye movement study comparing different formats for presenting dynamic text (page-by-page, sentence-by-sentence, line-by-line, or in smaller pieces of text called chunks) revealed that differences in presentation format had a significant effect on various eye movement metrics, such as fixation duration, number of fixations, and number of regressions (Sharmin et al., 2012). Another study by Rahman and Muter (1999) compared three presentation methods: word-by-word, sentence-by-sentence, and a full page on a 15-inch display. Their results indicated that reading efficiency was better with the sentence-by-sentence condition than with the word-by-word condition. The full page format was on a par with the sentence-by-sentence format. Moreover, a study comparing another three text presentation methods: word-by-word, three-line, and 10-line formats showed significantly better reading comprehension with the word-by-word and 10-line formats than with the three-line format (Bernard et al., 2001). This is the only one of the studies that found a larger unit size (three lines at a time) to be inferior to a smaller unit size (word at a time), but even here word-by-word fared well. These results make one expect that the word-by-word format should have advantages compared to the letterby-letter format that uses a smaller unit size. The word-by-word format and letter-by-letter formats have not been compared in previous experiments for languages that use the Roman alphabet. However, for Chinese text Lin and Shieh (2006) found that on a single-line screen with leading, recall efficiency was significantly greater for the word-by-word format than for the characterby-character format. When examining the effects of the layout of the presentation method with single-line eight-character and word-by-word formats, they also found that the word-by-word format was significantly superior to the single-line eight-character format. In another study, for the small screen of a wrist watch, presentation method was a significant factor in improving reading comprehension of Chinese text (Chien and Chen, 2007). Reading comprehension was significantly better with the word-by-word format than with the character-by-character one. Both of these studies again point to the possible advantages of the word-by-word format, although the Chinese language is written and read so differently from languages using the Roman alphabet that the results cannot be expected to generalize as such.
5
2.2 Regressions and eye movements Rereading a sentence, phrase or passage is known as a regression. It is often the result of a lack of concentration during the first pass through the material. Regressions can also be the result of incomplete processing. Whenever the eye moves forward to word n before activation of word n – k (with k > 0) was fully removed (i.e. lexical processing was completed), a regression is likely to occur (Engbert and Kliegl, 2011, p. 795). Regressive eye movements can be a sensitive indicator of reading disruption. Eye movement patterns with atypical text formats were studied by Sanders and Stern (1980), who found that number of regressions is a better predictor of reading disruption than is reading speed. It is likely that many regressions are due to comprehension failures (Blanchard and Iran-Nejad, 1987; Ehrlich, 1983; Hyönä, 1995; Just and Carpenter, 1980; Vauras et al., 1992; Shebilske and Fisher, 1983). A word on the current line is a much more likely target of a regression than the words on previous lines (Duffy, 1992; Ehrlich and Rayner, 1983). When readers encountered a word indicating that their prior interpretation of the sentence was in error, they often made a regression as soon as they encountered disambiguating information (Frazier and Rayner, 1982). Dillon et al. (1990) found that splitting sentences across screens caused an increase in rereading of the text on the previous page. Splitting impedes the comprehension process because of the increased demand for working memory to hold the beginning of the current conceptual unit. We will base our analysis largely on regressions, so the above results are important for the theoretical foundation. Here again, however, the specific circumstances involved in print interpreting are such that the results cannot be assumed to hold without further investigation. The time pressure has the effect that the text produced by a print interpreter is often grammatically incorrect, has a disproportionate number of abbreviations and misspellings, and is sometimes incoherent if the interpreter falls behind in producing the text. These are all reasons why it can be expected that the number of regressions is higher than when reading static text. On the other hand, the fact that new text appears at an unpredictable rate gives more opportunities for regressions and they are not necessarily caused by similar comprehension difficulties as with static text. We will discuss this dichotomy further in Section 6. 3 Method 3.1 Participants In total, 24 native Finnish speaking participants took part in the experiment. Data from 20 participants were used for the analysis (four participants were rejected for the bad quality of the eye movement data). All participants had normal or corrected-to-normal vision. The average age of the participants was 28.4 years, with a standard deviation (SD) of 8.9 and an age range of 18–51 years. Seven of them were employed either at the university or in a company, with 1–20 years of working experience. Of the participants, 13 were university students, with various backgrounds, having computer science, environmental science, material science, English translation, biochemistry, information science, mathematics, and the German language as their degree subjects. Three of the student
6
participants were also employees. The participants used computers 5 hours per day, on average, with an SD of 2.1 hours and a range of 1–8 hours. 3.2 Apparatus We used a Tobii T60 remote eye-tracking device to track the users’ gaze on its integrated 17-inch TFT colour monitor (with 1280 x 1024 pixels’ resolution). The experiment was recorded with Tobii Studio. Sprintanium (Špakov, 2011) was used to prepare the stimulus. We collected the eye movement data with Tobii Eyetracking Analyzing Software Tobii Studio. It was also used for the observational analysis of the eye movements. 3.3 Design and procedure
Text1
Text2
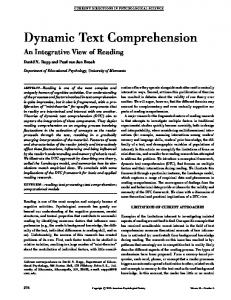
Figure 1: Two pieces of text, produced by two interpreters. Text contents were in Finnish. Two pieces of Finnish text were used in our experiment. These were produced by two interpreters, from different speeches given by two speakers. Videotaped speeches were projected on the wall in a room at the University of Tampere while a professional print interpreter transformed a spoken conference-like presentation into written format using Sprintanium (Špakov, 2011). Professional interpreters typed in their own typing style. The layout of the text produced by the interpreters is shown in Figure 1. These interpreters had very different styles; the first interpreter (who produced Text1) used lots of paragraph breaks and empty space, whereas Text2 (from the other interpreter) forms a continuous stream of text and does not even use capital letters. The experiment took place in a university gaze lab. In the introduction, the participants were verbally instructed in the test procedure and informed briefly about print interpreting. They were told that there would be a post-test questionnaire at the end of the experiment including some questions regarding the text. The motivation was to convince the participants to read the text attentively. Participants were also requested to move their head as little as possible while reading. The distance between the participant and the eye tracker was about 60 cm. The tracker was calibrated for each participant before recording of the eye movement data.
7
Each participant read two pieces of text (Figure 1), one after the other, one in each presentation format (letter-by-letter and word-by-word format) and one from each interpreter. In the letter-by-letter presentation format the text appeared at the rate it was typed by the interpreters while in the word-by-word format the text appeared as full words as soon as the interpreter pressed the space key or punctuation key. The order of the two pieces of text and the presentation formats were counterbalanced. Each piece of text was presented to the participants for about five minutes. At the end of the experiment, the post-test questionnaire was given to the participants. It consisted of background questions and questions regarding the text and presentation formats. The total duration of the experiment was about 40 minutes. 4 Analysis and results We carried out a careful observational analysis of the video recordings of eye movements to understand the reading process in the different cases. We analysed gaze data recordings for the first four and a half minutes for each of 20 participants reading each piece of text. In that time frame, neither piece of text required scrolling of the display. The total number of words in Text1 was 160, while the number was 186 for Text2. Our analysis included only 155 words from Text1. Five words were discarded because the algorithm that rendered text word-by-word was too simplistic. For instance, a number containing a full stop as the decimal separator appeared in two parts, resulting in abnormal reading behaviour. A survey was conducted among 11 professional print interpreters regarding the layouts used in our experiment (Figure 1). Seven respondents said that they follow the layout in Text1, whereas two interpreters used the layout in Text2. Neither of the two layouts was preferred by two interpreters. Most interpreters noted that they tune their style according to the client’s preferences. The layouts used in our experiment can be considered as extreme ends of the continuum. In addition, they are frequently used as such by the professionals. 4.1 Eye movement analysis method In reading, properties of the fixated words, such as word frequency and word length, influence their fixation duration (Liversedge et al., 2011). Prolonged fixations are usually taken to indicate more demanding cognitive processing. Our original goal was, therefore, to compare differences in average fixation duration between the two presentation formats, to find indications of differences in cognitive demands. However, this approach did not prove feasible, because of the nature of dynamic text. A typical velocity-based fixation algorithm considers two gaze points to belong to the same fixation if their distance is below a specified threshold value. In reading of static text, gaze jumps ahead in steps of typically 7–9 characters (Rayner, 1998). Then it is easy to distinguish fixations from each other. With dynamic text presented in the letter-by-letter format, however, the reading process is fundamentally different. Since the text appears little by little, the gaze follows the progress of letters appearing on the screen. Therefore, two consecutive data points produced by the eye tracker are seldom far from each other and it becomes impossible to distinguish the fixations from each other. One may even question whether reading is
8
based on typical fixations at all anymore in this case; it more closely resembles smooth pursuit of the emerging text (Räihä et al., 2011). The problem of using the standard metrics in connection of dynamic text was also noted by Kruger and Steyn (2013). Therefore they suggested that a new metric, reading index for dynamic texts, could be used. While the metric seems to suit well their research area, which is subtitling, it still is not suitable for our purposes: it assumes that gaze data can be reliably classified into fixations and saccades. This is why we adopted a different approach. The main quantitative metric used in this study is the number of regressions. This metric has been used in previous reading studies as well. Sanders and Stern (1980) used it to study the effects of text characteristics and Ashby et al. (2005) found it to reflect the reading proficiency of readers. For dynamic text, Specker (2008) used it as an additional metric to support the fixation-based analysis of eye movements in subtitles. Sharmin et al. (2012) studied several dynamic text presentation formats and found the results concerning regressions to be in line with those based on fixation duration and number of fixations. Since we analyzed raw gaze data and not fixations, we had to decide what to consider as a regression: eye trackers are typically noisy, and single gaze data points that deviate from the normal sequence cannot be taken into account. We settled on stipulating that 8 gaze points on a preceding word counts as a regression and rereading of the word. With a 60 Hz tracker this means that gaze stayed on the word for at least 135 ms, which is a reasonable threshold for eliminating chance glances and data anomalies. Our main interest and within-subjects independent variable was text presentation format: letter-by-letter (lbl) or word-by-word (wbw). Between-subjects independent variables were the order in which the texts were presented, and the order in which the participants saw text produced by each interpreter. The dependent variables were number of regressions starting from a given word and landing on a given word. 4.2 Eye movements and reading behaviour with different presentation formats In observation of the eye movements, different reading approaches among the participants were found. Occasionally, rereading a preceding word started when only one or a few letters had appeared in the current word. Gaze did not always return to where it started after rereading of preceding text. For some participants, the gaze often came back to the same position after rereading, and for others it landed on the next new word or letter that had appeared while the gaze was away. Thus regressions differ between participants. We also found variations in rereading tendencies among the participants. By carefully reviewing the eye movements in gaze path replays, it seemed that participants showed three different reading behaviours on the basis of fixation frequency and rereading as follows (see Figure 2): - almost no rereading, focus of the eyes just following the typing of the interpreter (Minor rereading);
9
-
moderate eye movements and frequent rereading of preceding words from the same line or from other lines (Moderate rereading); and extensive eye movements, a lot of rereading, rereading of almost every preceding word (Extensive rereading).
Minor rereading
Moderate rereading
Extensive rereading
Figure 2: Gaze paths of different reading styles for the same time frame. To justify our visual observation of three rereading styles, we used the k-means clustering algorithm (Lloyd, 1982) for the letter-by-letter and word-by-word formats separately. We experimented with k values 2, 3, 4 and 5. The algorithm got as input the percentage of reread words for each participant and condition. Table 1 shows characteristics of the clusters produced by the algorithm: the average distance between clusters (the difference between the maximum rereading percentage in one cluster and the minimum rereading percentage in the next cluster) and the average within-cluster standard deviation. Table 1: Reading style clusters formed with the k-means algorithm k lbl wbw avg distance avg SD avg distance 2 1.8 7.46 2.4 3 6.0 4.70 8.4 4 4.7 3.53 8.9 5 4.0 3.31 5.6
avg SD 9.09 4.77 3.42 3.11
10
Ideally we would like the clusters to have large distance between them and small withincluster standard deviation. We see that with k = 2 the clusters are inhomogeneous and close to each other. With k = 3 the clusters are well apart from each other and also reasonably homogeneous (have low internal standard deviation). For k = 4 the internal similarity would be even better, but this is largely due to one cluster consisting of just one participant. With k = 5 the distance between clusters is notably smaller than with k = 3. Thus k = 3 meets best our expectations for a clustering of the data, and matches our visual observations. We also experimented with the Mean Shift algorithm (Comaniciu and Meer, 2002), which confirmed the above conclusion. The exact number of clusters is of less importance than the fact that the participants do exhibit different reading behaviour, and that this can be confirmed by algorithmic means. Table 2 shows the total number of participants corresponding to each reading category and presentation format including the range and average percentage of reread words. Table 2: Different reading styles, with the associated presentation formats (lbl and wbw), number of participants, and percentage of reread words Presentation Reading style Number of Percentage of Average format participants reread words (range) Minor rereading 4 7.5–19.4 14.2 lbl Moderate rereading 12 24.5–36.2 31.2 Extensive rereading 4 43.0–55.5 48.8 wbw
Minor rereading Moderate rereading Extensive rereading
4 7 9
17.4–30.7 40.3–53.6 60.7–74.2
25.9 48.1 67
Out of 20 participants, 11 belonged to the same reading category in reading text with the word-by-word and letter-by-letter formats. Note that the ranges for the lbl and wbw categories are partly overlapping in Table 2. We did the clustering separately for the conditions, as participants’ rereading activity could change when the presentation format changed. Six participants’ reading strategy belonged to the Moderate category in reading with the letter-by-letter format, while with the word-by-word format they belonged to the Extensive category. 4.3 Rereading and regressions in different presentation formats In the previous subsection we found that participants had different reading strategies. In this section we report results from several statistical analyses on rereading for the two presentation formats. We take into account two independent between-subject factors, interpreter sequence (which text was shown first) and presentation format sequence (which presentation format was used first). The dependent variables are mentioned for each statistical test.
11
To begin with, results of three-way mixed-model ANOVA suggest that the percentage of reread words differs significantly between the word-by-word and letter-by-letter presentation formats (F1,16 = 35.53, p < .001). Participants reread significantly more in reading with the word-by-word presentation format than with the letter-by-letter format. The average percentage of reread words was 52.1 (SD 16.55) for the word-by-word format and 31.3 (SD 11.94) for the letter-by-letter format. The between-subject factors interpreter sequence and presentation format sequence did not have any significant effect on the dependent variable. Moreover, there was no significant interaction between the independent variables.
Figure 3: Percentage of reread words for each presentation format, by participant. The bars in Figure 3 show the percentage of reread words for each participant in the word-by-word and letter-by-letter formats. Here we have numbered the participants so that participants 1–9 were those who preferred the word-by-word presentation format and participants 10–20 were those who preferred the letter-by-letter format at the end of the experiment. With the exception of participants 1 and 13, all reread preceding words significantly more while reading text in the word-by-word format than in the letter-byletter format. Perhaps a stronger indication of cognitive activity than just the share of reread words is the percentage of words reread more than once. Here a similar trend was observed. The percentage of words reread more than once was higher in the word-by-word format than in the letter-by-letter format for most of the participants. The average percentage of words reread more than once was 22.7 (SD 12.89) for the word-by-word format and 9.4 (SD 6.69) for the letter-by-letter format. According to three-way mixed-model ANOVA the difference was statistically significant with p < .001 and F1,16 = 19.299. Betweensubject factors interpreter sequence and presentation format sequence did not have a significant effect on the dependent variable. In addition, no significant interaction was observed between the variables.
12
As a continuation of our scrutiny, analysis with three-way mixed-model ANOVA showed that the percentage of words from which the gaze started a regression was significantly affected by different presentation formats (F1,16 = 50.275 and p < .001). The percentage of such words was significantly higher for the word-by-word format (on average 24.5% of the words (SD 7.43)) than for the letter-by-letter format (13.3% of the words (SD 5.31)). Although the effect of between-subject factors was insignificant over the dependent variable, interaction between the two between-subject factors was statistically significant with p < .05, F1,16 = 6.467. To understand what caused the interaction, we produced Table 3 which shows the effect of the first stimulus on the reading behavior. Table 3. Percentage of words from which rereading started in the lbl and wbw conditions based on which of the stimuli the participants saw first (SD in parenthesis). First stimulus Text1, lbl Text2, lbl Text1, wbw Text2, wbw lbl 25.7 (4.11) 18.1 (6.70) 27.0 (8.15) 24.5 (7.40) wbw 15.0 (4.11) 8.6 (4.70) 11.8 (2.77) 13.3 (5.3) From Table 3 it is evident that if participants were first exposed to the condition where they saw Text2 in the letter-by-letter presentation format, this affected their reading behavior, in that they were less likely to embark on regressions than in the other cases. This is understandable, as Text2 is dense in space and the lbl format is similarly dense in time, but it is interesting that this had an effect that carried over into the second stimulus. In addition to the percentages of reread words and words reread more than once, we analysed the average regression length in words. We define regression length as the average number of words reread per regression. For the word-by-word presentation format it was very close to that for the letter-by-letter presentation format. The numbers were 1.9 and 1.8 reread words, respectively. For most participants, the regression lengths were similar for the two presentation formats and the difference between the formats was not statistically significant. Hence participants were likely to read onscreen dynamic text with similar regression length independently of the presentation format. Moreover, the between-subject factors neither had any significant effect on the dependent variable nor was there any significant interaction between the factors. 4.4 Effect of pauses on reading Rereading occurs because of the natural behaviour of participants reading to comprehend the meaning of the text. Sometimes rereading or regressions may be increased because of a longer pause or lack of new text available on the screen. In the word-by-word presentation format, the pause between two successive words appearing on the screen includes the time to type the word and waiting time between previous and current word. However, in the letter-by-letter presentation format, only the second of these elements, that is the pause between two consecutive words, is experienced by the participants. Otherwise, text appears on the screen in a continuous mode.
13
During presentation of dynamic print interpreted text on the computer screen, pauses may be caused by several factors, such as these: - The speaker pausing, - The interpreter’s failure to follow the speaker, - The interpreter’s need to summarise the speech in some particular cases before typing, - Mistakes and editing, and - Natural slowing to type longer words. While reading, the reader does not know what is causing a pause. The pauses can get longer for any or several of the above reasons. One can experience pauses due to mistakes and typing of longer words in the word-by-word format, though these are not visible in letter-by-letter presentation.
Text1 in word-by-word format
14
12 no. of regressions
no. of regressions
12 10 8 6 4
10 8 6 4 2
2
0
0 0
1000 2000 3000 4000 pauses betw een w ords
5000
0
6000
Text2 in word-by-word format
14
1000
2000 3000 4000 5000 pauses betw een w ords
6000
Text2 in letter-by-letter format
14
12
12 no. of regressions
10 no. of regressions
Text1 in letter-by-letter format
14
8 6 4 2
10 8 6 4 2
0 0
1000 2000 3000 4000 pauses betw een w ords
5000
6000
0 0
1000
2000 3000 4000 5000 pauses betw een w ords
6000
Figure 4: Frequency distribution of regressions started during pauses with length of pause (in ms) on the x-axes. Viewing the eye movement video for individuals revealed varying behaviour during pauses. Participants reread preceding words, just stared at the last letter or word, or mixed the two actions during pauses. Sometimes the gaze was directed at the empty area where the new text was expected. We analysed the number of regressions during pauses (Figure
14
4) for the two pieces of text (Text1 and Text2). Distributions of regressions are plotted separately for each presentation format and interpreter. One outlier was omitted for each format for Text1. Figure 4 shows a concentration of data points in the lower left corner of each graph. This means both that the number of regressions is higher when there is a long pause, and that there are not that many regressions if text appears fairly continuously. More formally, the length of a pause between two successive words is positively correlated with the number of regressions starting at the preceding word. The correlation is significant with level 0.01 (two-tailed). The Pearson correlation coefficient was 0.648 for the word-by-word format and 0.699 for the letter-by-letter format. Moreover, comparing the two presentation formats, we found that the number of regressions during pauses between the words was significantly higher in the word-by-word presentation format than in the letterby-letter format for both texts (Figure 4). Test statistics values for paired samples t-test were t = 5.868, df = 153, and t = 7.92, df = 185, respectively, with p < .001 in both cases. It is illustrative to look at the causes of pauses and their effects at the level of individual words. Figures 5 and 6 show excerpts from the two texts: Figure 5 from Text1 and Figure 6 from Text2. There are 40 words in each figure, which means 26% of Text1 and 22% of Text2. These excerpts were chosen so that they illustrate the effect of all the key elements: pauses, long words, abbreviations, spelling errors, and end of sentence. The upper parts of Figures 5 and 6 present the breakdown of typing duration. Words from the text are positioned on the x-axes. Light colour bars represent the duration of typing of a word, in milliseconds, while dark colour bars show the time between two successive words: the current word and the next word. The average time for typing a word was 854.6 ms for Text1 by the first interpreter and 931.1 ms for Text2 by the second interpreter, and the average time interval between words was 648.5 ms for Text1 and 424.8 ms for Text2. The words surrounded by rectangles indicate abbreviations or typing errors. A vertical line through the graphs indicates end of sentence. The lower parts of the figures show the frequency of regressions starting from each word. The light colour portion of each bar shows the number of regressions that started during letter-by-letter presentation while the dark colour portion shows the equivalent for wordby-word presentation. This graphical representation of regressions and pauses indicates that rereading occurred most often at the end of a sentence. The kind of detailed analysis illustrated in Figures 5 and 6 is important for finding the reasons for increased regressions. For instance, in Figure 5 the ninth word from the left (“hormi”) is incorrect and therefore boxed. It is followed by three x’s, a common way for print interpreters to indicate that the preceding word was incorrect and readers should ignore it. This is often faster than backspacing through the incorrect word. The three x’s are then followed by the word that should have been typed in the first place (“hormoni”). From the lower graph in the same figure we see that this correction procedure caused readers to regress more than usual. The two other boxed words, “MPM” and “tiet.”, are abbreviations. The first is a medical term and an official abbreviation, whereas the latter
15
is just shorthand for this sentence. The next word is typed soon after “tiet.” and it is also the last word of the sentence, so in this case the causes for the regressions can be manifold. In Figure 6 the last boxed word, “oli.”, is interesting: the full stop denotes the end of sentence, but it was pressed in error or too early. The next word, “pahimpia.”, is the one that actually ends the sentence. Inspecting the lower graph shows that the period after “oli” has sent many readers to reread preceding text. This is no wonder, as the sentence does not make sense without the last word. Such observations illustrate to the print interpreting professionals the concrete consequences of the errors in their text and can point to spots that need special care. The figures also highlight the effect of long words, particularly in the word-by-word format. For instance, in Figure 6 the third word of the second sentence, “tavanomaista”, takes a long time (more than 2 seconds) to type. Before the word appears on the screen, participants in the word-by-word condition are left with the previous word, “kuvailee”. The bottom graph in Figure 6 shows that 5 out of 10 participants started a regression from that word. Similar, though less extreme, behaviour can be seen with the last two words in Figure 6. From visual inspection of the full texts using the techniques shown in Figures 5 and 6 our attention is drawn to the effect of abbreviations, spelling errors, and end of sentence. We will next analyse their effect formally.
Figure 5: Distribution of typing duration, with the corresponding frequency of number of regression starting from each word (Text1).
16
Figure 6: Distribution of typing duration, with the corresponding frequency of number of regression starting from each word (Text2). Figure 7 shows how many regressions were started in different cases. For instance, for the leftmost bar in Figure 7: there were 14 words that ended a sentence in Text1. From those words participants started between 6 to 24 regressions, i.e., the participant with the most regressions started a regression almost twice from every end-of-sentence word. On average there were 13.5 regressions, and the bar shows the share 13.5/14 = 96.4%. Three-way mixed-model ANOVA found that both in word-by-word and letter-by-letter presentation formats the average percentage of regressions from the words that end a sentence was significantly higher than the corresponding figure for the other words. The test statistics values were F1,16 = 119.619 and F1,16 = 219.817, respectively, with p < .001 in both cases. The between-subject factors did not have any significant interactions in the word-by-word presentation format, but significant interaction was found for the letter-byletter format with p < .001, F1,16 = 47.447.
17
Figure 7: The average percentage of regressions (per participant) starting from words that end a sentence compared to that of regressions from other words, with standard error of the mean bars. We also found that the incorrectly typed or abbreviated words in the text were reread more often than the rest of the words. Three-way mixed-model ANOVA indicated that rereading strategies differ significantly for incorrectly typed or abbreviated words compared to the rest of the words in both word-by-word (F1,16 = 16.633) and letter-byletter (F1,16 = 17.066) presentation formats with p < .01 in both cases (see Figure 8).
18
Figure 8: Average percentage of rereading incorrect or abbreviated words as compared to other words, with standard error of the mean bars. 4.5 Participants’ preference for particular presentation formats The post-test questionnaire contained short questions based on the text. The motivation was to check that the participants had read the text carefully as instructed. The questions were not designed to be a comprehension test, and there was also not enough data to draw conclusions about the relationship between presentation format and comprehension. The main goal of the post-test questionnaire was to gather opinions from the participants on the text presentation formats. There were five claims to rate on a five-point scale (‘fully agree’, ‘agree somewhat’, ‘neutral’, ‘disagree somewhat’, ‘fully disagree’). The claims are presented in Table 4. Claim 5 used ratings from ‘too slow’ to ‘too fast’. Table 4: Claims for rating by the participants 1 Concentration I had to concentrate a lot for being able to read the text. 2 Understanding The presentation format did not affect understanding the meaning. 3 Stress The test was stressing. 4 Readability The text was much easier to read in this format. 5 Pace While reading, how did the pace feel in the different cases?
19
Figure 9: Bar charts representing the responses to the claims in Table 4. Some observations can be made on the basis of the opinions collected from the post-test questionnaire (see Figure 9). First, there was almost no difference in experienced understandability of the text in the two formats (claim 2). Second, text presented in the letter-by-letter format required less concentration (claim 1) and was easier to read (claim 4) than text presented in the word-by-word format. Participants also found the word-byword format more stressful than the letter-by-letter format (claim 3). Finally, participants found both formats slow for their reading speed, with the word-by-word presentation experienced as extremely slow (claim 5). It is likely that the experience of stress with the word-by-word format is linked to the very slow speed experienced. We also asked the participants which presentation format they would choose for their own use. It was interesting that almost equal preference was shown for the two formats. Out of 20 participants, nine preferred the word-by-word format and 11 preferred the letter-by-letter format. Eight participants preferred the presentation layout of Text2 and the other 12 preferred the layout of Text1. The Pearson correlation coefficient between the preferred text presentation format and corresponding layout of the text by the interpreters was 0.082 (not statistically significant). Thus we can see that, though the interpreters had different styles, the preferred presentation formats cannot be attributed to this difference.
20
5 Follow-up study with hard of hearing participants The first experiment was carried out in an eye tracking laboratory using participants with normal hearing. In our second experiment we used hard of hearing participants. In addition, the experiment was carried out in a normal meeting room, where we tried to create an atmosphere that resembled better the typical print interpreting context. Silent videos of the speakers were displayed on another screen placed next to the screen with emerging print interpreted text. Thus participants could follow the facial expressions of the speaker if they desired. We used the same textual stimulus as in the first experiment. Eighteen participants took part in the follow-up experiment. We were only able to get good eye movement data from ten participants for the analysis. Rest of the data was rejected because of technical and physical problems with calibration. This was to be expected, as it is known that tracking elderly people is more complex than tracking younger participants, like those in our first test (Spooner et al., 1980). The average age of the participants was 62.1 years (SD 9.98). 5.1 Rereading and regressions with hard of hearing participants The results obtained in the second experiment were comparable to those in our first experiment. Here, too, participants reread more in reading with the word-by-word presentation format than with the letter-by-letter format. The average number of words reread was 47.92 and 41.33, respectively. Again, the number of regressions that started from the words that end a sentence was significantly higher than the number of regressions that started from the other words both for the word-by-word (t = 2.283, df = 9, and p < .05) and letter-by-letter (t = 4.581, df = 9, and p < .01) presentation formats. Hence, participants were more likely to reread at the end of the sentences (see Figure 10). Moreover, the difference was significant for Text1 with t = 4.495, df = 9, and p < .01, although for Text2 the difference was only close to significant (t = 2.179, df = 9, and p = .057) (Figure 10).
21
Figure 10: Percentage of regression start from the words that end a sentence vs. regressions from the other words with standard error of the mean bars. These findings are in line with those from our first experiment: both normal-hearing participants and hard of hearing participants reread more from the words ending a sentence. However, comparing Figures 7 and 10 we notice that the difference is less pronounced with the hard of hearing participants. Significant difference was also found between rereading incorrect or abbreviated words compared to the other words in the text. Incorrect or abbreviated words were reread more than the other words in reading with the letter-by-letter presentation format (t = 2.646, df = 9, and p < .05). Although a similar trend was observed in the word-by-word presentation format, the difference was not statistically significant. 5.2 Speakers’ appearance and different presentation formats The hard of hearing participants had the silent video of the speaker available on an adjacent monitor. This allowed them to follow the speaker in addition to the interpreted text, much like in a typical situation. The participants showed different tendencies in following the speaker. Four participants did not look at the speaker at all with either presentation format, or just glanced at the video very briefly. Of the remaining six participants, four looked at the video more in the letter-by-letter presentation format and two viewed it more in the word-by-word format. The average number of gaze moves to the speaker during reading with the letter-by-letter presentation format by all participants was 8.8, which was very close to the value of 9 for the word-by-word presentation format.
22
Although the word-by-word format provides longer pauses than the letter-by-letter format, which may allow readers to move their eyes more, in the current experiment the participants looked at the speaker almost equally long: 29.6 s with the letter-by-letter presentation format and 27.7 s with the word-by-word format. Even though reading with the word-by-word presentation format provided longer waiting time, participants neither moved their gaze to the speaker significantly more nor spent a longer time looking at the speaker than in the letter-by-letter presentation format. Rather, participants utilized their time in rereading previous text. 5.3 Participants’ preference for particular presentation formats We used the same claims in the follow-up experiment as in the previous experiment (Table 4 in Section 4.5). Out of 10 participants five preferred the letter-by-letter presentation format and four preferred the word-by-word format. One participant stopped the test and did not give his opinion. Several participants indicated that the reason to prefer the letter-by-letter presentation format was because of its familiarity; existing software tools available for print interpreting produce text in the letter-by-letter format. In this light it is actually surprising that the word-by-word format fared so well. When comparing the opinions provided by normal-hearing and hard of hearing participants, some interesting similarities and difference emerged. First, the need for concentration and stressfulness were rated similarly by both groups. The hard of hearing participants rated the word-by-word format higher in readability, contrary to the hearing participants who had preferred the letter-by-letter format. Most surprisingly, when the hearing participants had experienced the word-by-word presentation as far too slow, the hard of hearing participants found the pace too fast. We will discuss these findings more in the next section. 6 Discussion We started our analysis by investigating our first hypothesis that people read dynamic text in different ways. This was confirmed first by observing their individual gaze paths and then by applying clustering algorithms on the gaze data. Clustering, as the rest of our analysis, was based on the frequency of regressions back to text that had appeared before the current target of reading. Analysis of the participants’ eye movements identified three categories of reading behaviour, on the basis of differences in the number of regressions. The categories were Minor rereading, Moderate rereading and Extensive rereading. Eleven of the 20 participants belonged to the same category in reading the text with the word-by-word and letter-by-letter formats. The rest changed their reading strategy when the presentation mode changed. Six participants belonged to the Moderate rereading category in reading with the letter-by-letter format but moved to the Extensive rereading category in reading with the word-by-word format. We then drilled down on the causes of the regressions. Of particular interest to us was the performance of the word-by-word presentation format, since it is a novelty that is not yet supported by commercial print interpreting tools. We hypothesized (hypothesis 4) that
23
there would be more rereading with the word-by-word format than with the letter-byletter format. As already indicated by the above observation on change of reading strategy, the hypothesis was confirmed. Three-way mixed-model ANOVA showed that the percentage of reread words was significantly higher with the word-by-word presentation format than with the letter-by-letter format. Further support for the hypothesis was found by analysing the share of words reread more than once, which was significantly higher in the word-by-word format than in the letter-by-letter format for most of the participants. Finally, the number of words from which the gaze started a regression was also significantly higher for the word-by-word presentation format than for the letter-by-letter format. A fundamental difference between the word-by-word format and letter-by-letter format stems from the different pace at which new text appears. In the letter-by-letter format there is a fairly steady rhythm that follows the typing speed of the interpreter. With the word-by-word format new factors, especially the length of words, come into play. From previous studies on reading static text we already know that there can be pauses in reading even when new text would be available. For instance, the longest fixation durations and pauses (in normal progress) have been found in reading content words, infrequent words, and thematically important words (Just and Carpenter, 1980). Moreover, relatively longer pauses were made at sentence boundaries, whereas additional pauses were observed within sentences at major and minor clause boundaries (Rahman and Muter, 1999; Castelhano and Muter, 2001). Looking at the eye movements in our study revealed different gaze behaviour during pauses. The number of regressions during pauses between the words was significantly higher in the word-by-word presentation format than in the letter-by-letter format. A significant positive correlation was found between the length of the pause between two successive words and the number of regressions starting at the preceding word. This supports our fifth hypothesis that the pause before a word appears affects the number of regressions starting from the preceding word. In addition to the dynamicity of the presentation, the textual content is another factor that affects reading. Considering first the starting points of regressions, there was a statistically significant difference between the number of regressions starting from the words that end a sentence and that of regressions starting from all other words in the text, confirming our hypothesis 2. This can be for two reasons: the natural pause when the interpreter starts interpreting a new sentence, and the reader’s desire to make sure that the meaning of the preceding sentence was understood. Finally, hypothesis 3 on the landing points of regressions was also supported by our data. We found that the frequency of rereading of incorrect or abbreviated words was significantly higher than the frequency of rereading the rest of the words. In the post-test questionnaire, the participants rated the two presentation formats almost equally in terms of the understandability of the text. However, the letter-by-letter format was rated as requiring less concentration, less stressful, and easier to read. This sounds as bad news for the word-by-word format, but the free-form comments by the participants
24
shed some light on this. The positive comments on the letter-by-letter format seem to have been caused by the mechanical act of reading, not on reading for comprehension. One participant commented: “Reading text that appeared word-by-word felt surprisingly bumpy; letter-by-letter felt rather fluent, almost as if I had typed the text myself based on what I had heard.” Another participant continued: “I would rather read text that appears letter-by-letter, which might be due to my better concentration on the reading; however, I remember better what I read when the text appeared more slowly word-by-word that loosened the grip on the gaze.” These two participants preferred the letter-by-letter format. A comment by a participant that preferred the word-by-word format ends in a similar observation: “It was more tiring to read text that appeared letter-by-letter, since it was much more difficult to keep in mind the context of the words.” Thus, all these comments point to the fact that it was easy to feel that one was reading and making progress with the letter-by-letter format, but it did not necessarily lead to a good understanding of the text. This makes it understandable that when asked which format the participants would have chosen for themselves, the opinions were almost equally split between the two alternatives. There is some past research that brings up similar observations. Granaas et al. (1984) found that static presentation resulted in a significantly better reading comprehension than a leading dynamic format did. Experimenting with different leading formats, they observed that text appearing one or two characters at a time produced poorer reading comprehension than text appearing from four to ten characters at a time. This is very similar to letter-by-letter and word-by-word presentation formats. Cognitive demands with the letter-by-letter format may be similar to those with the leading format. The word-by-word format, by contrast, entails more time between the words appearing on the screen, and readers can use this time to reread the previous words to improve comprehension. Similarly, for Chinese text recall efficiency was significantly greater for the word-by-word format than for the character-by-character format (Lin and Shieh, 2006). Our findings are in line with these results. With static text, regressions have been linked to the need to reread ambiguous words or sentences (Rayner, 1998). The discussion above indicates that with dynamic text this may not be the case: regressions can be beneficial for comprehension also when there is no ambiguity in the text. It is illustrative to review the rereading behaviour shown in Figure 3. Participants 1 to 9 who in the end preferred the word-by-word format used in the letterby-letter condition an almost equal number of regressions as those participants (10 to 20) who preferred the letter-by-letter format: the averages for the letter-by-letter condition were 35.4 and 34.4 regressions, respectively. The difference comes from the frequency of regressions in the word-by-word format: those preferring that format made more use of it (54.7 regressions on average) than those preferring the letter-by-letter format (44.5 regressions on average). When regressions took place, they were similar in both presentation conditions: for instance, average regression length (number of words reread per regression) was similar with both presentation formats. Thus it seems that it was the increased number of regressions that was linked to increased preference for the word-byword format. Interestingly, the interaction effect discussed in Section 4.3 indicates that
25
this advantage was only obtained when the participants did not start with a condition that encouraged them to keep their eyes stationary. One may also ask if the regressions really reflect reading behaviour, or whether they are simply the consequence of more spare time for the eyes to wonder in the text (Vitu et al., 1995; Rayner and Fischer, 1996). First, we controlled this by demanding at least eight gaze points to land on a word before a regression was recorded. Second, analysis of the word classes of reread words (Sharmin and Wiklund, 2014) shows a distribution that strongly resembles the distribution in normal reading: content words (nouns, verbs, and adjectives) are reread much more often than their share of the text. For instance, the first or the second landing point of a regression is a noun in 74% of the cases, but only 30% of all words in the texts are nouns. This is a strong indication that the landing points of regressions were not random. Our first experiment was carried out with hearing participants. More important than their ability to hear (since there was no audio in the experiment) was the fact that they were all novices to print interpreting. We therefore arranged a follow-up experiment with hard of hearing participants. We were able to collect data from a smaller group than in the first experiment. Nevertheless, the results confirmed our earlier findings. The second experiment differed from the first one in that a silent video of the speaker was displayed on an adjacent monitor, resembling a real-life print interpreting setup. It turned out that this did not affect the findings. Participants viewed the video relatively little even when the word-by-word format provided more opportunities for it. The viewing time was very similar for both formats. Again, findings from the post-test questionnaire suggested almost equal preference of both presentation formats. Some participants indicated that the reason to prefer the letterby-letter presentation format was because of its familiarity: most of the software tools available for print interpreting today render text in the letter-by-letter format. In this light the word-by-word format was received surprisingly well. The main difference to the results from the first experiment was that the participants now considered the pace with the word-by-word as too fast. This, too, may be because the format was unfamiliar to them. 7 Conclusions Today’s de facto standard in print interpreting is production of dynamic text on the screen letter-by-letter as it is typed. Sprintanium makes it possible to buffer the rendering of dynamic text such that it appears word-by-word. We wanted to find out the effect of this alternative presentation format on the reading process and users’ opinions concerning it. An eye movement study of print interpreting was carried out to gather information on how people read dynamic text in the print interpreting context. From a practical point of view, our main conclusion is the importance of providing print interpreters with more versatile tools. A significant portion of their customers would prefer a different presentation style than the current de facto standard. There are
26
indications that the word-by-word presentation style can improve comprehension, especially after customers become familiar with it. Another message to the print interpreting profession is to bring up, in addition to the speed of interpretation, the importance of correctly typed full words, as abbreviations and spelling errors impede the reading process. Methodologically our main contribution is the discussion of the problems in using standard eye movement metrics and the possibilities of using an alternative metric. Clearly, this is a topic that needs further attention from the eye tracking community. New metrics have already been proposed for analyzing the reading of dynamic text, but they need to be further developed to cope with the level of dynamicity (letter-by-letter) in print interpreting and other dynamic presentation formats. Finally, from the point of view of understanding eye movements, the paper shows the difference in reading behaviour between two dynamic presentation formats. Further studies need to dig deeper into this theme to understand the phenomenon better and to contrast reading dynamic text and static text in a controlled study. Also in the print interpreting context there are more conditions left for further study. For instance, our experiment used stimuli where the speeches were shorter than five minutes, and thus the entire interpretation could fit on the screen. The effects of new text always appearing at the bottom of the screen and old text disappearing from the text need another experiment. Acknowledgements This work was supported by the SpeechText project, part of the MOTIVE programme of the Academy of Finland. We thank the participants for their time and Sirpa Laurén for making the hard of hearing participants available. We also thank project partners Liisa Tiittula, Mari Wiklund, Anukaisa Alanen, and Maija Tanhuamäki for their comments. References Ashby, J., Rayner, K., Clifton Jr., C., 2005, Eye movements of highly skilled and average readers: Differential effects of frequency and predictability. The Quarterly Journal of Experimental Psychology 58A (6), 1065–1086. Bernard, M.L., Chaparro, B.S., Russell, M., 2001. Examining automatic text presentation for small screens. In: Proceedings of the Human Factors and Ergonomics Society 45th Annual Meeting, Minneapolis, pp. 637–639. Biedert, R., Dengel, A., Elshamy, M., Buscher, G., 2012. Towards robust gaze-based objective quality measures for text. In: Proceedings of the Symposium on Eye Tracking Research and Applications. ACM, New York, pp. 201–204. Blanchard, H.E., Iran-Nejad, A., 1987. Comprehension processes and eye movement patterns in the reading of surprise-ending stories. Discourse Processes 10, 127–138. Brewster, S., Murray, R., 2000. Presenting dynamic information on mobile computers. Personal Technologies 4, 219–222. Castelhano, M.S., Muter, P., 2001. Optimizing the reading of electronic text using rapid serial visual presentation. Behaviour and Information Technology 20(4), 237–247.
27
Chien, Y.-H, Chen, C.-H., 2007. The use of dynamic display to improve reading comprehension for the small screen of a wrist watch. In: Proceedings of the 2007 Conference on Human Interface, Part I. Springer, Berlin/Heidelberg, pp. 814–823. Comaniciu, D., Meer, P., 2002. Mean shift: A robust approach toward feature space analysis. IEEE Transactions on Pattern Analysis and Machine Intelligence 24(5), 603–619. Dillon, A., Richardson, J., McKnight, C., 1990. The effect of display size and text splitting on reading lengthy text from screen. Behaviour and Information Technology 9, 215–227. Duffy, S. A., 1992. Eye movements and complex comprehension processes. In: Rayner, K. (Ed.), Eye Movements and Visual Cognition: Scene Perception and Reading. Springer, New York, pp. 462–471. Ehrlich, K., 1983. Eye movements in pronoun assignment: A study of sentence integration. In: Rayner, K. (Ed.), Eye Movements in Reading: Perceptual and Language Processes. Academic Press, New York, pp. 253–268. Ehrlich, K., Rayner, K., 1983. Pronoun assignment and semantic integration during reading: Eye movements and immediacy of processing. Journal of Verbal Learning and Verbal Behavior 22, 75–87. Engbert, R., Kliegl, R. 2011. Parallel graded attention models of reading. In: Liversedge, S.P., Gilchrist, L.D., Everling, S. (Eds.), The Oxford Handbook of Eye Movements, Chapter 43. Oxford University Press Inc., New York, pp. 787–800. Granaas, M.M., McKay, T.D., Laham, R.D., Hurt, L.D., Juola, J.F., 1984. Reading moving text on a CRT screen. Human Factors 26, 97–104. Hyönä, J., 1995. An eye movement analysis of topic-shift effect during repeated reading. Journal of Experimental Psychology: Learning, Memory, and Cognition 21(5), 1365–1373. Jacob, R.J.K., Karn, K.S., 2003. Eye tracking in human–computer interaction and usability research: Ready to deliver the promises. In: Hyönä, J., Radach, R., Deubel, H. (Eds), The Mind’s Eye: Cognitive and Applied Aspects of Eye Movement Research. Elsevier, Amsterdam, pp. 573–605. Just, M.A., Carpenter, P.A., 1980. A theory of reading: From eye fixations to comprehension. Psychological Review 87(4), 329–354. Kruger, J.-L., Steyn, F., 2013. Subtitles and eye tracking: reading and performance. Reading Research Quarterly 49(1), 105–120. Laarni, J., 2002. Searching for optimal methods of presenting dynamic text on different types of screens. In: Proceedings of the Second Nordic Conference on Human–Computer Interaction. ACM, New York, pp. 219–222. Lin, Y.-C., Shieh, K.-K., 2006. Reading a dynamic presentation of Chinese text on a single-line display. Displays 27, 145–152. Liversedge, S.P., Gilchrist, L.D., Everling, S. (Eds.), 2011. The Oxford Handbook of Eye Movements. Oxford University Press Inc., New York. Lloyd, S.P., 1982. Least squares quantization in PCM. IEEE Transaction in Information Theory IT-28(2), 129–137. Öquist, G., Lundin, K., 2007. Eye movement study of reading text on a mobile phone using paging, scrolling, leading, and RSVP. In: Proceedings of the 6th International Conference on Mobile and Ubiquitous Multimedia. ACM, New York, 176–183.
28
Radach, R., Kennedy, A., Rayner, K., 2004. Eye Movements and Information Processing during Reading. Psychology Press, Hove, UK. Rahman, T., Muter, P., 1999. Designing an interface to optimize reading with small display windows. Human Factors 41(1), 106–117. Räihä, K.-J., Ovaska, S., Sharmin, S., 2011. Dynamic text and eye movements – challenges of tracking and analysis. Journal of Eye Movement Research 4(3), 129. http://www.jemr.org/online/4/3/1 Rayner, K., 1998. Eye movements in reading and information processing: 20 years of research. Psychological Bulletin 124, 372–422. Rayner, K., Fischer, M.H., 1996. Mindless reading revisited: Eye movements during reading and scanning are different. Perception & Psychophysics 58, 734–747. Rayner, K., Pollatsek, A., 1989. The Psychology of Reading. Prentice Hall, Englewood Cliffs, California. Sanders, D.S., Stern, J.A., 1980. Effects of text variables on eye movements in reading. Integrative Psychological and Behavioral Science 15, 30–34. Sharmin, S., Špakov, O., Räihä, K.-J., 2012. The effect of different text presentation formats on eye movement metrics in reading. Journal of Eye Movement Research 5(3):3, 1–9. http://www.jemr.org/online/5/3/3 Sharmin, S., Wiklund, M., 2014. Gaze behaviour and linguistic processing of dynamic text in print interpreting. In: Proceedings of the Symposium on Eye Tracking Research and Applications. ACM, New York, in print. Shebilske, W.L., Fisher, D.E., 1983. Eye movements and context effects during reading of extended discourse. In: Rayner, K. (Ed.), Eye Movements in Reading: Perceptual and Language Processes. Academic Press, New York, pp. 153–179. Špakov, O., 2011. Sprintanium: A tool for print interpreting. Submitted for publication. Software URL: http://www.cs.uta.fi/speechtext/links.php Specker, E.A., 2008. L1/L2 Eye Movement Reading of Closed Captioning: A Multimodal Analysis of Multimodal Use. Ph.D. Thesis, University of Arizona. Spooner, J.W., Sakala, S.M., Baloh, R.W., 1980. Effect of aging on eye tracking. JAMA Neurology 37(9), 575–576. Tiittula, L., 2009. SpeechText: Research on print interpreting. At: 2nd International Seminar on Real-Time Intralingual Subtitling. Universitat Autonoma de Barcelona. Vauras, M., Hyönä, J., Niemi, E., 1992. Comprehending coherent and incoherent texts: Evidence from eye movement patterns and recall performance. Journal of Research in Reading 15, 39– 54. Vitu, E., O’Regan, J.K., Inhoff, A.W., Topolski, R., 1995. Mindless reading: Eye movement characteristics are similar in scanning letter strings and reading text. Perception & Psychophysics 57, 352–364. Wotschack, C. 2009. Eye Movements in Reading Strategies: How Reading Strategies Modulate Effects of Distributed Processing and Oculomotor Control. Ph.D. Thesis, University of Potsdam, Spektrum Patholinguistik – Schriften 1.
29
Selina Sharmin has been working as a researcher in Visual Interaction Research Group in TAUCHI (Tampere Unit for Computer-Human Interaction) at the University of Tampere. Her area of interest is to study human gaze behaviour and analyse eye movement data. She got her Bachelor of Science and Master of Science in Statistics from the University of Dhaka, Bangladesh in 1998 and 2000 respectively. She also obtained her Master of Science in Interactive Technology at the University of Tampere in 2004. Currently she is pursuing her postgraduate studies in Human Gaze Behaviour in Reading at the University of Tampere. Dr. Oleg Špakov is a member of the interaction by gaze community. The development of applications with gaze used as the only or additional input modality, and studying and improving various object selection methods used in gaze-controlled interface is his main interest. He received his Ph.D. degree from University of Tampere in 2008, and the dissertation was focused on studying various aspect of visualization of gaze data. Currently he is a post-doc researcher at the University of Tampere and developing a ‘native’ gaze-contingent interface. Kari-Jouko Räihä obtained his Ph.D. in Computer Science at the University of Helsinki in 1982. Since 1985 he has been a full professor of computer science at the University of Tampere. He has done research in applied eye tracking for more than 15 years. His primary interest is using eye gaze for computer control, both for users with motor impairments, and also in the context of attentive interfaces.
30