Dynamic visualization in advanced undergraduate courses MATTHIAS KAWSKI* Department of Mathematics and Statistics, Arizona State University This article presents and discusses selected uses of interactive dynamic visualization tools, such as the JAVA Vector Field Analyzer II in advanced undergraduate and beginning graduate courses, foremost advanced courses in differential equation and dynamical systems. Keywords: Dynamic visualization, Lyapunov, Poincare-Bendixson.
1 Introduction The advent of inexpensive computing technology has dramatically changed the way many mathematicians do mathematics, and the way many students and teachers learn and teach mathematics. This is an ongoing revolution, and no end is in sight. Among the many different ways that computing technology may be employed in mathematics, one of the most intriguing ones is for interactive and dynamic visualization. It started in the 1980s when then first personal computers became available, with such visionary work as e.g. [1]. The technical revolution continues at an ever faster pace. Nowadays one needs little more than a JAVAenabled WWW-browser and an internet connection to do truly exciting mathematics. And we still are looking forward to many possibilities that currently we only dream about—such as instant computations and rendering in 3D. The author's dream is an instant computation of curvature and geodesic spheres for control and subRiemannian geometry, manipulating theses instantaneously by dragging the mouse. The technology has invaded classrooms in different areas and levels at very different rates, for reasons that we may only speculate about—but this is not the place to do so. Likely the late secondary and introductory post-secondary level are among the leaders with topics such as parameterized families of functions in precalculus, calculus, and the first course differential equations. Both at the earlier and the later stages we seem to see comparatively less use of computing technology for interactive visualization. Similarly, there have been many formal studies about the benefits of such technology and the utility of visual images for developing concepts primarily at these same levels centred about calculus, but also some others, including at the postcalculus levels—we only refer to the recent study [2]. One common issue that severely restricted the use of such technology was the, real or perceived, start-up costs. Computer algebra systems and similar packages are widely perceived as demanding very high start-up costs. These include both the learning of syntax and the actual launching of the program. A notable opposite is the well-known Famous Curves Applet [3] which requires virtually no preparation, yet invites almost limitless experimentation. In our context of an advanced course in Differential Equations, we mainly rely on the similar JAVA applet Vector Field Analyzer II (VFA2) [4]. It is based on an earlier program [5] that simply tried to allow experimentation in response to the question [6]:
*
Email:
[email protected] 91
“If zooming is so much better (than disappearing secant lines) for understanding derivatives in calculus I, why not zoom in on vector fields to see and understand the curl and the divergence?” This applet also includes additional functionality to visually connect vector calculus and differential equations. The key is to experiment with the flow of a vector field (or differential equation) acting on a solid region (as opposed to just plotting integral curves for initial conditions specified as discrete set of points.) There are many similar dynamic visualization packages available for differential equations and dynamical systems, compare e.g. the extensive suite of the ODE Architect [7] or the many resources at the Dynamical Systems and Technology Project at Boston University [8]. We like the VFA2 for its instantaneous start-up and trivial syntax, while inviting new kinds of experiments far beyond the original design. There does not exist a comprehensive write-up of suggested experiments and uses of this tool at the level of vector calculus and the first course in differential equations, but many users around the world have found their ways of employing it. This article and presentation is focused on unanticipated uses in higher level courses, foremost the advanced undergraduate or graduate level theoretical courses on qualitative studies of differential equations. We also have used the tool very effectively in powerful ways in graduate level courses in complex analysis (no surprise, given the ideas in [9]), differential geometry and control theory. Such higher level courses usually have very densely packed syllabi of theoretical material, and high expectations on the students' prior knowledge. Thus it is no surprise that many an instructor does not believe that it is possible to squeeze in some computer work. However, we found that with the extremely quick start-up we routinely use the VFA2 now also in many graduate courses, as each demo or experiment only takes a minute or two, or even less, yet imparts such powerful images that many students indeed did not bring with them, but which are the foundation for many modern theories, compare e.g. [10]. Typically, we employ the tools as a backdrop for a class discussion, often to perform experiments suggested by students. This usually takes much less time than a minute. Where available, we also have used the tool in small group settings where each table of students has its own computer. Moreover, students use the tool routinely at home for quick explorations and cross-checking. Distinctively different from common uses of e.g. computer algebra systems or graphing calculators in calculus classrooms, our experiments are never scripted. Instead, the tools are used instantaneously when a mathematical question comes up which is such that the students want to take a closer look. 2 Existence of periodic orbits in one dimension Our first example is from the first chapter of the textbook [11], which is a modernized version of the classic [12]. It takes into account the influences of three decades of technology on the modern study of differential equations. In its modern style it immediately sets the stage for the topics to be studied later in the course, and for the character of the modern approach. Here we consider the logistic differential equation subject to periodic harvesting y ′ = ay (1 − y ) − h ⋅ (1 + sin 2 (2πx))
This example follows a first foray into the world of bifurcation theory. More specifically, if e.g. a = 1 , then the logistic model with constant rate h of harvesting y ′ = ay (1 − y ) − h will have two distinct positive equilibrium solutions if 0 ≤ h ≤ 14 corresponding to sustainable
92
harvesting. These coalesce into a single one at h =
1 4
. If
h>
1 4
then every solution that
starts with a positive initial population faces extinction in a finite time. Most students have seen the logistic model without harvesting in their first course in differential equations. Already for the case of constant harvesting y ′ = ay (1 − y ) − h it is quite challenging to obtain closed form solution formulas. Even computer algebra systems such as MAPLE require quite sophisticated tweaking before they yield all solutions (on both side of the bifurcation). Indeed, this example beautifully coaxes the students towards more graphic arguments and qualitative studies. The next question, which really is a lead-in into Poincare-Bendixson theory studied at the end of the course, asks whether the equilibria persist as periodic orbits if the harvesting are and oscillations are small. The teacher's objective is to encourage topological ways of thinking. However, the author's students had very little experience thinking graphically.
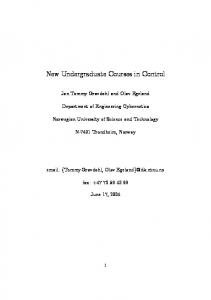
Figure 1. Existence of periodic orbits for logistic growth with periodic harvesting
Starting up the VFA2 is instantaneous, enter the formula for the differential equations, press plot, and scatter some initial conditions with the mouse. The only advanced feature is to turn on the cylindrical model for a state-space which is the natural home for periodic vector fields. This means that as solutions leave on the right edge they come back on the left. One or two minutes of experimenting with different initial conditions led most everyone in the class to have a strategy in mind on how to prove the existence of at least two distinct periodic solutions, compare the static screenshot shown in figure 1. Given just this little help with the VFA2, a few minutes only, these students basically discovered the concept of a Poincare map on their own. Still having almost the whole class period available, it was now very easy and fast to develop the theory in detail.
93
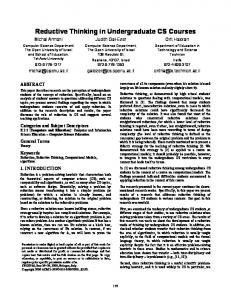
Figure 2. Poincare Bendixson theory
3 Poincare Bendixson theory
At the end of the semester, our senior and first graduate level course in differential course studies the existence or lack of periodic orbits for planar systems. The main tool is the Poincare Bendixson theorem, compare e.g. [13]. Theorem 3.1. Suppose that D ⊆ R 2 is open and connected, f : D a R 2 is locally Lipschitz continuous. Suppose C is a bounded positive semi-orbit of y ′ = f ( y ) with positive limit
set L+ . If L+ contains no equilibrium point, then it is a periodic orbit. While the technical statement is quite intimidating, its message is extremely intuitive from a graphical point of view. Unfortunately, the majority of the students in the author's class did not have well developed graphical reasoning skills and were hesitant to use even the little they had. Again we found that it took just one or two minutes to start up the VFA2 and provide some stunning and compelling dynamic images that clearly demonstrate what this theorem says, and how it is typically employed. Figure 2 shows a screen shot for the following example taken from [13, p.309] x ′ = y , y ′ = − x + y − 2( x + 2 y ) y 2
We found that after students could play, modify, and experiment so effortlessly with various systems on the VFA2, they found it easier to systematically work the usual exercises, to proceed strategically, establishing the invariance of some bounded region (usually
94
topologically an annulus) that does not contain any equilibria. Moreover, the visual experiences did not only have helped with the acceptance of the theorem, its application, but also with the understanding of the outline of the proof which is an indispensable item on the syllabus. 4 Absence of periodic orbits: Bendixson Dulac criterion
The Poincare Bendixson theorem is routinely used to establish the existence of periodic orbits. Complementary to it is the Bendixson Dulac criterion which is used to establish the absence of periodic orbits, compare e.g. [14]. Theorem 4.1. Suppose that Ω ⊆ R 2 is simply connected bounded open domain, f : Ω a R 2 and β : Ω a R are continuously differentiable. If div( β f ) does not change sign in Ω and is not identically zero on any open set, then the system y ′ = f ( y ) has no periodic solution lying entirely in Ω .
Figure 3. Two graphical views of divergence
Again, for a graphically thinking person this is completely intuitive, and the picture actually provides a feasible strategy for a simple proof, using Green's theorem in the plane. In a nutshell, if C is a periodic orbit, then the vector field f must be tangent to C at all points on C. Consequently the flux of f across C is zero. Hence, by the divergence form of Green's theorem, the integral of the divergence of f over the bounded region inside C is also zero. This establishes the contrapositive of the theorem. The function β changes the lengths of the arrows, leaving the argument intact. For students who learned their vector calculus in a graphic way similar to the development in [15] which in turn follows the classic physics text [16], both of which motivated the VFA2, this is a very translucent argument. Figure 3 shows two different screen-shots providing the zooming and the flux integral point of view. However, the large majority of our students have much weaker mental graphical images of divergence. Our test case was the vector field f ( x, y ) =
(
3 2
y
)
− 2x , 3 whose divergence div f ( x, y ) = − 16 < 0 is
constant negative.
95
Figure 4. Misconceptions about (positive) divergence
The graphical image of the vector field, with overlaid solution curves of the system ( x&, y& ) = f ( x, y ) , compare figure 4, nicely shows that (in this region) all solution curves go away from each other. Indeed, in the author's class last year, more than 20 advanced undergraduate and beginning graduate students, many with very good credentials unanimously agreed that this vector field must have positive divergence (in the region shown on the screen). This is not at all unexpected misunderstanding.
Figure 5. Misconceptions about (positive) divergence
What we did differently was to use the VFA2 for a minute to dynamically visually set the record straight. Indeed divergence does NOT measure whether solution curves go away from 96
each other (a concept more related to stability, and of primary importance in numerical computations), but instead divergence measures the infinitesimal rate of expansion (rate of change of area)—one of the primary objectives for the VFA2. Unfortunately in this paper version, figure 5 can show only two suggestive screen shots and again have to appeal to the imagination of the reader. All students immediately grasped what was happening when confronted with the dynamic version: The vector field is such that solution curves go away from each other, but they slow down even more. Consequently, a rectangle (aligned with the coordinate axes) of initial conditions stretches vertically but becomes squished even faster horizontally. This results in a net decrease in volume/area.
5 Lyapunov stability, invariant regions, and Lasalle's theorem Elementary stability theory relies on two basic pillars: The more algebraic approach analyzes the spectrum (set of eigenvalues) of the linearized system about an equilibrium point. The much more graphic direct method of Lyapunov abstracts the concept of passivity and an energy function that is nonincreasing along trajectories. A simple version of the main theorem is:
Theorem 5.1. Suppose f : R n a R n and V : R n a R are continuously differentiable. f (0) = 0 and V (0) = 0 , V is proper and positive definite and the directional derivative L g V = grad V , f is negative definite. Then the origin is a locally asymptotically stable
equilibrium of y ′ = f ( y ) . Figure 6 shows pictorially the main ideas, and, in particular, demonstrates the importance that V be proper (i.e. preimages of compact sets are compact), as otherwise V might be decreasing along solution curves, yet these still run away (as depicted in the slowly increasing trench). This artfully crafted image has its own story: the key to a nice and useful picture is to have asymptotically linear growth, not the expected quadratic growth of typical convex functions. But this is a static image, and it did not help much with the large majority of our students who were weak both in their fragmented understanding of positive definiteness and of invariant subsets.
Figure 6. Pictorially: The importance of being proper
97
Again some playful experiments with the VFA2 made all the difference. In particular, we used the visual representation of the flux across a curve to study the invariance of the bounded region inside that curve. In turn, positive definiteness and properness went along with connected, simply connected and bounded sublevel sets, and hence with level sets that are simple closed curves. It turned out to be quite fortunate that the VFA2 only allows to study one curve at a time (on the line integral panel) as this focuses the students' attention. Studying an image that simultaneously shows many level curves is simply too demanding. Of unexpected utility was the feature of the VFA2 that allows one to translate, resize or reshape the curves for line integrals—and thus explore other candidates for level curves of Lyapunov functions. (Mathematically, homogeneity with respect to some general group of dilations often leads to the general argument.) The VFA2 was even helpful when trying to go one step further, to Lasalle's invariance principle. This relaxes the requirement that the orbital derivative L f V of V along solution curves be strictly negative definite to negative semidefinite. In turn it requires that the largest f-invariant subset contained in the preimage L f V −1 (0) be the origin itself. In this case the
(
)
same conclusion holds. Figure 7 shows one poor (when compared to dynamic experiments) static screenshot of investigation of V ( x, y ) = x 2 + y 2 as a candidate Lyapunov function for a viscously damped pendulum x ′′ + sin x = β x ′ . This illustrates that L f V ( x,0) = 0