computed through a free-knot smoothing spline estimation, where the generic pro- ..... to wave rupture and on the shape of water profile at breaking point.
Dynamical classification of functional data with free knots spline estimation Elvira Romano1 , Rosanna Verde2 and Yves Lechevallier3 1
2
3
Dipartimento di Matematica e Statistica, Universit´ a degli Studi di Napoli, Italy, Dipartimento di Studi Europei e Mediterranei, Seconda Universit´ a di Napoli, Italy, INRIA Rocquencourt, Le Chesnay Cedex, France,
Abstract. In this paper we address the problem of clustering a set of functional data. Given a collection of n curves corrupted by noise, we wish simultaneously to estimate and classify them through a generalization of the dynamical clustering algorithm (Diday (1971)). For this purpose we consider a clustering procedure based on the best fitting between the representative function of the cluster and the allocation function of the curve to the different clusters. According to Verde et al. (2001) we propose to represent the clusters by prototypes which are ’mean curves’ computed through a free-knot smoothing spline estimation, where the generic prototype of a cluster is carried out by optimizing a non linear problem. Such solution takes into account a dimensionality and a smoothness constraint of the functions prototype. An application of the proposed procedure has been performed in hydro-geology science context.
1
Introduction
Nowadays, in many real application data came to us through processes naturally described as complex data. One type of the complex data is functional data, where data themselves are represented as functions. An ample review of the Functional Data Analysis methodologies (FDA) is developed by Ramsey and Silverman (2003). The FDA approach is inherently non-parametric, as it lets ’the data speak for themselves’ by avoiding parametric assumptions. While multivariate data analysis (MDA) is concerned with data in the form of random vectors, functional data goes a step further, focusing on data that are infinite dimensional such as curves shapes. Such data arrive with additional challenge that require more attention than ordinary data. The challenge is with respect to the creation of functional observations, since functional data are usually obtained by recovering the continuous functional object from the discrete observed data, usually called raw data, via data-smoothing. Thus even if in pratice we have discrete observations, the functional framework allows to take into account the continuous
2
Romano, Verde and Lechevallier
nature of the data. Since about twenty years, this type of data meets more and more frequently with the automation and the computerization of the measure procedures. Consequently, the literature dedicated to the survey of functional data developed considerably. The last few years have witnessed important new developments in both the theory and practice of functional classification and clustering. Nonparametric curves classification techniques have been proved useful for analyzing such functional data, and the literature is growing at a fast pace: Hastie, Buja and Tibshirani (1995) set out the general idea of Functional Discriminant Analysis, they make use of a roughness penalty approach to regularization; Hall, Poskitt and Presnell (2001) proposes a nonparametric procedure for signal discrimination in which dimension reduction is obtained using the Karhunen-Love expansion of covariance function, and then a new observation is assigned to the signal type with the highest posterior probability calculated from use of kernel methods; Ferraty and Vieu (2001) propose to estimate non parametrically the posterior probability of an incoming curve in a given class; James and Hastie (2001) generalize linear discriminant analysis to functional data that include a low dimensional graphical summary of the data and classification of new curves; whereas Rossi and Villa (2005) investigate the use of Support Vector Machines in the context of FDA. The other exploratory developed tools include curve clustering, in this context James and Hastie (2003) employ the functional clustering model, producing low-dimensional representations of sample curves via parameterization of cluster means. All these methodologies utilize regularization and filtering approaches or a mixture of the two . Specific aspects of the two different approaches, to overcome the infinite dimensional problem in the clustering and classification methods were highlighted in recent papers of G. M. James and Sugar (2003) and James and Hastie (2001) that incorporates the best properties of the regularization and filtering methods while avoiding their most serious drawbacks when individual curves are sparsely sampled. According the authors, the regularization and filtering approach can work well when every curve has been observed over the same fine grid of points, and break down if the individual curves are sparsely sampled . This allows them to introduce a general approach respectively to clustering functional and classify functional data that incorporate the best proprities of regularization and filtering approach. As the filtering approach the infinite dimensional problem is converted into a finite dimensional one using basis function. However contrary to the usual techniques, where the basis coefficients are utilized as parameters and each individual is fitted by separate spline, they use a random effect models. The proposed method produces automatically the weights of the estimated coefficients according to their variances and it’s higly efficient because few parameters must be estimated. While these and other methods
Dynamical classification of functional data
3
present plausible approaches to classify functional data, none of these techniques take into account the more salient features of the functions in the curves themselves during the clustering. In our view, polinomial smoothing has limited appeal due to the global nature of its fit, while in contrast a free knot spline smoothing have an explicit local nature. Our propose considers clusters that are not determined fitting each individual sequence of observations by a curve with fixed knots because this lead to an error in general much bigger. Each prototype is unequivocally determinated by a non linear minimization problem, due to the non linear dependence of the basis functions on the knots. The notion of extracting meaningful information from a prototypical B-spline function is related to the aim of taking into account an optimal number of clusters by collecting all the curves that capture the maximum information in the data. The article falls into four main parts. Section 1 is the introduction. In Section 2, we present the classification methodology and we explain the representation step and the optimization problem for the function prototype. Section 3 provides a description of the classification algorithm. Finally the methodology of the paper is illustrated by its application to a set of sea waves data in section 4.
2
The procedure description
Let Ω be a set of n functions such that each function y i is given by the (tij , yji )1≤j≤mi list of mi pairs, with tij ∈ V , a compact subset of Rp , to R, and yji ∈ R. Then exist regular function f i (in L2 (V )) such that yji = f i (tij ) + ǫij , where ǫij is an observation noise. In this model the functions f i are not know and in general a common solution in clustering of functional data is to construct an approximation of the (f i )1≤i≤n and to work on this approximation (cfr. Abraham et al., 2003). On the contrary, rather of working with the approximated function f˜i in the subspace, we use the initial information to estimate the curves prototype of each cluster as an expansion of basis functions with free knots. A free knot spline is a spline where the knot locations are considered parameters to be estimated from the data. It means a non parametric estimate of a mean curve that allows to take into account the similar slope changes of all the curves. The representation of the information depends on the location and the number of the knots. Choosing a set of knots, is a more controversial issue since the same set of knots is not universally good. So we propose to use an iterative procedure that simultaneously computes a free-knot spline estimators of the prototypes of the clusters and is able to classify the functions in homogeneous classes. As in a generic clustering algorithm the problem is to find a partition C = {C1 , . . . , CK } C ∈ Cs of Ω in K clusters and a set of functions prototype (models) G = {g1 , . . . , gk } G ∈ Gl such that a
4
Romano, Verde and Lechevallier
partitioning criterion ∆ is minimized: b G) b = min {∆(C, G)/C ∈ Cs , G ∈ Gl } ∆(C,
(1)
In our context the criterion is defined as following ∆(C, G) =
K X X
µk δ 2 (yji , gk ) Ck ∈ C, gk ∈ G
(2)
k=1 i∈Ck
where µk = |C1k | is a weight, δ 2 (yji , gk ) = yji − gk 2 is the L2 distance and the system of G = {g1 , . . . , gk } G ∈ Gl of class are computed by P prototype 2 i optimizing an adequacy criterion φ(g) = i∈Ck δ (yj , gk ) that leads to a free-knot spline estimators functions prototype. � of the mean k ∀k ∈ K be a vector of knot sequence, More precisely, let τ k = τ1k , . . . , τH we look for a good approximation for the function gk (τ k ) in Sr,H (τ k ), the space of polynomial spline order r ≥ 1 with knot sequence τ k ∈ ℜH defined by: H X Bl,r,τ k (τ k )αlk (3) gk (αk , τ k ) = l=1
where Bl,r,τ k denote the usual B-spline basis function of order r with a sequence τ k of knots and αk are the sequence of B-spline coefficients such that the following criterion is minimized: φ(g) =
X
i∈Ck
i
δ
2
(yji , gk )
=
m XX
i∈Ck j=1
yji
−
H X l=1
!2
Bl,r,τ k (t)αlk )
(4)
According the optimized criterion, starting from equispaced knots we obtain for each cluster a local model prototype identified from the best sets of knots. Each curves is assigned to a class according its proximity to the prototype in the sense of mean square error. The algorithm precedes like classical dynamical clustering by alternating representation and allocation step. 2.1
The representation step and the optimization problem for the function prototype
In the representation step, the algorithm computes for each cluster Ck the prototype which minimize the adequacy criterion (4). To solve this problem the idea is inspired by the method used in Gervini to estimate the mean and variance components of a set of curves. The mentioned approach uses the Jupp transformation of the knots Jupp (1978) that ameliorates lethargy and removes the redundancy in the knot vector. This transformation is related to the various log-ratio transformation described in Aitchinson (1986). Let ζ k = J(τ k ) the Jupp transformation of the vector of knots τ k ∈ [a, b]
Dynamical classification of functional data τk
5
−τ k
defined as: ζi = log τ ki+1 −τik for i = {1, . . . , H} τ0k = a and τ k H+1 = b.Let H+1
0
consider B(ζ k ) the matrix of the Bspline transformation of the observations, of size mi × (r + H) whose row j is the vector of the B-spline functions. Using this transformation the criterion (4) can be written as φ(g) =
X
i
δ
2
(yji , gk )αkl ,ζ k
m XX
=
yji
−
i∈Ck j=1
i∈C
H X
Bl,r,τ k (ζ
k
)αlk
l=1
!2
(5)
where the best approximation of gk by the least squares is obtained by solving the following minimum problem i
(ˆ α , ζˆk ) = min k
(αk ,ζ k )
′
m X j=1
yji
−
H X
Bl,r,τ k (ζ
k
)αlk
l=1
!2
(6)
′
with gˆk = β (τ k )ˆ αk , and β is the vector of B-spline functions. k For fixed ζ the optimal αk is o−1 n T T Bl,r,τ k (ζ k ) y α ˆ k = Bl,r,τ k (ζ k ) Bl,r,τ k (ζ k )
(7)
in this way ζˆk is the solution of the following optimum problem i
min
(ζ k ∈ℜn+r )
m X j=1
yji
−
H X l=1
n
o−1 T Bl,r,τ k (ζ k ) y Bl,r,τ k (ζ ) Bl,r,τ k (ζ ) Bl,r,τ k (ζ ) k
k T
k
!2
(8) Since the dependence of the basis functions from the knots is nonlinear, this is a nonlinear minimization problem. The solution to this problem is given from a modification of an alternating least squares algorithm proposed by Gervini. The algorithm produces a sequences of vectors τˆk and ζˆk , among these we choose the minimizers of the Generalized Cross Validation Criteria (GCV).
3
The dynamical clustering algorithm for functional data with free knots spline estimation of the function prototype
The algorithm carries out the following steps: 1. Initialization step where it is chosen a random partition C = {C1 , . . . , Ck } ∈ Cs of Ω in k clusters. 2. Representation step where each discrete realization of a sample of curves i for k = 1 to K is used to determinate the optimal prototype gk∗ which minimizes the criterion (8).
6
Romano, Verde and Lechevallier
3. Allocation step where a new partition is done by reassigning each curve i to the closest prototype gk∗ according to the euclidean distance; stepwise algorithm test ← 0 For i = 1, . . . , n do define the cluster Ck∗ such that k ∗ = arg mink=l,...,K δ(yji , gk ) if i ∈ Ck and k ∗ 6= k test ← 1 Ck∗ ← Ck∗ ∪ {i} Ck ← Ck / {i} 4. Convergence step if test ← 0 END else go to Representation step.
4
Functional classification of sea waves breaking by several submerged obstacles
An application of the dynamical algorithm is here shown in the context of hydro-geology science. It has been performed on the wave profiles, coming from an experimental investigation conducted at the Department of Hydraulic and Environmental Engineering ”Girolamo Ippolito”, University of Napoli Federico II. This study aims to detect a feature of wave profile that has been mostly overlooked : the wave profile evolution in propagation and, at the same time, to research typologies of wave profiles: waves prototype. Submerged breakwaters for coastal protection are meeting a growing general consent among engineers, authorities and people, as they seem to be a good compromise between mitigation of wave attacks and respect for the landscape. The main problem that may inhibit the use of such structures is difficulty of predicting the shoreline response to their placement, which basically depends on a certain lack of knowledge about features of wave-structure interaction. In the view of understanding the wave breaking process in presence of submerged trapezoidal porous barriers, the experimental investigation has been conducted on small scale structure models, with different front slope and permeability. The problem consists in analyzing the role of the main breaker types, that takes place at submerged breakwaters, in determining the characteristics of the wave profile in protected area. The detection of slope change point depends from the breaker type. When waves travel across the crown of submerged barriers, high non linear effects take place that lead to the appearance of secondary crests at the trailing side of the primary waves. These disturbances initially are bound to the main component but as the waves propagate at the rear of the barrier, in deeper water, they become short independent waves. Particularly they travel freely with their own phase speed. As consequence the number of waves in the shadow zone enlarges and
Dynamical classification of functional data
7
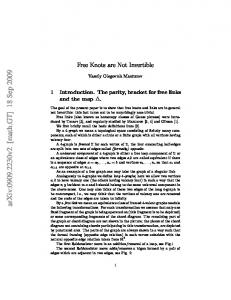
the transmitted mean period is reduced. Empirical research (cfr.Pasanisi et al., 2006) based on a video analysis, give a classification method based on the position of plunging jets that give birth to wave rupture and on the shape of water profile at breaking point. Looking only at the shape leads to loss salient feature of the waves such as sharp and pecks. Functional data analysis is a solution to avoid this information loss. Using our proposed procedure, we are able to identify 4 classes ( Figure 1) which mainly catch physical meaning of different waves profiles, as shown from the waves prototype ( Figure 2). In the frame of fluid mechanics classification of breakers is based on the forward tilt (ft) of wave profile. It basically represents the angle between the vertical and a straight line bisecting the front and the rear part of the wave. According the (ft) we can describe the principal characteristics of our classes. Particularly it was found that the first class refers to wave shapes coming from non breaking waves or Spilling-to-plunging breakers, (StP) ; in both cases the ft is less than 45 degrees. On the other hand class number two deals with mostly bore breakers where ft is exactly 45 degrees and wave shape consists of two horizontal sketch connecting a turbulent zone including a mix of air and water (spry). In the third class no physical proprieties has been found, of thought it is easily observed that non breaking and StP breakers are the dominant modes. That makes this class quite similar to the first one. Furthermore the forth class includes mostly collapsing breakers where the ft is larger then 45 degrees.
10
10 b)
a) 5
5
0
0
−5
0
0.5
1
1.5
2
10
−5
0
0.5
1
1.5
10 d)
c) 5
5
0
0
−5
2
0
0.5
1
1.5
2
−5
0
0.5
Fig. 1. The four classes.
1
1.5
2
8
Romano, Verde and Lechevallier
2
6 b)
a) 4
1
2 0
−1
0
0
0.5
1
1.5
2
3
−2
0
0.5
1
1.5
6 d)
c) 2
4
1
2
0
0
−1
2
0
0.5
1
1.5
2
−2
0
0.5
1
1.5
2
Fig. 2. a)The function prototype of the first cluster with the best set of knots τ 1 = (0.2891, 0.41458, 1.059, 1.5734, 1, 6762); b)The function prototype of the second cluster with the best set of knots τ 2 = (0.41779, 0.56656, 0.83363, 1.3741, 1, 4234); c)The function prototype of the third cluster with the best set of knots τ 3 = (0.58134, 1.4954, 1.5141);d) The function prototype of the fourth cluster with the best set of knots τ 4 = (0.46193, 0.7002, 1.261, 1.474) .
5
Acknoledgements
We are grateful to M.Buccino for his suggestions and comments on the results of the analysis.
References Abraham, C., Corillon, P., Matnzer-Loeber, E., Molinari, N.(2003) Unsupervised curve clustering using B-splines, Scandinavian Journal of Statistics, 30, 581– 595. Aitchison, J. (1986) The Statistical Analysis of Compositional Data, New York: Chapman & Hall. de Boor, C. (1978) A Practical Guide to Splines, New York, Springer. Diday, E.(1971) La Method des nu´ees dynamiques, Rev.Stat. Appliques, XXX, 2, 19–34 Ferraty, F., Vieu, P.(2002) The Functional Nonparametric Model and Application to Spectrometric Data, Computational Statistic, 17, 545–564. Friedman, J. H. (1991) Multivariate Adaptive Regression Splines, The Annals of Statistics, 19, 1–141.
Dynamical classification of functional data
9
Gervini, D. (2006) Free-knot spline smoothing for functional data, to appear in Journal of the Royal Statistical Society ,(Series B). James, G., Sugar, C., (2003) Clustering for Sparsely Sampled Functional Data, Journal of the American Statistical Association, 98, 397–408. James, G., Hastie, T. (2001) Functional Linear Discriminant Analysis for Irregularly Sampled Curves, Journal of the Royal Statistical Society. Series B, 63, 533–550. Jupp, D.L.B. (1978) Approximation to data by splines with free knots. Siam J. Numer. Anal. ,15, 328343. Hall, P., Poskitt, D. S. and Presnell, B. (2001) A functional data-analytic approach to signal discrimination, Technometrics, 63, 1–9. Hastie, T., Buja, A. and Tibshirani, R. (1995) Penalized discriminant analysis, The Annals of Statistics, 23, 73-102. Hastie, T., Tibshirani, R., Friedman, J.H. (2001) The Elements of Statistical Learning, Springer. Panisi, F., Calabrese, M., and Buccino M. (2006) Breaker Types and Free Waves Generation at Submerged Breakwaters in Proceeding of XXIX of HYDRA’06, Roma. Ramsey, J., Silverman, B.(2005) Functional Data Analysis.2nd Edition, Springer Verlag, New York. Rossi, F.,Villa, N. (2005) Functional data analysis with support vector machine, In Proceedings of ASMDA Conference 2005, Brest, France. Verde, R., De Carvalho, F.A.T. and Lechevallier, Y. 2001. A dynamical clustering algorithm for symbolic data, Tutorial on Symbolic Data Analysis, GfKl Conf., Munich.