©Freund Publishing House Ltd.
International Journal of Nonlinear Sciences and Numerical Simulation, 1, 345-353,2000
Dynamical Modeling and Simulation of a Laser-micromachined Vibration-based Micro Power Generator Wen J. Li, Gordon Μ. H. Chan, and Neil Ν. H. Ching Department of Automation and Computer-Aided Eng., The Chinese University of Hong Kong MMWBldg., Room 425, Shatin, Ν. T., Hong Kong, Email:
[email protected]
Philip H. W. Leongand Hiu Yung Wong Department of Computer Science and Eng., The Chinese University of Hong Kong HSH Eng. Bldg., Room 1028, Shatin, Ν. T., Hong Kong, Email:
[email protected] Abstract The dynamical motion of laser-micromachined copper springs used for a meso-scale vibration-based power generator was successfully modeled using ANSYS to reveal 3 modes of multi-directional vibratory motion due to a pure vertical input vibration. A MATLAB simulation was also used to predict the voltage output of the micro power generator system with coupled electrical and mechanical damping effects. The simulated output matched experimental results closely. These capabilities are essential for the successful design and development of a miniature, low-frequency, and robust micro energy generator that could be potentially used to convert human mechanical energy into usefully electrical power to operate devices such as mobile phones and heart-pacers. Thus far, 1cm 1 meso-scale generators are demonstrated capable of producing up to 4V AC with instantaneous peak power of 80mW, at input frequencies ranging from 60 to 120Hz with ~200μηι input vibration amplitude. A generator capable of producing 2V DC output with 4 0 μ \ ν power after voltage rectification, and able to drive a commercial infrared wireless signal transmitter to send 140ms pulse trains with ~60sec power generation time was also demonstrated. The A N S Y S model and MATLAB simulation results are presented and compared with the experimental results in this paper.
Keywords:
micro power generator, micro battery, and micro energy converter.
1. Introduction One of the projected goals for Micro Electro Mechanical Systems (MEMS or microsystems) technology is to develop low-cost and high-performance distributed sensor systems for medical, automotive, manufacturing, robotics, and household applications. Ideally, these distributed systems will have their own integrated power supplies to reduce potential problems such as interconnection, electronic noise and control system complexity. Efforts are underway to develop integrated chemically based power supply with MEMS devices. However, where
shelf life or replacement accessibility is a limiting factor, chemical power supplies may not be the optimal choice. We are currently developing a mechanically-based integrated MEMS power generator that will convert vibrational kinetic energy into electrical energy usable by a low-power CMOS circuit chip and integrated microsensors. Coupling with the recent advent in low-power MEMS sensors, a MEMS integrated mechanical power generator with life span far greater than its chemically based counterparts will be imperative in diverse micro low-power sensor and circuit applications in the near future. 345
Brought to you by | University of Arizona Authenticated Download Date | 5/28/15 3:12 AM
Various integrated micro power supplies have been proposed recently. Matsuki et al. used an energy coupling method to remotely induce voltages on-chip by magnetic field in 1988 [1], Bates et at. developed rechargeable lithium micro batteries which were used as self-contained on-board power supply in 1993 [2], Lee et al. built a miniaturized high-voltage solar cell array which was effective in driving electrostatic silicon mirrors in 1995 [3]. A comprehensive study on the feasibility of micro power supplies for MEMS was presented by Koeneman et al. in 1997 [4], who concluded that the most practical forms of micro energy storage media are chemical batteries, elastic strain energy, electric fields, and magnetic fields. However, there are many applications where light, thermal, electrical, or magnetic energies are not practical or available, therefore, we propose a new power supply which is integrable with MEMS and IC devices, and which generates electricity from ambient mechanical vibrations. Shearwood & Yates [5] and Williams and Yates [6] developed an electromagnetic micro generator which was built by attaching a magnet to a flexible polyimide membrane to produce 0.3μ\ν on a planar pick-up coil in 1997. No structural optimization or integration of their generator to a circuit system was reported. Amirtharajah & Chandrakasan [7] have successfully used a macro (500mg mass, with conventional springs) vibration-based power generator to drive a signal processing circuitry that consumed 18μ\ν of power in 1998. Nevertheless, to the best our knowledge, no one has published a work combining a MEMS resonating system and a low-power circuit system with optimized mechanical structures for specific applications. For this project, we have developed power generators with total volume less than 1cm3 using micromachined resonating springs to produce 2V DC voltage and with sufficient power to drive a commercial infrared (IR) wireless signal transmission system. In the development of the micro generator, modeling by ANSYS and system output simulation by MATLAB were critical to optimizing the
voltage and power generation. This paper presents the validation of these models and simulation by experimental results. With the agreement between experimental and theoretical system output results, we could now proceed to develop optimized generators for different engineering applications.
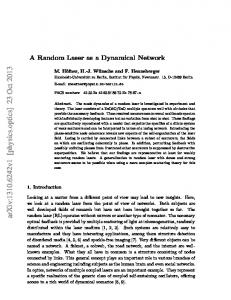
2. Generator Concepts and Design A conceptual drawing of the micro electromagnetic generator is shown in Figure 2. The device consists of a permanent magnet of mass m with magnetic field strength B, silicon springs with total spring constant k, and a wire coil of length /. The ends of each spring are attached to the permanent magnet and a solid frame, which is connected to the rigid housing of the device, respectively, forming a mass-spring resonator structure. The wire coil is fixed on the rigid housing of the device. When the rigid housing is vibrated, the magnet will move relatively to the housing and the wire coil. This relative movement of magnet to the coil results in the varying amount of magnetic flux passing through the coil. According to the Faraday's Law of electromagnetic induction, which states that the electromotive force induced is equal to minus the rate of change of the flux linkage when the magnetic flux passing through an area enclosed by a loop changes, a voltage is induced on the coil. A schematic diagram of the micro generator system is shown in Figure 2. The displacement of the generator is represented as y(t) and the relative displacement of the magnet to the wire coil is indicated as z(t). The springs of the generator are lumped into one with spring constant k and the mechanical damping due to air resistance and friction is represented by a damper with damping coefficient d. The wire coil is represented as an inductor with inductance L and a resistor with resistance Rc. The voltage induced in the coil is served as the electrical output of the generator and the power input of the load circuit. For the sack of simplification, the load circuit is represented by a single resistor with resistance R in the diagram.
346
Brought to you by | University of Arizona Authenticated Download Date | 5/28/15 3:12 AM
The overall transfer function from input force to output voltage has been previously derived [8] and is given by the expression:
pennonant magrat, Β
BIRs
Fun* connected to houwig
Figure 1. Conceptual illustration of the micro electromagnetic generator under development.
Figure 2. Electro-mechanical-magnetic variables of the micro power generator.
coupling
The block diagram of the linearized model of the micro generator system is given in Figure 3. A mechanical input force is fed into a second-order mechanical mass-spring system corresponding to the resonator structure formed by the magnet and the springs. The output of the mechanical system, displacement of the magnet relative to the coil, is then fed into the first-order electrical system corresponding to the LR circuit formed by the load resistor in series with the wire coil. The current induced in the coil by the mechanical excitation generates a feedback electromechanical force, fe, which, in turn, damps the motion of the magnet. 1
z
ms3 +ds + k
f.
BIRs Ls + R+Re
Bl R
Figure 3. Block diagram of the linearized model of the power generation system.
(Ls + R+ Rc )(ms2 +ds + k) + (Bl)2 s
F(s)
(1)
However, as reported by Amirtharajah and Chandrakasan [7], the electrical pole is, in general, much faster than the mechanical dynamics for the vibration cases of interest. The inductance of the wire coil is small while comparing to the load resistance of the output circuit, resulting in a fast electrical pole. If the mechanical constants are chosen such that the resonant frequency of the micro generator system is closed to the expected input vibration frequency, which is usually much smaller than the electrical resonant frequency, it will be reasonable to ignore the electrical pole. The linearized model of generator system is simplified to a damped second-order system. Moreover, the resistance of the wire coil is much smaller than the load resistance in most cases. By assuming that both L and R, are zero, the system transfer function may be rewritten as the expression: Bis F(s)
From above, if the micro at resonance, the output will be maximized. The output power at resonance
P=
(2)
{ms2 +ds + k) + ^ ~
^ζ
Jo col 4C2
generator is operated power of the system value of the average is given as [8]:
(3)
where is the electrical damping ratio, and ζ is the total damping ratio of the system. A MATLAB program was written to simulate particular designs of generators giving the experimentally determined quantities for the governing parameters in Eq. 2. Some compared results are presented in a later section. However, a simple case study using the
347
Brought to you by | University of Arizona Authenticated Download Date | 5/28/15 3:12 AM
simulation shows that optimization of coil length is important for any input vibrational frequency. A representative relationship between the generator system output voltage with different input frequencies is shown in Figure 4 with coil length as a parameter.
different patterns of springs were studied as a starting point and are shown in Figure 5.
OUJXII Vot*g* VI VUrtflorai Frequency
(a) (b) Figure 5. Two examples of spring designs for the generator, (a) A "zig-zag" spring, (b) A "spiral" spring.
Figure 4. System output voltage as a function of input vibrational frequency and coil length simulated by MATLAB program.
ANSYS Modeling of the Generator Spring Structure
Two main factors were considered in designing a suitable generator spring in our current work: minimization of resonant frequency for human power conversion and minimization of dynamical stress for long system operational life. In order to carry out a systematic output optimization study of specific designs of generators Finite Element Analysis (FEA) was employed using ANSYS. 3.1.
Static Analysis: Spring Design
ANSYS static analysis calculates the effects of steady loading conditions on a structure, while ignoring inertia and damping effects. With the use of static analyses, the spring constant and stress distribution of a particular structure can be calculated. The dynamic response of the system can thus be simulated in the harmonic analyses. Two fundamental vibrating structures with
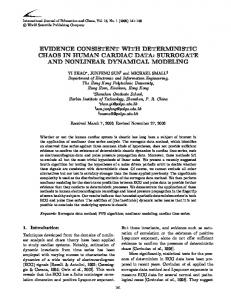
Repeated simulations and frequent adjustment of design parametric values are essential in the process of developing a through FEA. In order to minimize the extra effort on building additional geometric models for each design with parametric change, an AutoLISP program was written to enhance the building process of the required model in AutoCAD, which then creates the appropriate geometric model for A N S Y S to perform FEA. Three-dimensional solid elements each defined by eight nodes were used to model the micro spring structures. There are six degrees of freedom (DOF) on each node (i.e., translations in the nodal x, y and ζ directions, and rotations about the nodal x, y and ζ axes) giving each element a total of 48 DOF. A spiral structure with total spring length /=70.1mm and a zigzag structure with length /=76.9mm were studied to compare spring deflection and stress under a giving applied force at the center of the mass held by the springs. ANSYS results indicate that spring pattern in the spiral form are able to provide twice as much deflection (£=3.47N/m) as those in zigzag form (£=6.64N/m), while experience only - 1 5 % of the bending stress. From Eq. 3, a large deflection is desired since the power output is proportional to the square of the amplitude of deflection. Also, the lower bending stress would give longer fatigue life for the spiral spring structure. Based on the ANSYS results we have used a Nd:YAG (Ι.Οόμηι wavelength) laser to micromachine copper spiral spring structures as shown in Figure 6. Copper was selected over
348
Brought to you by | University of Arizona Authenticated Download Date | 5/28/15 3:12 AM
silicon because of its low spring constant, long fatigue life, and compatibility with IC/MEMS devices as discussed in [8]. Currently, we are able to produce spring structures with total diameter ranging from 4mm to 10mm and have spring gap/width dimensions ranging from 50μιη/ 50μηι to ΙΟΟμπι/ΙΟΟμπι, using ΙΟμπι thick copper. 3.2.
Modal and Harmonic Response Analysis
Modal and harmonic response analyses were also performed to predict dynamic motion of the spring-mass system under an input force using ANSYS. Modal analysis is used to determine the dynamic vibration characteristics such as natural frequencies and mode shapes of a structure. In studying the micro generator performance, modal analyses were used as a starting point for the more detailed dynamic harmonic response analysis. The natural frequency and mode shapes determined are important parameters in the design of the resonating structure for dynamic loading conditions. Harmonic response analysis was used to determine the steady-state response of a spring structure to loads that vary sinusoidally with time.
spring, the generator gave relatively high voltage at higher frequencies even though the vibrational amplitude is almost negligible in the vertical direction. Using a strobe light to synchronize the vibration motion of the mass, the mass was observed to have a 2nd and 3 rd mode resonance. The mass appeared to cyclically rotate about an axis parallel to the plane of the coil. Furthermore, it was observed that the amplitude of the rotation is very small compared to the vertical vibration at the 1st mode resonance. We therefore conjecture that if the a spring can be designed to vibrate in a horizontal plane rather than a vertical plane relative to a coil, even under a force in the vertical direction, the voltage output can be increased and the stress on the spring can be reduced. Physically this can be explained by the fact that Faraday's Law predicts the voltage output to be proportional to the rate of changing magnetic flux, and hence, a region of greater flux density will allow for greater current induction. In other words, when the magnetic mass moves too far away from the coil, the flux density is low and the rate of changing flux decreases significantly.
Input frequency (Hz)
Figure 6. SEM picture of a laser-micromachined 4mm diameter spring
An interesting experimental observation concerning the generator output voltage versus mass vibrational amplitude was made and which was later validated by the ANSYS model. As shown in Figure 7 for a particular resonating
Figure 7. Vibrational amplitude of the mass and the resulting voltage generated for a 2DOF spring structure.
We have used ANSYS to model the mechanical motion of the resonating spring-mass system and matched the results with the above experimental observations. The results presented in the following are based on the parameters given in Table 1. The motion of the mass during 1st, 2nd, and 3rd mode of resonance 349
Brought to you by | University of Arizona Authenticated Download Date | 5/28/15 3:12 AM
were captured on digital video and pictures are shown in Figure 8, Figure Figure 10, respectively. Also shown figures are their respective ANSYS modal Geometry Total Diameter Width Thickness Total length Young's modulus Poisson's ratio Density Magnet Dimension Density Mass Cu Spring
sample 9, and in the results.
Spiral 1 Ommx 10mm 100mm 110mm 79.1mm llOGPa 0.35 8960 kg/nr' 3mmx3mmx3mm 8120kg/m 3 219mg
Table 1. List of variables modeling of resonating springs.
used
for
2nd mode frequency (Figure 9), but when the input frequency is increased, the axis of rotation begins to shift towards the y-axis about the z-axis, resulting in a decrease of voltage output. The power generated by the generator continues to drop and then rise until reaching a vibration resonant frequency of 113Hz. The magnet vibrates resonantly about an axis 45 degree to the x-axis horizontally at this frequency, resulting in a local maximum voltage output.
ANSYS
According to the modal analysis results, the 1st mode occurs at 81.5Hz, which corresponds to the experimental output voltage peak at 70~80Hz in Figure 7. The power output is mainly contributed by the resonant vertical movement of the magnet at this frequency. The 2nd mode occurs at somewhere between 100Hz and 125Hz according to the experimental results. Repeated measurements showed the 2nd peak to be at 107Hz and 3rd peak at 113Hz. However, unlike the 1st mode where large vertical deflections were observed, the vertical magnet vibration amplitude is small (~300μηι) at the 2nd mode frequency. Instead, an oscillatory motion about an axis in the plane of the coil was observed at the 2nd mode resonance. Hence, it is clear that the voltage peak occurring at the 2nd mode frequency is not contributed by the vertical spring vibration as designed. Modal analyses reveal the occurrence of the 2nd mode frequency at 131.5 Hz. The rotation of the magnet is much larger than the vertical deflection at this driving frequency such that a large power is generated even with a small input amplitude (~200μιτι). The 3 rd mode can be treated as an extension of the 2nd mode. The 3rd frequency is closed to the 2nd mode frequency in that it is sometimes undetectable during the experiment. Modal analyses reveal the 3rd mode frequency to be at 135.59Hz. From experimental observations, the mass rotates resonantly about the x-axis at
Figure 8. Finite element simulation of the first m o d e shape indicating a resonant vertical vibration at 81.53Hz.
Figure 9. Finite element simulation of the second mode shape indicating a resonant rotational vibration at 131.50Hz.
350
Brought to you by | University of Arizona Authenticated Download Date | 5/28/15 3:12 AM
A summary of the experimental and modeled results are given in Table 2. The discrepancy between A N S Y S and measured results is most likely due to the current imprecise packaging technique of which the magnetic mass is attached to the spring by epoxy, which will increase the mass of the system and causing a shift of resonant frequency. W e are currently developing a better packaging technique to overcome this problem. M o d e Measured A N S Y S Freq. (Hz) Freq. (Hz) 1
Figure 10. Finite element simulation of the third mode shape indicating a resonant rotational vibration at 135.59Hz.
T h e harmonic analyses for displacement of the spring-mass system given in Table 1 are shown in Figure 11. The magnitude of the linear and angular displacements are obtained from specifying a force or torque, respectively, to the modal analyses results. The results show the 1 st mode resonance is dominated by z-displacement and the 2 nd and 3 rd m o d e resonance are contributed by a coupling resonance from χ and y rotations. Although χ and y rotations are also present at the 1 st resonance, the z-displacement magnitude is much larger than the rotations. These A N S Y S results were confirmed by experimental observations as described previously. 3
> X Disp • Y Disp — Ζ Disp Μ X Rot * Y Rot « Ζ Rot 1
2.4
ΰ