Apr 3, 2009 - 1 Faculty of Physics and Mathematics, University of Latvia, Raina ... 2 Vilnius University Observatory, Ciurlionio 29 Vilnius 2009, Lithuania.
The Astrophysical Journal, 695:L203–L207, 2009 April 20 � C 2009.
doi:10.1088/0004-637X/695/2/L203
The American Astronomical Society. All rights reserved. Printed in the U.S.A.
DYNAMICAL PHENOMENA IN THE ATMOSPHERE OF THE PROTO-PLANETARY NEBULA IRAS 22272+5435 L. Zaˇcs1 , J. Sperauskas2 , F. A. Musaev3,4,5 , O. Smirnova1,6,9 , T. C. Yang7 , W. P. Chen7 , and M. Schmidt8 1
Faculty of Physics and Mathematics, University of Latvia, Rai¸na bulv¯aris 19, LV-1586 R¯ıga, Latvia 2 Vilnius University Observatory, Ciurlionio 29 Vilnius 2009, Lithuania 3 Special Astrophysical Observatory of the Russian AS, Nizhnij Arkhyz 369167, Russia 4 Institute of Astronomy of the Russian AS, 48 Pyatnitskaya Street, 119017 Moscow, Russia 5 Terskol Branch of Institute of Astronomy of the Russian AS, 361605 Peak Terskol, Kabardino-Balkaria, Russia 6 Institute of Astronomy, University of Latvia, Rai¸ na bulv¯aris 19, LV-1586 R¯ıga, Latvia 7 Graduate Institute of Astronomy, National Central University, Chung-Li 32054, Taiwan 8 N. Copernicus Astronomical Center, ul. Rabia´ nska 8, 87-100 Toru´n, Poland Received 2009 January 28; accepted 2009 March 11; published 2009 April 3
ABSTRACT Radial velocity monitoring of the star HD 235858 confirmed regular variations with a peak-to-peak amplitude of about 10 km s−1 and a period of about 131.2 days. The light, color, and velocity variations are typical for RV Tauri stars. Splitting of low-excitation atomic lines was detected. The components are both blue- and redshifted relative to the systemic velocity. Significant variations are observed in the intensity of C2 and CN lines. Variable emission in the Hα profile, splitting of low-excitation atomic absorption lines, appearance of CN emission lines, blue wings of strong lines, and recent reddening give evidence of shocks and mass outflow obviously induced by atmospheric pulsations. Key words: line: profiles – shock waves – stars: AGB and post-AGB – stars: mass loss – stars: oscillations – stars: winds, outflows dust grains in the inner cavity of the PPN shell was suspected; however, the subarcsecond structure of the post-AGB shell and the nature of a post-AGB mass ejection are not clear (Ueta et al. 2001). The observations performed in 1990 September by Hrivnak et al. (1994) confirmed the post-AGB mass ejection for IRAS 22272+5435. Asymmetry in strong atomic lines was observed in 1992 August by Zaˇcs et al. (1995). The central star left AGB about 380 yr ago (Ueta et al. 2001) and has still a relatively low effective temperature of Teff = 5600 ± 250 K (Zaˇcs et al. 1995). The photospheric molecular veiling should be negligible; however, Hrivnak & Kwok (1991) detected prominent molecular absorption features of C2 and C3 in the optical low-resolution spectrum of HD 235858. HD 235858 = V354 Lac displays complex light variations with an amplitude of about 0.4 mag in the visual region. Hrivnak & Lu (2000, 2007) found a period of about 127 days both in the magnitude and radial velocity (RV) curve and attributed the variations to pulsations. Arkhipova et al. (2000) retrieved two pulsation periods using long-term UBV observations, P = 207 and 145 days. This Letter presents the first results of simultaneous spectroscopy and photometry in the optical region to understand in detail the mechanism of variability.
1. INTRODUCTION The protoplanetary nebula (PPN) phase is an important but still poorly understood stage in the evolution of low- and intermediate-mass stars. Objects in this stage are in transition between the asymptotic giant branch (AGB) and planetary nebula (PN) phases. Stars enter the PPN at the moment when the strong AGB mass loss stops; however, up to now it has not been known how the decrease of the mass-loss rates takes place. The difference between envelope morphology in AGB stars and PPNs implies a change in the mass-loss process as the star leaves the AGB (Hrivnak & Bieging 2005, and references therein). Pulsation, dust formation, and mass loss through massive stellar winds are characteristic phenomena of AGB stars. Stellar pulsations cause waves that travel into the outer layers of the atmosphere and develop into shocks with temperature and density variations strong enough to trigger dust formation (Freytag & H¨ofner 2008, and references therein). Radiation pressure on dust particles is believed to be a major reason for the stellar wind from AGB stars leading to high mass-loss rates. The presence of hot dust and the appearance of emission lines in some PPNs seem to be the results of recent mass loss. IRAS 22272+5435 is a typical PPN associated in the optical with the carbon-rich star HD 235858, which shows a significant s-process enhancement (Hrivnak & Kwok 1991; Zaˇcs et al. 1995; Reddy et al. 2002). The star is surrounded by a detached circumstellar envelope (CSE), the result of an earlier mass loss. Radiative transfer calculations showed a significant flux underestimate between 5 and 10 μm in the spectral energy distribution if a single CSE was considered (Szczerba et al. 1997). The best-fit model for the dust shell of IRAS 22272+5435 consists of the central star surrounded by two separate sets of dust shells representing a PPN shell (AGB wind shell + superwind shell) and a post-AGB wind shell located in the inner cavity of the PPN shell (Ueta et al. 2001). The presence of hot 9
2. OBSERVATIONS RV of HD 235858 was monitored using the CORAVEL spectrometer (Upgren et al. 2002) of the Vilnius University installed on the 1.65 m telescope at the Moletai Observatory (Lithuania) and on the 1.6 m and 2.3 m telescopes at the Steward Observatory (Arizona). 75 RV measurements were gathered between 2005 September and 2008 February (JD2453639−4531) with a standard deviation of one measurement of about 0.7 km s−1 . The imaging photometry was carried out on the 1.2 m Schmidt telescope at the Baldone Observatory of the University of Latvia equipped with an SBIG-ST10XME CCD camera in the local BVRI system from 2007 October through 2008 January. A few measurements were made with the Lulin 1 m telescope (LOT), equipped with a Princeton Instruments PI 1300B CCD camera in the standard UBVRI bands in 2005 October 12 and in 2005
PhD student.
L203
ˇ ET AL. ZACS
L204
Table 1 Photospheric Heliocentric Radial Velocities
RV (km/s)
-46 P=131.2
-44
JD 245+
-42 -40
B-V, R-I delta Mag
-38 -36
Arcturus
0.3 0.6 0.9 0.7 0.8 0.9 1.0
+
+
53800
Vol. 695
+
+
+
54000 54200 JHD 2,400,000+
54400
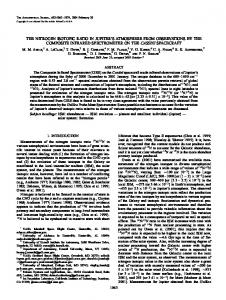
Figure 1. RV variations of HD 235858 measured using the CORAVEL spectrometer (top panel; filled circles) plotted together with a sinusoid fit (P = 131.2 days; dotted line) to the velocity data. The velocity values gathered from high-resolution spectra are indicated by filled triangles. The differential variations of magnitude (middle panel: B, filled circles; V, squares; R, triangles; I, open circles) and color (bottom panel: (B − V); open circles; (R − I); open triangles) are given. Predicted light minima for the accepted period are indicated by plus signs.
December 19. The images were processed following standard procedures of bias and dark subtraction and flat fielding using the IRAF package. High-resolution spectra for HD 235858 were obtained with the coud´e e´ chelle spectrometer MAESTRO on the 2 m telescope at the observatory on the Terskol Peak in Northern Caucasus (altitude of 3100 m) equipped with a Wright Instruments CCD detector. Four spectra were obtained between 2002 November and 2008 February. In addition, spectra of several hot, rapidly rotating stars were observed to identify the telluric absorption lines. All the spectra covered from about 3600 to 10000 Å. A backside illuminated chip has been used since 2006, therefore the recent spectra longward of about 6700 Å are affected by interference fringes. The resolution inspected using telluric lines agrees for all spectra, FWHM � 0.25 Å near 6900 Å. All spectra were bias subtracted, flat field corrected, and converted to onedimensional spectra using the standard DECH20T package. 3. ANALYSIS AND RESULTS 3.1. Radial Velocities The CORAVEL heliocentric radial velocity (RV� ) measurements are provided in Table 1 and are plotted as a function of time in Figure 1. The best-fitting sinusoid with a period of 131.2 days and an amplitude of 3.1 km s−1 is given. The mean residual of observations from this fit is about 1.3 km s−1 . The RV curve displays obvious variations in the depth of minima/maxima; therefore, a secondary period was suspected. In the case of two periods (131.5 and 68.9 days) the mean residual is lower—1.0 km s−1 . Additional observations are needed to confirm the second period. The mean heliocentric RV of HD 235858 calculated using all RV measurements, RV0 = −40.2 km s−1 , is close to the systemic velocity, RV� = −40.1 km s−1 , measured using CO emission lines of the CSE (Hrivnak & Bieging 2005). In addition, the photospheric RV was measured using a sample of weak (EW < 200 mÅ) and symmetrical atomic lines (FWHM � 0.45 Å) in all high-resolution spectra.
3639.49 3649.46 3650.43 3650.44 3651.39 3652.43 3653.37 3654.43 3655.39 3672.36 3675.38 3676.29 3677.29 3706.30 3708.21 3860.55 3861.54 3864.54 3865.55 3866.54 3867.54 3883.51 3889.50 3899.51 3900.51
RV� (km s−1 )
JD 245+
RV� (km s−1 )
JD 245+
RV� (km s−1 )
−41.7 −40.5 −41.1 −40.3 −40.6 −39.5 −39.4 −38.6 −39.4 −37.6 −35.9 −35.8 −36.9 −40.6 −40.3 −43.8 −45.9 −46.0 −45.0 −45.7 −44.6 −41.8 −41.0 −38.7 −38.9
3917.50 3918.49 3980.38 3985.44 3985.45 3992.43 3993.43 4027.58 4028.58 4035.80 4036.72 4037.72 4040.57 4042.57 4043.73 4044.56 4045.57 4046.57 4047.57 4056.63 4058.67 4059.66 4060.63 4061.65 4062.67
−38.7 −38.5 −40.1 −42.5 −42.0 −41.9 −43.5 −39.8 −40.6 −38.5 −38.6 −38.0 −39.0 −39.4 −40.6 −39.8 −38.0 −37.3 −36.8 −37.4 −36.7 −37.6 −38.2 −36.6 −37.7
4063.70 4066.62 4071.55 4074.56 4077.65 4079.61 4082.58 4084.59 4091.59 4093.61 4094.64 4096.59 4357.46 4363.46 4364.40 4368.40 4369.39 4383.43 4469.27 4470.23 4471.19 4512.27 4513.20 4530.22 4531.22
−36.9 −36.6 −37.5 −37.7 −37.2 −39.0 −35.8 −38.7 −39.1 −39.4 −38.0 −40.0 −40.1 −41.3 −40.2 −41.3 −39.9 −40.3 −37.2 −38.1 −38.2 −38.4 −40.9 −44.6 −44.2
The direct and mirror profile of each line was correlated and the corresponding RV was calculated from the relative shift of the line center from its rest wavelength. These values agree well with the CORAVEL measurements (see Figure 1). A number of narrow C2 absorption lines identified in the nearinfrared spectrum of HD 235858 (see Section 3.3) were used to measure radial (expansion) velocity of the cool CSE. C2 lines of the Phillips system are shifted relative to photospheric lines by −4.0 km s−1 on average in the spectrum observed in 2002 November 18. The heliocentric photospheric RV of HD 235858 measured at the same time using atomic lines was found to be −44.6 ± 0.5 km s−1 . Bearing in mind the photospheric RV relative to systemic velocity during observations, ΔRV = −44.6 − (−40.2) = −4.4 km s−1 , the expansion velocity of the CSE was calculated, Vexp (C2 ) = −4.4 − 4.0 = −8.4 ± 0.5 km s−1 . This value agrees with the best model fit of CO (2–1) and (4–3) lines, Vexp (CO) = −8.5 km s−1 , that are formed in the warm and dense interior region of the PPN shell that contains the gas and dust with Tkin = 120 K ejected in the final AGB stage (Hrivnak & Bieging 2005). 3.2. Photometry Photometric observations continued over a time interval of about seven months with the main goal of specifying the mechanism of RV variations. The differential light and color variations in the local BVRI bands observed at Baldone Observatory are presented in Figure 1. These observations are not converted to the standard system. During observations the magnitude varied from B = 11.81–11.14 mag (ΔB ∼ 0.67), V = 8.83–8.44 mag (ΔV ∼ 0.39), R = 7.77–7.44 mag (ΔR ∼ 0.33), and I = 6.86–6.53 mag (ΔI ∼ 0.33). The uncertainties are calculated from the errors of individual measurements of standard stars: 0.04 (B), 0.03 (V), 0.02 (R), and 0.03 (I). The standard color index B − V observed on 2005 October 12 and
No. 2, 2009
DYNAMICAL PHENOMENA IN THE ATMOSPHERE OF IRAS 22272+5435
L205
CrI 4801
0.8
Relative
flux
0.4
1.2
on 2005 December 19 near the predicted primary light minimum and maximum, B − V = 2.35 and 2.12 ± 0.01, is larger than previously observed. 3.3. High-Resolution Spectroscopy The optical spectrum of IRAS22272+5435 was accepted a priori to be stationary (Zaˇcs et al. 1995; Bakker et al. 1997; Reddy et al. 2002). However, pulsations of stellar interiors have a strong effect on the atmospheres of cool luminous stars and time series of high-resolution spectra are a useful tool to study atmospheric dynamics (see Nowotny et al. 2005). Variations in profiles and velocities are detected for low-excitation potential (LEP) lines. Strong and variable features of carbon-bearing molecules are detected. A large number of narrow (FWHM � 0.25 Å; lines are not resolved) molecular lines are present. The CSE lines of C2 (1, 0), (2, 0), (3, 0), (4, 0) Phillips system and CN (1, 0), (2, 0), (3, 0), (4, 0) Red System were identified. Thus, the optical spectrum of IRAS22272+5435 originates at various depths throughout different layers in the atmosphere of HD 235858 significantly affected by pulsations and in the CSE. The moments of recent high-resolution observations relative to the RV and light curves are indicated by the dashed vertical lines in Figure 1. The phases were calculated using the 131.2 day period where phase 0.0 defines the time of the primary light minima (JD2454433). The profile of Hα was found to be asymmetric in all of the spectra. The region around Hα was synthesized using the Kurucz (1993) atmospheric model and compared with the spectrum observed in 2008 February near light maximum: emission wings are visible (Figure 2). The weak variable emissions are present for most, if not all, of the pulsation cycle and might result from emission caused by shock waves. Other shock-related features are observed in low-excitation atomic lines. RV was also measured from the narrow absorption component of the Hα line. This component is redshifted relative to the systemic velocity by about 5–10 km s−1 in all of the spectra. Doubling of strong s-process lines was found in the spectrum observed in 2002 November. Additional observations were provided and a number of atomic lines inspected to understand the physical mechanism of splitting. Atomic absorption lines take part in the photospheric pulsations; however, only the profiles of low-excitation lines are disturbed by splitting. Figure 3 shows the profiles of Ba ii at 6141.71 Å and of the Cr i line at 4801.025 Å in the RV scale relative to the systemic velocity, RV�
C2(3,0) Phillips system CN(5,1) Red system
1.0
0.8 Figure 2. Spectrum of HD 235858 around Hα observed near light maximum in 2008 February along with that calculated (dotted line) using an atmospheric model with Teff = 5500 K and log g = 0.5 (cgs). The wavelengths are corrected for photospheric velocity.
BaII 6141
C2(0,1) Swan system
-60 -40 -20 0 20 40 Radial Velocity (km /s)
60
Figure 3. Two representative atomic (top panel) and three molecular (bottom panel) lines in the spectra of HD 235858 observed in 2002 November (thin line), 2006 October (thick), 2006 November (dotted), and 2008 February (dot-dashed) in the RV scale relative to the systemic velocity, RV� = −40.2 km s−1 . Splitting of the low-excitation line of barium was observed, indicating an outward and downward motion with a velocity of 10 km s−1 . A C2 (0, 1) Swan system band head at 5635.35 Å, a CN(5, 1) Q1 Red system line at 6420.722 Å, and a PPN shell line of C2 (3, 0) Phillips system at 7716.531 Å are provided.
= −40.2 km s−1 . The Cr i line (LEP = 3.122 eV) with a Gaussian profile in all spectra traces the velocity amplitude of photospheric pulsations around the systemic velocity during the pulsation cycle. The Ba ii line (LEP = 0.704 eV) shows splitting. The intensity and velocity of resolved components depend on the pulsation phase. The profile of the barium line observed in 2006 October near the maximum expansion velocity of the photosphere (see Figure 1) is single, much broader and shows an extended wing up to about −70 km s−1 . The sequence of profiles indicates that expanding and infalling layers are simultaneously present in the outer atmosphere of HD 235858 and likely a mass outflow exists. It should be noted that the redshifted component of unknown nature relative to the systemic velocity was detected in the resonance lines of three other post-AGB stars (“infalling component A”; see Reddy et al. 1999, 2002). A time series of high-resolution spectra shows significant changes in the intensity of C2 and CN “photospheric” features. One representative spectral range is shown in Figure 4 together with the synthetic photospheric spectrum calculated for the C2 molecule using a spectrum synthesis technique (for details see Zaˇcs et al. 2005). The atmospheric model was adopted with parameters suitable for HD 235858: Teff = 5500 K, log g = 0.5 (cgs), ξt = 3.7 km s−1 , and [M] = −0.5 (Zaˇcs et al. 1995). As can be seen, molecular features are stronger than they should be for a standard photosphere of a G5 supergiant, therefore, the temperature of the environment where the molecules have formed is much lower than 5500 K. Three representative molecular features are displayed here in the RV scale. The band head of the C2 (0,1) Swan system at 5635.35 Å is blueshifted relative to the systemic velocity by about −15–25 km s−1 in all of the spectra (see Figure 3). The maximal expansion velocity (�25 km s−1 ) and the maximal C2 abundance were observed in 2006 October when the photosphere of HD 235858 passed the maximal expansion velocity according to the CORAVEL measurements. The lines of the CN Red system in general vary in step with C2 ; however, the Doppler shift relative to the systemic
ˇ ET AL. ZACS
L206
Figure 4. Three high-resolution spectra of HD 235858 in the spectral region around the C2 Swan system (0, 1) band head at 5635 Å observed on 2008 February 5 (thin line), 2006 October 6 (thick line), and 2006 November 20 (dotted line). The wavelengths are corrected for photospheric velocity. The molecular contribution longward of 5635 Å is negligible. The upper spectrum represents synthetic photospheric spectrum of the C2 Swan system calculated for an effective temperature of 5500 K.
velocity is lower. The unblended line of the CN Red system (5,1) at 6420.722 Å was blueshifted relative to the systemic velocity by about −10 km s−1 in 2006 October when its intensity was largest (see Figure 3). However, in 2006 November this line displays approximately the photospheric velocity. Thus, the “photospheric” molecular features are apparently formed in the cool outflow at a different high scale. The CN lines behave as though they arise near the stellar photosphere. The spectrum observed on 2008 February 5 near the light maximum shows emission in the CN lines (see Figure 3), in support of shock waves. The unblended C2 (3,0) Phillips system line at 7716.531 Å is provided for comparison purposes in Figure 3. Significant variations in the intensity and velocity are not detected in this PPN shell line. Some minor discrepancies in profiles are because of uncertainties in removing the strong CCD fringes and telluric lines longward of 6800 Å. It should be noted that blue- and redshifted C2 and C3 lines were detected in the lowresolution spectrum of HD 235858 and similar phenomena were discussed for CRL2688 and some carbon stars by Hrivnak & Kwok (1991). 4. DISCUSSION AND CONCLUSIONS New spectroscopic and photometric observations of the wellknown cool PPN IRAS 22272+5435 in the optical region have strengthened the assumption that this carbon-rich post-AGB star experiences mass-loss episodes probably induced by stellar pulsations. RV monitoring with the CORAVEL spectrometer revealed variations with a period of about 131.2 days and a peak-topeak amplitude of about 10 km s−1 . The RV curve displays obvious variations in the depth of minima/maxima; therefore, a secondary period was suspected, P = 68.9 days. It appears that HD 235858 is pulsating in the fundamental mode with the resonance P0 = 2P1 . This resonance occurs for typical RV Tauri stars (Pollard et al. 1996). Hrivnak & Lu (2000) acknowledge the pulsation period of about 130 days during the last 18 years. Tuchman et al. (1993) found similar periods for the model of a low-mass star (0.7 M� ) with a thin envelope (less than 0.01 M� ) and a supergiant luminosity (104 L� ); however, the model is near the limit for the unstable fundamental mode. The fundamental mode of 132.2 days and the luminosity of 1.3 × 10⁴ L� (Ueta et al. 2001) provide a mass of about 0.75 M� for HD 235858 (see Figure 10 of Tuchman et al. 1993). Nonlinear radiative models (Fokin et al. 2001) reproduce reasonable RVs and light curves and acknowledge propagation of the shock
Vol. 695
(compression) waves throughout the stellar atmosphere; the outward and downward waves reach an amplitude of about 20 and 10–15 km s−1 , respectively. The periods of light and RV variations agree; however, the variations are shifted in phase in agreement with that observed by Hrivnak & Lu (2000). HD 235858 is brightest during expansion and faintest during contraction. The extrema of brightness are at moments when the photosphere reaches the systemic velocity of −40.2 km s−1 . The total amplitude of visual light variations during the last 18 years V ∼ 0.4 mag was found to be stable (Arkhipova et al. 2000). The color index B − V is largest at light minimum in agreement with that observed for Galactic RV Tauri variables. Between 1991 and 2000 the color B − V varied between ∼2.1 and 1.9 mag (Arkhipova et al 2000). Our photometry gives B − V = 2.35 and 2.12 in 2005 October/ December near the predicted primary light minimum/maximum (predicted phase of 0.08 and 0.60). The recent reddening is probably because of increased circumstellar extinction. The profile of Hα was found to be asymmetric and variable. The weak emission wings are present for most of the pulsation cycle and may be the result of shock waves. The lowexcitation lines display two or more components in the spectra of HD 235858, indicating that shock waves are propagating through the regions of stellar atmosphere where these lines are forming as for typical RV Tauri stars (Pollard et al. 1997). The sequence of profiles indicates that expanding and infalling layers are simultaneously present in the outer atmosphere of HD 235858. The lack of strong line-doubling behavior in high potential lines is most likely because these lines are formed deeper in the atmosphere. A component redshifted relative to the systemic velocity by about 10 km s−1 of unknown nature was detected in the resonance lines of Na and Li for other postAGB stars (Reddy et al. 2002). Thus, the movement of layers in pulsating extended atmospheres influenced by shock waves could be the physical mechanism of blue/redshift. Photospheric molecular features in the spectrum of HD 235858 are enhanced in comparison with the standard photosphere of a G5 supergiant. Significant changes in the intensities are detected. The C2 Swan system band heads are blueshifted relative to the systemic velocity by about 10–25 km s−1 in all of the spectra. The CN Red system (4,0) and (5,1) lines in general vary in step with C2 ; however, the Doppler shift relative to the systemic velocity is lower. The “photospheric” molecular features are apparently formed in the cool outflow of HD 235858 at different high scale. Blue/redshifted C2 and C3 lines have been detected in other post-AGB and AGB stars. The intensity changes seem to be typical for RV Tauri stars (Pollard et al. 1996, and references therein). A related star MACHO*04:55:43.2– 67:51:10 in the Large Magellanic Cloud (LMC) with a primary period of 112.4 days combines the signatures of post-AGB and RV Tauri stars and shows a strong C2 band with a pronounced phase dependence (Pollard & Lloyd Evans 2000). The spectrum of HD 235858 observed in 2008 February near the light maximum shows emission in lines of the CN Red system in support of shock waves. Hrivnak et al. (1994) attributed the emission of highly excited vibrational levels of CO observed in 2000 September to the onset of a sudden mass ejection from the central star. The emission is likely to have originated either at the base of the new wind where the density is high, or at the region of interaction between this flow and the outer dust/molecular envelope where the shock energy is dissipated. Ueta et al. (2001) confirmed post-AGB mass ejection about 10 years ago. Bl¨ocker (1995) considered a nonabrupt
No. 2, 2009
DYNAMICAL PHENOMENA IN THE ATMOSPHERE OF IRAS 22272+5435
decrease of the AGB mass-loss rates until the pulsation period of 50 days in the fundamental mode is reached. The mass-loss rates beyond the AGB are crucial parameters for evolutionary timescales, therefore time series are required for other cool pulsating PPNs to clarify the post-AGB mass-loss process. J.S. thanks the Steward Observatory for providing observing time on the 2.3 m and 1.6 m telescopes. This research was partly financed (for L.Z.) by the Latvian Council of Science (grant 05.1863). The collaborative program between Polish and Latvian Academy of Sciences is acknowledged for support. REFERENCES Arkhipova, V. P., Ikonnikova, N. P., Noskova, R. I., & Sokol, G. V. 2000, Astron. Lett., 26, 609 Bakker, E. J., van Dishoeck, E. F., Waters, L. B. F. M., & Schoenmaker, T. 1997, A&A, 323, 469 Bl¨ocker, T. 1995, A&A, 299, 755 Fokin, A. B., Lebre, A., Le Coroller, H., & Gillet, D. 2001, A&A, 378, 546
L207
Freytag, B., & H¨ofner, S. 2008, A&A, 483, 571 Hrivnak, B. J., & Bieging, J. H. 2005, ApJ, 624, 331 Hrivnak, B. J., & Kwok, S. 1991, ApJ, 371, 631 Hrivnak, B. J., Kwok, S., & Geballe, T. R. 1994, ApJ, 420, 783 Hrivnak, B. J., & Lu, W. 2000, in IAU Symp. 177, The Carbon Star Phenomenon, ed. R. F. Wing (Dordrecht: Kluwer), 293 Hrivnak, B. J., & Lu, W. 2007, in ASP Conf. Ser. 378, Why Galaxies Care about AGB Stars, ed. F. Kerschbaum et al. (San Francisco, CA: ASP), 303 Kurucz, R. L. 1993, CD-ROM No. 13, SAO Nowotny, W., et al. 2005, A&A, 437, 273 Pollard, K. R., Cottrell, P. L., Kilmartin, P. M., & Gilmore, A. C. 1996, MNRAS, 279, 949 Pollard, K. R., & Lloyd Evans, T. 2000, AJ, 120, 3098 Pollard, K. R., et al. 1997, MNRAS, 286, 1 Reddy, B. E., Bakker, E. J., & Hrivnak, B. J. 1999, ApJ, 524, 831 Reddy, B. E., Lambert, D. L., Gonzalez, G., & Yong, D. 2002, ApJ, 564, 482 Szczerba, R., et al. 1997, A&A, 317, 859 Tuchman, Y., L´ebre, A., Mennesier, M. O., & Yarri, A. 1993, A&A, 271, 501 Ueta, T., et al. 2001, ApJ, 557, 831 Upgren, A. R., Sperauskas, J., & Boyle, R. P. 2002, Baltic Astron., 11, 91 Zaˇcs, L., Klochkova, V. G., & Panchuk, V. E. 1995, MNRAS, 275, 764 Zaˇcs, L., et al. 2005, A&A, 441, 303