Dynamics of Platform-based Product Development Hazhir Rahmandad Ph.D. Candidate, Sloan School of Management, M.I.T E53-364A, 30 Wadsworth Ave., Cambridge, MA 02142 617-253-3865;
[email protected] Abstract Product development (PD) is a crucial capability for firms in competitive markets. Building on case studies of software development at a large firm, this paper explores the interaction among the different stages of the PD process, the underlying architecture of the product, and the products in the field. We introduce the concept of the “adaptation trap,” where intendedly functional adaptation of workload can overwhelm the PD organization and force it into firefighting (Repenning 2001) as a result of the delay in seeing the additional resource need from the field and underlying code-base. Moreover, the study highlights the importance of architecture and underlying product-base in platform-based product development, through their impact on quality of new models under development, as well as resource requirements for bugfixing. Finally, this study corroborates the dynamics of tipping into firefighting that follows quality-productivity tradeoffs under pressure. Put together, these dynamics elucidate some of the reasons why PD capability is hard to build and why it easily erodes. Consequently, we offer hypotheses on the characteristics of the PD process that increase its strategic significance and discuss some practical challenges in the face of these dynamics.
1
Introduction Firm performance and heterogeneity is a central topic of interest for researchers and practitioners alike. According to the resource-based view of strategy, it is important to look inside the firm for capabilities that distinguish it from its competitors (Wernerfelt 1984; Barney 1991; Peteraf 1993) and enable the firm to gain rents. A capability should be valuable, rare, unimitable, and un-substitutable (Barney 1991) so that it can contribute to sustained competitive advantage. Researchers have suggested several broad explanations for why some capabilities elude imitation and replication. Barney (1991) offers three main factors that result in unimitability: history dependence, causal ambiguity, and social complexity. Dierickx and Cool (1989) note that capabilities are stocks, and consequently discuss time compression diseconomies, asset mass efficiencies, interconnectedness of stocks, asset erosion time constants, and causal ambiguity as the main reasons why capabilities are hard to imitate. Finally, Amit and Schoemaker (1993) suggest uncertainty, complexity, and organizational conflict as the main factors that create heterogeneity in managerial decision-making and firm performance. While these general explanations are important starting points, the resource-based literature has not provided a detailed and grounded understanding of the capability evolution that it suggests underlies the barriers to imitation (Williamson 1999). Opening the black-box of capability is required for recognizing a capability independent of performance measures it is supposed to explain, and for proposing testable hypothesis about relative importance of different capabilities. Such understanding would not only strengthen the resource-based view theoretically; it is also needed to enhance the practical usefulness of the framework. A few theoretical perspectives elaborate on barriers to imitation by discussing the factors that hinder formation of successful strategies through adaptive processes. Leonard-Barton (1992) introduces the concept of core rigidity, where routines underlying firm’s capabilities resist change when the environment demands adoption of new capabilities- for example, in the face of architectural innovations (Henderson and Clark 1990). The organizational learning literature highlights a similar barrier to learning, competency traps (Levitt and March 1988), where accumulated experience with old routines reduces their operating cost and makes the new, potentially superior, practices less rewarding. Finally, the complexity of imitation is elaborated on through theoretical models of adaptation on rugged fitness landscape (Levinthal 1997; Rivkin 2001). This view of adaptation suggests that interdependency and interaction among the different elements of the firm strategy (Milgrom and Roberts 1990) creates multiple local peaks in the landscape of fit between the organization’s strategy and the environmental demands, making it hard for the firm to achieve new combinations of strategic fit through incremental adaptation. More recently, a few empirical studies have enriched the understanding of the nature of capabilities and their dynamics. Henderson and Cockburn (1994) discuss how component and architectural competence contribute to research and development productivity of pharmaceutical firms. An intra-firm evolutionary perspective has been developed (Burgelman 1991; Lovas and Ghoshal 2000) which views the evolution of strategies as processes of random variation and selection inside a firm, and several case studies have elaborated on this perspective. (See the special issue of Strategic Management Journal on evolutionary perspectives on strategy, Summer 1996.) Finally, a few studies explore the nature and dynamics of organizational capabilities in different industries, including banking, semi-conductors, automobiles, communications, pharmaceuticals, and fast food (Dosi, Nelson et al. 2000).
2
These studies highlight that the complexity of capabilities resides in their evolution through time and the path dependence in these dynamics. In this paper, drawing on two in-depth case studies of the software development process, we propose a grounded theory of why successful product development (PD) capability is hard to establish, and easily erodes when established. Using the case study method (Eisenhardt 1989), combined with dynamic simulation modeling (Forrester 1961) (See Black, Carlile et al. (2004) for a detailed description of the method), we develop a fine-grained and internally consistent perspective on platform-based PD capability: how it operates through time, and why it is hard to sustain. Through this theorybuilding practice we follow a tradition of using the micro-foundations of behavioral decision theory to explain a phenomenon of interest in strategy (Zajac and Bazerman 1991; Amit and Schoemaker 1993): operation and erosion of capabilities. Our results show 1) how the long-term consequences of quality and productivity adjustment under pressure can deteriorate product development capability, 2) how the adaptation trap makes it hard for organizations to sustain an efficient product development process, and 3) how continuity in product base and architecture reinforces these dynamics. Context of Study: Platform-based PD in the Software Industry Product development is often highlighted as the prime example of a dynamic capability (Eisenhardt and Martin 2000; Winter 2003). By creating innovative products that fulfill unmet market needs firms can create competitive advantage. Moreover, moving into new product markets through successful product introduction enables firms to change their strategic orientation; for example, Hewlett-Packard changed from an instruments company to a computer company through product development (Burgelman 1991). In addition, since dynamic markets demand continuous introduction of new products, companies in these markets cannot find a substitute for the product development capability. The practice of new product development has changed in many ways. While new products were once developed separately, platform-based product development is gaining prominence in high-speed competitive markets (Sanderson and Uzumeri 1997; Cusumano and Nobeoka 1998; Gawer and Cusumano 2002). Platform-based product development entails building a central set of components around which new products in a product family are developed. Each new model of the product adds a few new features to the existing architecture and product base. This process has several benefits, since it allows the firm to get the first product to the market faster and with less resources; it provides for learning about market and internal processes from one model to another; it allows for other players in the market to build around the central platform, thereby creating positive externalities for a product line (Gawer and Cusumano 2002); and it enhances competitiveness by increasing control over the pacing of product introduction (Eisenhardt and Brown 1998). For example, Palm currently has three major product families for the PDA market: Zire, Tungsten, and Treo. Each product family has had different product releases/models shaped around a specific platform. For example, the Treo platform combines features of cell phone and classical PDA, and each new model has included new features, e.g., still camera, MP3 player, and video camera. Most software products have traditionally followed the principles of the platform-based development process, even though using a different vocabulary. In the software
3
industry each new release (=model1) of a product (= product family) builds on the past releases by adding new features to the current code base (= product base). This multiple release (= platform-based) development strategy operates across most common software products we use, from operating systems (e.g., Mac OS, Windows, DOS) to different applications (e.g., MS Excel, Matlab, Stata). Compared to single-product development, platform-based product development brings more continuity across multiple releases of a product, since not only do different releases share design and development resources, but they also have similar pools of customers, the same architecture, and a similar product base. These connections among different models highlight the importance of an integrative view of product development which encompasses the dynamics across multiple releases of a product family. While there is a rich literature looking at product development (PD) in general (see Brown and Eisenhardt (1995) and Krishnan and Ulrich (2001) for reviews) and recent body of work on platform-based PD is growing (e.g., (Sanderson and Uzumeri 1995; Meyer, Tertzakian et al. 1997; Cusumano and Nobeoka 1998; Muffatto 1999; Krishnan and Gupta 2001), there has been little research on the dynamics of the platform-based product development process. This gap is also observable in the literature on project dynamics. There is a rich set of studies discussing single-project dynamics (e.g., (Cooper 1980; AbdelHamid and Madnick 1991; Ford and Sterman 1998). These studies have introduced the concept of the rework cycle and have discussed several different processes, including the effect of pressure on productivity and quality, morale, overtime, learning, hiring and experience, phase dependency, and coordination, which endogenously influence the performance of different projects. However, with the exception of Repenning’s work (2000; 2001), little attention has been spent on the dynamics when consequent product models are developed by the same development organization. Repenning (2000; 2001) looks at multiple-project R&D systems and discusses tipping dynamics that follow resource allocation between the concept design and development phases of a PD process. He shows that there potentially exist two equilibria with low and high efficiency for the PD organization, and a tipping point (a state of the system at which the behavior changes significantly) between the two. These results, however, rely on the assumption that development gets higher priority and that concept design adds enough value through avoiding future errors in development to justify it on efficiency grounds. Moreover, this work fails to consider the quality considerations of the product development when the product is out of the PD organization. In this study we focus on the dynamics of platform-based product development with an emphasis on the effects of products in the field and the architecture and product-base. As a result, we take into account the continuity between different releases of a product. Moreover, we focus our analysis on dynamics that make it hard to build and sustain the efficient PD capability that is crucial to the success of a firm in competitive markets. The software industry fits well as the setting for this study. In the absence of production and distribution barriers, product development is the major part of the software business. On the other hand, the rapid pace of change in software industry makes it a great example of a dynamic market. Therefore the product development is a crucial dynamic capability for a software firm. To differentiate the firm’s performance from that of its competitors, a software firm needs a 1
Throughout the text we use these terms interchangeably. We tend to use the software vocabulary when talking specifically about the two case studies, and use the general terms when discussing the implications for platformbased PD in general.
4
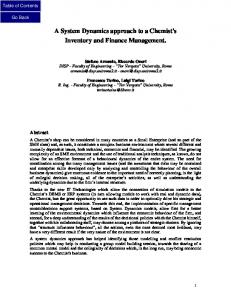
strong PD capability that can produce products with more features, faster, and more cheaply than the competitors. Moreover, despite the importance of PD capability in this industry, software development projects often cost more than budgeted, stretch beyond their deadlines, and fall short of incorporating all their desired features (for a meta-survey see (Moløkken and Jørgensen 2003)). Cost and schedule overruns in software projects have persisted for over two decades, despite significant technological and process improvements, such as object-oriented programming, iterative and agile development, and product line engineering, among other things. The challenge of learning to successfully manage software development is therefore non-trivial. Yet this challenge is not insurmountable: Modest improvements in project measures (see Figure 1) and development productivity (Putnam 2001) are observable in a long time horizon. Furthermore, the size and complexity of software development projects are considered mediumrange (average size of about 100 person-months (Putnam 2001; Sauer and Cuthbertson 2004)) allowing for an in-depth look at all the components of the PD process. Finally, there is a rich literature on the software development process, including some of the pioneering work in applying simulation models to project dynamics (AbdelHamid and Madnick 1991). We can therefore build on this literature for the research at hand. IT Project Performance 100% 90% 80% 70% 60%
Failed Challenged Succeeded
50% 40% 30% 20% 10% 0% 1994
1996
1998
2000
2002
Source: Standish Group Surveys
Figure 1- The performance of IT projects in the U.S. based on the bi-annual survey of the Standish Group. Data is based on 8380 projects, mostly software development. Succeeded includes projects that were on-time and on-budget. Failed group includes projects that were never finished, and challenged group includes the rest. The data is compiled from different sources on the Standish Group surveys, including their 1995 and 2001 surveys which are available at their website: http://www.standishgroup.com/index.php.
5
Data Collection This study uses interviews and archival data from two product development teams in a single software organization (Hereafter called Sigma) to build a dynamic simulation model of platform-based product development. Sigma is a large IT company with over 16,000 employees and several lines of products in hardware and software, which are distributed in multiple locations around the world. In recent years the company management has decided on a strategic shift towards the software side of the business and therefore strong emphasis is put on the success of a few promising software products. The study was supported by the research organization of the company, which was interested to learn about the factors important to the success or failure of software projects. We were given complete access to internal studies and assessments conducted within Sigma. Moreover, one of the research personnel who was familiar with several software projects in the company helped us both with connecting with the two cases we studied and with the data-gathering effort. We studied closely the development of two products, Alpha and Beta. The two cases were selected because they had significantly different performance on the quality and schedule dimensions, despite similarities in size and location. Despite a promising start, Alpha had come to face many quality problems and delays while Beta’s releases were on-time and had high quality. Comparing and contrasting the processes in effect in two cases provided a rich context to build a model capturing the common processes across two projects with different outcomes, therefore helping shed light on how similar structures can underlie different outcomes. Seventy semi-structured interviews (by phone and in person, ranging between 30 to 90 min.) and archival data gathered in three months of fieldwork in Sigma inform this study. Moreover, the first author participated in a few group meetings in the organization that focused on the progress of products under study. The study is part of a longer research involvement with the company; therefore, we continued to gather additional data and corroborate on different themes after the three months of major fieldwork. These efforts included 20 additional interviews and a group session which elicited ideas from 26 experienced members of the organization. The interviews included members of all functional areas involved in development, services, and sales, specifically architects and system engineers, developers, testers, customer service staff, sales support personnel, and marketing personnel, as well as managers up to two layers in several of these areas. Interviewees were given a short description of the project, were asked about their role in the company and the process of work, and then they discussed their experiences in the development of respective products. Data Analysis Interviews were recorded and a summary of each interview was created soon after the interview session. We used this information to build a simple model of how the mechanics of the development process work. Moreover, in each interview we searched for factors contributing to quality and delay issues and looked for corroborations or disagreements with old factors. Based on these factors and the observations on the site we generated several different hypotheses about what processes contribute to, or avoid, delay and quality problems in development of Alpha and Beta. We then narrowed down the list of hypotheses into a core set based on what themes were more salient in the interviews and in the history of the products. This core set of dynamic hypotheses created a qualitative theory to be formally modeled using the system dynamics modeling framework (Forrester 1961; Sterman 2000).
6
The model allows us to understand the relationship between the process of product development and the behavior of a PD organization. Using sensitivity analysis and different simulation experiments, we learned about the dynamic consequences of interaction between the mechanics of product development and decision-rules used to allocate resources and manage the system. In the rest of the paper, we use the simple simulation model to explain why creating, managing, and sustaining platform-based product development processes is difficult. More specifically, we explain why PD capability in these settings can erode through random environmental shocks and adaptation, and describe the role of product architecture and feedback from the product in the field in the erosion of PD capability. Next, we provide a brief description of the software development process in the two cases studied. In the following section, the simple model of multiple-release product development is introduced and the dynamics of interest are discussed in detail. Overview of Development Process for Alpha and Beta In Sigma, we studied the development of two products closely. Both products are customer relationship management (CRM) solutions (or part of a CRM solution) and follow similar general processes of software development, as described below. The development process described here is for one release of a product; however, usually a new release is well underway when the current release is launched into the market. Therefore the different phases of development overlap with each other for different releases. The software development process includes three main phases. These phases can be followed in a serial manner (waterfall development) or iteratively. Sigma development organization followed a largely waterfall approach, with some iterative elements. In the concept design phase, the main features of the product are determined, the product architecture is designed, and general requirements for developing different pieces of code are created. For example, a new feature for the next release of a call-center software can be “linking to national database of households and retrieving customer information as the call is routed to a customer service agent.” Software architects decide the method by which this new capability should be incorporated into the current code, which new modules should be written, and how the new code should interact with current modules of code. Consequently a more detailed outline of the requirements is developed that describes the inputs, outputs, and performance requirements for the new modules, as well as modifications of the old code. The next step of software development process is developing the code. This is usually the most salient and the largest share of the work. In this step, software engineers (developers) develop the new code based on the requirements they have received from the concept design phase. The quality of the development depends on several factors including the skills of individual developers, complexity of the software, adherence to good development practices (e.g., writing detailed requirements and doing code reviews), quality of the code they are building on, and quality of the software architecture (MacCormack, Kemerer et al. 2003). Some preliminary tests are often run in this stage to insure the quality of the new code before it is integrated with other pieces and sent to the quality assurance stage. Quality assurance includes running different tests on the code to find problems that stop the software from functioning as desired. Often these tests reveal problems in the code that are referred back to developers for rework. This rework cycle continues until the software passes most of the tests and the product can be released. It is important to note that not all possible
7
errors are discovered during testing. Often tests can cover only a fraction of possible combinations of activities for which the software may be used in the field. Therefore, there are always some bugs in the released software. When the software is released, new customers buy and install it and therefore require service from the company. The service department undertakes answering customer questions and helping them use the software efficiently, as well as following up on bugs reported by customers, and referring these bugs to the research and development organization. These bugs need to be fixed on the customer site through patches and ad hoc fixes if they are critical to customer satisfaction. Current-Engineering (CE) is the term used for this activity of creating short-term fixes for bugs on a specific customer site. CE is often undertaken by the same part of the organization that has developed the code, if not by the same pool of developers. If the bugs are not critical, they can be fixed in later releases of the software. In this article Bug-Fixing refers to the activity of fixing problems discovered from old releases in the new release of the product and therefore is different from CE. Consequently bug-fixing usually competes with addition of new features to the next release. The development, launch, and service activities discussed above focus on a single release (version) of the software. However, different releases are interconnected. First, different versions of software build on each other and therefore they carry over the problems in code and architecture, if these problems are not fixed through bug-fixes or refactoring of the architecture, (Refactoring is improving the design and architecture of the existing code.) Moreover, the sharing of resources between development and CE means that the quality of past releases influences the resources available for the development of the current release. Products Alpha and Beta share the general processes as discussed above. Product Alpha is a Customer Relationship Management (CRM) software which has been evolving for over 8 years. The research and development team working on Alpha has fluctuated at about 150 fulltime employees who work in five main locations. This product has gone through a few acquisitions and mergers; its first few releases have led the market; and it has been considered a promising, strategic product for the company. However, in the past two years, long delays in delivery and low quality have removed it from leadership position in the market. In fact, the recent low sales have cast doubt on its viability. Product Beta is part of a complicated telecommunication switch that is developed largely independent of the parent product but is tested, launched, and sold together with the parent product. Beta includes both software and hardware elements and the majority of its over-80person R&D resources focus on software part. Beta is also located across multiple locations with four main sites, three of which overlap with Alpha product. Beta has had exceptionally good quality and timely delivery consistently through its life. Nevertheless, in two cases in its history, Beta had to delay a release to keep a synchronized release plan with the parent product which was delayed. Model and Analysis In this section we build a simple model of the multiple-release product development process, in which the interactions among quality, productivity, and resource requirements for products in the field and for maintenance of the old code are analyzed. We build and analyze the model in three steps. First, a very simple model is developed to look at the productivity and quality tradeoff in the development phase of the PD process. After analyzing this simple model, we build into it a simple structure to represent what happens when the product is introduced into
8
the field and the dynamics that follow. Finally, we add the architecture and underlying codebase and analyze the full model. The model is built based on the observations of PD processes described in the previous section. Therefore the decision-rules are modeled based on the observation of individuals’ decision-making and action in practice, rather than theoretical or normative assumptions such as rationality. Consequently the formulations of the model follow the tenets of behavioral decision theory (Cyert and March 1963) and bounded rationality (Simon 1979) as applied to simulation models (Morecroft 1983; Morecroft 1985). Development Sector: Tipping point in productivity and quality tradeoff Development of a new release of a software product entails adding new features to existing release or developing all the new features for the first release. In the same fashion, the new car from an existing model has some new features added or modified on the existing platform and a new version of a personal organizer builds on the last version with a few modifications and additional features. Demand for New Features2 usually comes from market research, customer focus groups, benchmarking with competitors, and other strategic sources, with an eye on internal innovative capabilities of the firm. In the case of the software products studied, new features are proposed by sales, services, and marketing personnel, as well as product managers who are in charge of finding out about what is offered by the competition and what is most needed by the potential customers and prioritizing these features to be included in the future releases. Therefore the demand for new features largely depends on competitive pressures and factors outside the direct control of the R&D department, even though the product managers have some flexibility in selecting and prioritizing among hundreds of features that can be included in a new release (See Figure 2). The proposed features to be added in future releases accumulate in the stock of Features Under Development until they are developed, tested, and released in the market to become part of the Features in Latest Release of the software. Feature Release rate determines how fast the PD organization is developing and releasing new features and therefore how often new releases are launched. The quality of the new release depends on the Defects in Latest Release, which accumulates Defect Introduction Rate as defects in the designed product go into the market. Figure 2 shows how these variables represent the flow of tasks and the defects in the product. Formally, the stocks (boxes) represent the integration of different flows (thick valves and arrows), for example Features Under Development is the integral of Feature Addition minus Feature Release. Appendix A details the equations of the model.
2
The names of variable that appear in the model diagrams are italicized when they are first introduced.
9
Demand for New Features
Features Under Development
Feature Release
Features in Latest Release
Defects in Latest Release Defect Introduction
Figure 2- The basic stock and flow structure for platform-based new product development. Demand for New Features accumulates in the stock of Features Under Development until they are developed and transferred into the Features in Latest Release through Feature Release. Strong product development capability in this setting translates into getting the highest rate of Feature Release given a fixed level of development resources. Companies that can sustain such high rates of features release will have a competitive advantage through having some combination of more features in their new releases, faster release times, and lower cost of product development. In its simplest form, Feature Release (FR) depends on the amount of resources available for development (RD), the productivity of these resources (P) and the quality of their work (i.e., fraction of accomplished work that passes the quality criteria). This fraction depends on two main factors, the quality of work, represented by the fraction of developed features that are defective (Error Rate: e), and the comprehensiveness of testing and quality assurance practices, represented by the fraction of errors discovered in testing (frT). Therefore the fraction of work that is accepted is one minus the fraction of work rejected or frA=1-e*frT. Consequently Feature Release can be summarized as: FR=RD*P*(1-e*frT) (1) Here we measure the development resources (RD) as the number of individuals working on development of new features. Productivity (P) represents how many features a typical developer can create in one month and depends on several factors including the skill and experience of individual developers, the quality of design and requirements for the development, the complexity of the code to be developed, the development process used (e.g., waterfall vs. iterative) and the availability of different productivity tools. Similarly, Error Rate (e) depends on several factors including the quality of design and detailed requirements, complexity of architecture, the scope of testing by developers (before the official testing phase), code reviews and documentation, development process used, and the pressure developers face, among other things. Finally, the fraction of errors caught in testing (frT) depends both on comprehensiveness and coverage of test plans as well as on the quality of execution of, and follow-up on, testing. What creates the dynamics in a product development process is the fact that resources, productivity, quality, and testing are not constant, but often change through the life of a product development organization working on multiple releases of a product. While exogenous changes in these variables (e.g., economic downturn results in a lay-off and a reduction in available resources) are important, they add little insight into internal dynamics of the PD processes and offer little leverage for improvement. Therefore here we focus on those changes which are endogenous to the PD process, for example how resource availability changes because of the
10
quality of past releases. In what follows we expand the model to capture some of the main endogenous effects (feedbacks) and analyze the results. A central concept for understanding the capability erosion dynamics is the balance between resources available and resources required for finishing a release on schedule. This can be operationalized as Resource Gap (RG), the ratio of typical person.months of work required to finish the development of pending Features Under Development by a scheduled date, to available person.months until that date. Therefore the Resource Gap is a function of three variables: how many features are under development, how much time the PD organization is given to develop these features, and how many development resources are available to do this job (See the exact equations in Appendix A). In the analysis of the determinants of the resource gap, we can distinguish between Features Under Development that change endogenously due to model dynamics, versus the time given for development and the resources available, which are mainly managerial policy levers. Therefore we keep the resources available and the time to develop the pending features constant when discussing the model dynamics in the absence of policy interventions. Resource Gap is a measure of pressure on the development team and therefore we use them interchangeably. The resource gap can be managed through controlling the amount of resources available or the scheduled finish date. If pressure is consciously controlled, the desired impact of increasing schedule pressure is to increase the productivity of developers so that the gap between available resources and desired resources can be closed. In fact in the case of software engineering, it is estimated that under pressure people can work as much as 40% faster (AbdelHamid and Madnick 1991) All else being equal, this balancing loop (Work Faster loopsee Figure 3) enables development teams to accomplish more work than in the absence of pressure and potentially meet a challenging schedule. Managers commonly use this lever to increase the productivity of the development process, as reflected in the comments of a program manager: “The thinking that [a higher manager] had, and we think we agree with this, is that if your target is X and everybody is marching for that target, you fill the time for that target. If you are ahead of the game, people are probably going to relax a little bit: because we am ahead of the game, we don't need to work so hard, we can take a longer lunch, we can do whatever; and guess what: Murphy's law says you now won't make that target. So […] you shoot for X minus something, you drive for X minus something so that you build in on Murphy’s law to a point.” However, there is a negative side to increasing work pressure. As pressure increases and developers try to work faster to meet the schedule, they start to make more errors. This happens because under pressure they take shortcuts, for example by less detailed requirement development, little documentation of the code, lack of code review, and poor unit testing (See (MacCormack, Kemerer et al. 2003) for a quantitative analysis of effect of different practices on quality and productivity). Moreover, the stress induced by pressure can increase their error rate and further erode the quality. Higher Error Rates surface in a few weeks when the code goes into the testing phase, resulting in the need for more rework. Consequently rework increases the amount of work to be done and therefore the pressure, closing a potentially vicious, reinforcing cycle (Rework LoopFigure 3). The error rate-productivity trade-off discussed above is well documented for a single project in different domains, from software development to construction (Cooper 1980; AbdelHamid and Madnick 1991). These effects were also salient in Alpha and Beta, for
11
example developers in Alpha found little time to engage in process work that was supposed to enhance the quality of the product, such as doing code reviews and making detailed requirement plans. The strength of trade-off between pressure and quality depends not only on individual skills and experience, but also on the development process and incentive structure at place in the PD organization. For example in Alpha, the quality of development was hardly transparent to management at the time of development, therefore under acute pressure, developers had more incentive to forgo good practices and sacrifice quality to increase the speed of development. In the simple model, we aggregate the effects of pressure on productivity and quality in two simple functions. FP(RG), the effect of Resource Gap (RG) on productivity, changes the productivity around a normal level, PN, so that P=PN* FP(RG). Similarly, Fe(RG) represents the effect of Resource Gap on Error Rate and therefore Error Rate changes around its normal value eN: e=eN*Fe(RG). Substituting in Equation (1) we can see how Feature Release depends on Resource Gap: FR= FR=RD* PN* FP(RG)*(1- eN*Fe(RG)*frT) (2) The exact behavior of this function depends on the shape of FP and Fe and therefore on the strength of the two effects, but in general both functions are upward sloping (increase in Resource Gap increases both Productivity and Error Rate) and both saturate at some minimum and maximum levels (Productivity and Error Rate cannot go to infinity or below zero). The qualitative behavior of the system, however, depends only on the general shape of the Feature Release with respect to different levels of Resource Gap. An upward sloping function suggests that the higher the pressure, the higher the output of the development process is (although this can be at odds with quality if a poor testing system lets the defects to go through). A downward sloping function suggests that the least pressure is needed to get the best performance out of the system, since by adding to the Resource Gap, the system performance (Feature Release) deteriorates. Finally, a more plausible shape is inverse-U shape, where up until some level of Resource Gap people will work harder and make more progress, but above that level the increase in pressure is actually harmful since people start to take shortcuts that harm the quality significantly and therefore developers end up reworking their tasks and therefore releasing fewer acceptable features on average. Figure 3 illustrates the causal relationships between Resource Gap, productivity, Error Rate, and Feature Release. Two feedback loops of Work Harder and Rework are highlighted in this picture. Work Harder loop suggests that an increase in the Features Under Development increases the demand for resources and therefore the Resource Gap. As a result productivity increases and the PD process releases more new features, reducing the stock of Features Under Development (hence Work Harder loop is balancing (B)). The Rework loop highlights the fact that in the presence of more features to be developed and higher pressure, people take shortcuts and work with lower quality, therefore increasing the Error Rate and consequently the amount of rework needed to fix those errors. This results in slower Feature Release and therefore potentially higher Features Under Development (Hence Rework loop is reinforcing (R)). Assuming the more plausible inverse-U shape for the outcome of the tradeoff between these two loops, the total effect of Resource Gap on output of PD can be categorized into two regions. For lower levels of Resource Gap and pressure, an increase in Features Under Development (and therefore pressure) has a desirable net gain, i.e., the PD organization will produce more. However, above some threshold of Resource Gap, the relationship inverses, that is, the PD organization will produce fewer new features as a result of an increase in the pressure.
12
Feature Release
Effect of Pressure on Productivity
+ Productivity
B Work Faster
+ Resource Demand for Development +
Available Resources
Resource Gap (Pressure) -
+
Feature Release
Features in Latest Release
-
R Rework
Error Rate +
Resource Gap
Effect of Pressure on Error
Demand for New Features
Features Under Development
Figure 3- The basic structure of development process and tradeoffs between effects of Resource Gap on Error Rate and productivity. The graphs show the shape of these two effects, both increasing as more pressure is added. The Feature release vs. Resource Gap graph shows the aggregate result of pressure on Feature Release for eN=0.4 and frT=0.9. The values on the axes are not shown since the qualitative shapes of the functions are what matter in the analysis. The dynamics that emerge from this simple model can be best shown through an example. First imagine a PD organization which is in equilibrium, i.e., there is a fixed, constant demand for new features coming into the organization, and the development team is able to meet this load, and therefore Feature Release equals the demand for new features. What happens if we perturb the PD organization with a transient increase in workload, through additional demand for new features? An example of such perturbation is a set of unplanned, new features that the higher management asks the development team to incorporate into the next release, beyond the current workload. Figure 4 portrays the two possible outcomes of such perturbation. In Figure 4-a (left), the PD organization is working by developing six new features each month, until time ten, when the demand increases to ten features per month and continues to be so for four month. During this time, the additional demand results in more Features Under Development and therefore higher levels of Resource Gap. This additional pressure in fact increases the overall Feature Release over the equilibrium value, since the increase in the productivity is bigger than the negative effect of the higher Error Rate. Consequently, after the short-term additional demand is removed (feature demand goes back to six), the PD organization continues to release more new features than demanded, and therefore is successful in bringing the stock of Features Under Development back to its equilibrium value.
13
150
Feature Demand 15
Feature Demand
11.25
125
Features Under Development
11.25
Feature Release
7.5
100
7.5
3.75
75
Features Under Development
3.75
Feature Release
0
50
0
10
0 20
30
40
50
Time (Month)
60
70
0
10
20
30
40
50
60
70
Time (Month)
Figure 4- The reaction of PD process under a pulse of increased demand for features. The pulse lasts for 4 months and increases the feature demand (red), Features Under Development (blue) represents the features demanded by market but not yet developed. Feature release (green) represents the output of the PD process. Figure 4-a on the left hand side, represents a case where additional pressure introduced by the pulse is managed through faster work and the Features Under Development is moved back to its equilibrium level. Figure 4-b, shows how the PD organization fails to accommodate a slightly stronger pulse, resulting in erosion of PD capability as the Feature Release drops down and stays low. Now consider the same experiment with a slightly stronger perturbation (e.g., demand going to 13 rather than 10). This time we observe a dramatic shift in the performance of the simulated PD organization. In the new state, which, following Repenning (Repenning 2001) we call Firefighting, the Feature Release fails to keep up with demand and in fact goes down, the Features Under Development grow higher and higher since demand continues to exceed release, and in short the PD organization moves into a mode of being excessively under pressure, being behind the market demand, and developing fewer new features than they used to in the initial equilibrium. What creates such dramatic shift in behavior, for addition of just a few features to the workload?
14
Features Under Development
Feature Demand And Release
15
Maximum Capacity
Feature Release
Tipping Point
Feature Demand
Stable Equilibrium
Initial Pressure
Tipping Pressure
Resource Gap
Figure 5- Schematic inverse-U shape curve of Feature Release as a function of Resource Gap. The picture highlights the stable equilibrium (where the feature demand meets the upward sloping part of the curve), the tipping point (where the feature demand meets the downward sloping part of the curve), and the maximum capacity (where the curve reaches its maximum). A graphical representation of dynamics helps illuminate this question better. Figure 5 shows an inverse-U shape curve that relates Resource Gap to Feature Release. The equilibrium level of feature demand is represented by a horizontal line. Initially the system is in equilibrium at the point marked by stable equilibrium: the Resource Gap is at a level at which Feature Release equals feature demand, and therefore the Features Under Development does not change and the system remains in equilibrium. If the system is perturbed by a small pulse (reduction) in demand, the Features Under Development increase (decrease). Hence the Resource Gap increases (decreases) to a value right (left) of the stable equilibrium point, and that results in values of Feature Release higher (lower) than feature demand. As a result, the Features Under Development decrease faster (slower) than increase, and the stock goes down (up), reducing (increasing) the Resource Gap until the system gets back to the stable equilibrium. The arrows on the curve represent the direction towards which the system moves: for small perturbations in work or schedule pressure the system adjusts itself back into the stable equilibrium. However, there is threshold of Resource Gap, the tipping pressure (see the Figure 5), over which the systems behavior becomes divergent. An increase in the Resource Gap over the tipping pressure results in Feature Release values lower than feature demand. Therefore the stock of Features Under Development keeps growing, exerting further counterproductive pressure; hence the rework loop works in its vicious direction and the PD capacity goes down with no recovery. Now we can address the difference between the first and the second experiment. In the first experiment, the initial perturbation brought the Resource Gap to the right of the stable equilibrium but just short of passing the tipping point. Therefore the simulated PD organization was able to recover by working faster, producing more, and reducing the pressure. However, the perturbation in the second experiment pushed the Resource Gap over the edge and beyond the tipping point. The PD organization was caught in a cycle of working harder, making more errors, spending more time on rework, and sensing more pressure under the unrelenting market demand. 15
Note that tipping point is different from the point at which we achieve the maximum development capacity (See Figure 5). Tipping point is where the feature demand and Feature Release meet on the downward sloping part of the release-pressure curve, while the maximum Feature Release is achieved at the pressure which maximizes this curve. As a result, the Tipping Pressure, as well as the stable Equilibrium Pressure, depend on the feature demand. Changing feature demand shifts the tipping point and stable equilibrium because it shifts the horizontal demand line on the curve, bringing them closer to (by more demand) or further from (by less demand) each other and the maximum capacity. The shift in tipping point and stable equilibrium highlights an important tradeoff between a PD organization’s operating capacity and its robustness. We can design more new features by accepting a higher demand rate (e.g., through taking more tasks on in the project planning for a new release), but that brings the stable equilibrium and the tipping point closer, and therefore the PD organization can tip into the firefighting mode more easily. For example, an unexpected demand by higher management, a technical glitch, or departure of a few key personnel can tip the system into firefighting mode. In the extreme, we can get the maximum output from the PD organization by demanding features at the maximum capacity rate. In this case we bring the stable equilibrium to the tipping point and therefore the system is at the tip of the slippery slopes into firefighting. While highly productive, such a system can easily fall into the firefighting trap in the face of small unexpected perturbations in the environment of the PD work. The dynamics discussed in this section look only at the development part of PD process. Therefore they do not account for the quality consequences of the features designed, when they go outside of the PD organization. This is not a good assumption and has unrealistic conclusions, e.g., the PD organization is better off to reduce its testing goals, since that way it does not find the defects in the features designed, and consequently does not need to do any rework, avoiding firefighting, and increasing the capacity (in simple terms, ignorance is bliss). In the next two sections we expand the model to account for two important consequences of the quality of PD work, and the dynamics that pursue. Current engineering: shifting capacity and creating an adaptation trap New features which are introduced into the market through new releases have important effects for the product development organization. First, there is a demand for customer support and services. The service organization, which is often different from the R&D unit (as is the case in Sigma) is in charge of direct interaction with these customers. However, if service people are unable to solve a customer issue, the customer call is transferred to the R&D department. These transfers (called escalations in the company) can arise because of complexity of the software, but also because some defect in the code has created an unexpected issue in the client site. When such defects are found, the development team often needs to decide on their fate. If the problem is interfering with important needs of customer, R&D personnel are allocated to fix the problem, usually through quick, customized patches at the customer site. This activity is referred to as current engineering (CE) and can take a significant share of R&D resources. In fact in the product Alpha, 30-50 percent of development resources were allocated to CE work. Current engineering is not the only connection between the PD organization and the product in the field. Initial installation of the product also requires PD resources, therefore a product design that facilitates quick, smooth installation can save the PD organization from
16
installation challenges. However, improving installability and serviceability of the product gets lower priority when important new features should be added to keep up with the market demand. A more subtle, and potentially more important, feedback of field performance is through sales level and its influence on resource allocation across a portfolio of products. Delays and quality problems that identify a PD organization in trouble often reduce customer satisfaction and sales for a product. Since resource allocation across different product lines in the portfolio often correlates with the success of the product in the field, i.e. its sales pattern, poor quality and sales can cost the PD organization its resources for development of future releases. This effect of product performance in the field on resources given to a product line depends on resource allocation policies, regardless of product characteristics. This section focuses on modeling and analyzing the effect of current engineering work. Figure 6 shows the causal structure of the model that includes CE. Here the features flow into the field as new releases are launched, and Defect Introduction captures the flow of defects into the field along these features. These defects create a demand for PD resources to be allocated for current engineering (Resource Demand for Current Engineering.) This demand further increases the Resource Gap and can aggravate the Error Rate for the current Features Under Development, since developers must fix customer-specific bugs rather than spend time on quality work for the next releases (Current Engineering loop in Figure 6). The demand for CE resources depends not only on the quality of the product in the field (operationalized as Defects in Latest Release), but also on the sales, fraction of defects that create noticeable problems, and productivity of doing CE work. Details of formulations appear in the Appendix A. The analysis that follows keeps sales and fraction of noticeable problems to be fixed and focus on the dynamics in the interaction of the Development and the Product in the Field Sectors.
Development
Product In the Field
Productivity +
+
Features Under Development
Demand for New Features
Feature Release -
+ Resource Demand for Development
Defects in Latest Release Error Rate
Available Resources
+ -
Features in Latest Release
+
Resource Gap (Pressure)
+
Defect Introduction + R
Current + Engineering
Resource Demand for Current Engineering
Figure 6- The structure of the model with the addition of products in the field. The new structures are highlighted through black variable names and blue, thick causal links.
17
Two major dynamic effects follow the introduction of CE into the analysis. First, the additional resources needed to serve the CE reduce the effective capacity for developing new features. The magnitude of this effect depends on several factors that determine demand for CE resources, some of which are endogenous to the dynamics of development and products in the field. For example, very good quality in the development phase can significantly reduce the CE resource demand since the product has few noteworthy bugs when introduced into the market. Another factor is sales, which increase the CE demand, since it increases the number of customers who may face problems. The strength of the sales effect also depends on the nature of the product. For customizable products, different defects show up in different customer sites because each customer uses a different set of features and those combinations reveal different hidden problems in the design of the product. However, most defects in off-the-shelf products are common across different customers and therefore by developing one patch, the PD organization serves several customers, reducing the burden of CE significantly. Other relevant factors include the modularity of architecture and complexity of the code, since that determines how resource-consuming the CE work is; the priority of CE work relative to new development; the fraction of defects that surface in typical applications; and the power of the customers in relationship with the focal organization. In the case of CRM softwares we studied in Sigma, these factors added up to a potentially strong CE effect: the products are customizable and the CE work gets a high priority because many customers command special attention in their relationship with Sigma (partially because future sales depends both on the word of mouth and the direct feedback from current customers). However, Alpha and Beta faced different levels of pressure with regard to CE: Alpha had to allocate 30 to 50 percent of its resources (at different times) to CE work, while this figure remained below 10 percent in Beta. The difference between the two can be explained by the internal dynamics of the two cases. Alpha had slipped into a firefighting mode, faced significant quality problems, and poor quality of past releases took a toll on the complexity of the code-base and architecture, increasing the time needed to figure out and fix a problem. On the other hand, Beta had largely succeeded in avoiding the firefighting trap and therefore with a good quality had very few escalations and little demand for CE work. The second effect of bringing CE into picture highlights an adaptation trap for the PD organization. Imagine the adaptive path that the management can take to maximize the feature release of the PD organization. Increasing the pressure (through additional demand or tighter schedules), the management can monitor the performance of the system to see whether incremental increases in pressure pay off by higher feature release, and stabilize where the marginal return on additional pressure is zero. Such adaptation process is analogous to hillclimbing on the Resource Gap-Feature Release curve in Figure 7, and is discussed as one of the main ways through which organizational routines adapt and create better performance (Nelson and Winter 1982).
18
6 Perceived Max
Perceived Adaptation Path
Temporary Peak
5.25
Feature Release
Sustainable Max Demand
4.5 Real Peak
3.75
3 0.80
Sustainable Path
0.90
1
1.10
1.20
1.30
1.40
1.50
1.60
Resource Gap Figure 7- The curve for perceived (blue) and sustainable (red) curves for Feature Release vs. Resource Gap. The perceived curve comes from a simulation in which a short surge of demand (similar to Figure 4) adds to the Resource Gap, while the feature release is measured when normal delays for CE work exist. The sustainable path comes from the same experience, where the CE resource demand is given at its equilibrium value for each level of Error Rate and feature release. An important distinction is that, the demand for the CE does not increase at the time that the pressure (and consequently the output and error rates) is increased. In fact it takes at least a few months before the product is out and then some more time before the defects show up and are referred back to the PD organization. During this period, increases in pressure create unrealistic boosts in the feature release rate, since the CE consequences are not realized. Therefore the adaptation is not on the sustainable payoff landscape which takes into account the future CE demands, rather it is on a temporary one with unrealistic returns to additional pressure (See Figure 7). As a result, the adaptation process points to an optimum feature demand that is indeed beyond the capacity of the PD organization to supply in long-term , and when the CE work starts to flow in, the PD organization finds itself in the slippery slopes of firefighting. Pushed this far, not only the CE demand increases the pressure, but also the tighter schedule and higher demands that where justified in light of adaptive process, keep up their pressure through an increasing backlog of features which should be incorporated in the new releases. The strength of the adaptation trap depends on the magnitude of decoupling between the sustainable adaptation path and the perceived path. Decoupling increases the extent to which demand on PD organization could increase beyond the sustainable level. Therefore higher decoupling increases the magnitude of consequent collapse of the PD process performance and strengthens the trap. The extent of decoupling depends on two main factors: the length of delay in observing the CE resource demand, and the speed of adaptation. A longer delay in perceiving the demand for CE resources, e.g., because of longer release cycle, will result in a longer time horizon in which the adaptive processes work in absence of CE feedback. Therefore the risk of 19
overshoot in adaptation into the unsustainable region increases. Moreover, faster adaptation, e.g., through faster learning cycles of pressure adjustment and performance monitoring, increases the extent to which the PD organization expands the pressure and feature demand, before observing the CE demand. Architecture and code base: dynamics of bug-fixing and building on error In this section we expand the simple model of the PD process to include the effects of the architecture and code base in the dynamics of PD. In this discussion, we focus on two main features of architecture and code base. First, we include fixing the bugs found in the past releases when creating a new release, as well as improving the architecture to accommodate further expansion of the code. Second, we discuss the effect of the problems in architecture and code base on the error rate for working on the new features. Releases which are on the market become old when newer products are launched. Therefore Features in Latest Release move into the Underlying Code category, while the defects that existed in them are removed from the field (Stock of Defects in Latest Release) and are put in the Defects in Underlying Code (See Figure 8). In this conceptualization we are lumping together the underlying code-base and the architecture of the software. Though these two are not the same, they have important similarities in their dynamic effects on PD processes. Bug-fixing is the process of fixing defects that has been found in the field (or found during testing, but ignored under work pressure) in the underlying code. It is different from current engineering since CE happens for specific customers who face a common issue, and the resulting fixes are not integrated with the next release of the code, while bug-fixing incorporate improvements into the main body of the code and will apply to all future customers. The parallel process for architecture is refactoring, which means improving the design of existing code. Quality of underlying architecture and code base both depend on the quality of past development work. Low quality development not only reduces the quality of code base for future work, but also impacts architecture, since taking shortcuts in development often spoils the designed relationships between the different modules of the code. Moreover, although we do not model the concept design phase explicitly in this model, the quality of architecture design depends on similar pressures that impact development phase. Therefore one can expect the quality of the code base and the architecture to be positively correlated.
20
Development +
Productivity
+ Resource Demand for Development +
Error Rate +
Defects in Latest Release
Defect Introduction
+
+ Resource Demand for Current Engineering R
Bug Fixing
Features in Latest Release
Feature Release -
Resource Gap + (Pressure) + + R Resource Demand for Bug Fixing Bug Fixing + -
+
Features Under Development
Demand for New Features
Available Resources
Product In the Field
Defects in Underlying Code
Error Creates Error
Underlying Code
Features and Defects Becoming Old
Architecture and Code Base Figure 8- The model structure after addition of architecture and code base. New loops are highlighted in think blue causal links.
Bug-fixing and refactoring need resources from PD organization and the demand for these resources depends on the quality of the code-base and architecture. This demand for resources can further increase the Resource Gap, leading to more quality problems in a reinforcing cycle we call Bug Fixing (Figure 8). The additional resources needed for bug-fixing are often not separated from those who work on the development of new features, since bug fixes are part of new releases. In fact most software products have a release schedule with minor and major releases, in which minor releases mainly focus on fixing bugs. Consequently, despite lower visibility, bug-fixing can consume a considerable share of PD resources. For example, one of the recent “minor” releases of Alpha, included fixing over 1000 bugs, and proved to be as time and resource intensive as any major release. Including the bug-fixing activity in the picture of PD process has similar consequences to addition of current engineering. First, the bug-fixing resource demand takes away resources for development of new features, shifting the effective, long-term, capacity of the PD process further down. The magnitude of this shift depends on several factors including the quality of the code developed (Did we create a lot of bugs?), the strength of testing (Did we fail to catch those bugs initially?), the priority given to fixing bugs (Do we care about fixing bugs?), as well as the relative productivity of bug-fixing (Does it take more resources to fix a feature than to develop it
21
correctly in the first place?). In appendix 2 we drive the mathematical formula for the sustainable capacity of PD process under different parameter settings. Second, the adaptation trap is made stronger through bug-fixing feedback. The bugfixing activities entail even a longer delay between the original development and the observation of demand for bug-fixing resources. This delay includes the release of new features, the reporting of the bugs, and the scheduling of these bugs in the work for future releases. The longer delay suggests that there is even more time during which adaptive processes fail to observe an overshoot of demand beyond sustainable PD capacity. Moreover, the downward shift in the sustainable capacity of PD process suggests that the gap between the short-term feature release and what can be sustained in the long-term is made wider. Consequently, the chances of adaptation into unsustainable region increases, and when the feedback of CE and bug-fixing arrives, the PD organization finds itself further down the pressure-Feature Release curve. If allocating resources to bug-fixing reduces the PD capacity and increases the chances of slipping into firefighting mode, why not ignore this activity all together? The problem is two fold. First, doing so will generate further customer dissatisfaction and demand for CE when old problems surface in the new features. Moreover, ignoring bug fixes results in the accumulation of defects in the underlying code and architecture, which can significantly increase the chances of making errors in the current development work and trigger another vicious cycle (The Error Creates Error loop, Figure 8). The Error Creates Error loop, when active, is quite detrimental to the product-line. On the one hand, the effect on the error rate is beyond the effect of pressure and results in even lower quality. Such lower quality in fact strengthens the rework, current engineering, and bugfixing loops in the vicious direction. On the other hand, in the face of longer delays before the architecture and code base effects surface, typically firefighting starts with rework and current engineering loops driving the dynamics, followed by the domination of Error Creates Error that seals the PD organization in firefighting. Consequently, the activation of Error Creates Error loop suggests that things have been going wrong for quite a while, therefore reversing the trend requires a significant investment in fixing bugs and refactoring the architecture, and in many cases may prove infeasible. In short, it is hard to save a product line so far down into firefighting path that it faces significant quality problems because of the old architecture and code base quality. An important factor in determining the propensity of a product to face Error Creates Error loop is the modularity of its architecture. The modularity of architecture can be represented by the average number of other modules each module is interacting with. In a highly modular product, each part is interacting with only a few neighboring parts. In a very integrated product, however, every piece can be interacting with every other piece. In general, new pieces can be added safely to the old code, as long as the pieces they are interacting with are not defective. If the interacting pieces are defective, then we observe the Error Creates Error feedback. Therefore, in a highly modular architecture, we only need a few interacting pieces to be fixed to avoid the feedback, regardless of whether non-interacting modules have any defects. In aggregate this entails keeping the density of errors low (percentage of modules defective). However, in the case of an integral architecture, things can go wrong because any of the interacting pieces are defective, therefore we need to control the absolute number of defects. Controlling density of errors in the code base is much easier than controlling the absolute number. In fact, as long as the density of errors in the old releases is constant, the density in the underlying code base does not increase even in the absence of bug-fixing, even though the
22
absolute numbers increase proportional with new features released. Therefore, the more we move from a modular to an integral architecture, the more important the feedback of past errors on error rate becomes, and the more important it becomes to spend resources on bug-fixing. Discussion In the model and analysis part of this paper, we built a simple model of platform-based product development that focuses on the interactions among the development of the product, the product in the field, as well as the architecture and underlying code the new releases are built on. When looking only at the development process, the tradeoff between quality and productivity in the face of pressure results in tipping dynamics. The level of Resource Gap determines where the stable equilibrium and the tipping point for the system are, and the additional pressure brings these two points closer together as well as closer to the maximum capacity of the PD organization. Consequently, there is a tradeoff between robustness and capacity of PD process; increasing the demand on the system can be beneficial in terms of additional output but increases chances of tipping into firefighting mode as a result of unexpected changes in the PD work environment. Moreover, beyond the tipping point, an increase in pressure results in less output and pressure, driving the PD organization into increasing firefighting. When we expand our framework to include the products in the market we observe the current engineering dynamics. These dynamics further highlight the importance of quality since resources need be allocated to the CE when product quality is low. This consideration reduces the level of output a PD organization can sustain across multiple releases. Moreover, the delay between changes in the quality and the observation of their effect on CE workload creates a trap for the PD organization in which adaptation to increase output of the process can actually take the system into the firefighting region before this problem is known through feedbacks on the ground. Finally, inclusion of underlying architecture and code base strengthens the continuity of multiple release product development. First, bug-fixing requires resources and further reduces the effective capacity of the PD process for developing new features. Moreover, the delays are longer for bug-fixing, which makes the adaptation trap deeper and more significant. Finally, the effect of the code base and architecture quality on the quality of current development strengthens rework, current engineering, and bug-fixing dynamics and can seal the system in firefighting mode by increasing the costs of change. Platform-based product development is continuous in nature since different releases of the product are based on the same platform, share resources for development activity, trade features from one release to another, and share resources for current engineering and bug-fixing. Consequently, the firefighting dynamics discussed can not be contained in a single development project; rather, they pass on from one release to another in a contagious fashion. Once the PD organization tips into firefighting, it is increasingly difficult for future releases to avoid these dynamics. This is why these dynamics can erode the PD capability: they reduce the performance of the PD organization in multiple consecutive development projects. In fact, once in the firefighting mode of behavior, new norms can shape around low quality practices, making future improvements harder.3 In short, the Rework, Current-Engineering, Bug-fixing, and Error Creates Error dynamics erode PD capability through sustained firefighting. The PD organization enters firefighting not only as a result of unexpected demands when the organization is critically loaded, but also does so following intendedly functional adaptation to get the maximum utility
23
out of the PD resources. Moreover, the dynamics pass on from one release of the product to another, therefore eroding PD capability. These dynamics degrade the architecture and code base of the product line to the extent that the PD organization has difficulty making high quality products anymore, sealing the product line in the firefighting mode. We developed the model based on the case study of two software products. However, the basic dynamics are based on a few boundary assumptions that can hold in domains beyond the software industry and therefore can inform understanding of platform-based product development processes. The first critical assumption is that there is a level of resource gap beyond which the average output of the organization per resource unit decreases, rather than increase. When this assumption is true, we have an inverse U-shape Resource Gap-Feature Release curve and the rework dynamics exist. In fact, if this assumption is not true, the best option for a PD organization may be overloading the group completely with an unmanageable feature demand so that ever increasing pressure maximizes the output; the practices of successful PD organizations do not suggest the feasibility, not to mention the optimality, of such a policy. Another assumption in the model is that the quality problems are not lost, i.e., there is a cost for a low-quality product that the company will shoulder through some mechanism, including fixing errors, warranty and lawsuit costs, lost revenues, lower customer loyalty, and loss of brand name, among other costs. This might be close to a truism across the board, but the cost of quality problems differ from one case to another. The higher the cost of finding errors in later stages (e.g., when the product is in the field vs. when the product is under development), the stronger are the firefighting and contagion dynamics. Moreover, there needs to be a link between cost of quality and the resources available to develop future releases. This cost can be direct, as is the case for sharing current-engineering and development resources in software, or indirect, as implied by resource allocation policies that give more resources to more successful products in a company’s portfolio. In the latter case, future quality costs influence the amount of resources available to future releases as long as they are accounted for in evaluating the product’s success. The existence of quality costs after launch and the effect of these costs on the current development resources are enough to generate the Current-engineering and Bug-fixing dynamic (or their equivalents in other settings) and therefore the contagion of issues from one release to another. The other dynamic (Error Creates Error) rests on a third assumption: that the quality of the current release impacts the quality of work for the next release. This is usually true for the architectural aspects of the product that have strong impact on the quality of work as well as future concept design and architecture. In software, this assumption holds also for code quality, since the documentation of code and its seamless integration with other pieces influence the quality of future code to be built on top of it. Erosion of organizational capabilities is theoretically important. On the one hand capability erosion can take away the competitive edge of organizations. This effect is especially salient in the case of the PD capability which is the cornerstone of building other capabilities in dynamic markets (Teece, Pisano et al. 1997; Eisenhardt and Martin 2000). In other terms, it is not only important to build a capability, but also it is important to be able to keep it. Moreover, processes that erode organizational capabilities overlap with those that prohibit imitation and replication of these capabilities. Tipping dynamics and adaptation traps not only can erode existing capabilities, but also can stand in the way of building a successful PD capability. These dynamics create multiple ways in the evolutionary path of capabilities for things to go wrong, and therefore reduce the chance that the PD organization can navigate its
24
way into a high performance arrangement. For example, the tipping dynamics suggest that fluctuations in the level of workload can potentially tip the PD organization into firefighting. As a new firm attempts to build its PD capability, there are many instances at which an unexpected surge of workload can tip the PD organization into a degrading mode of working fast and doing low-quality work. Furthermore, attempting to get the most out of the PD process early on, when the resource demand from the field is yet not realized, can result in overloading the organization through the adaptation trap dynamics. Therefore the tipping dynamics, the adaptation trap, and the contagion of firefighting dynamics highlighted in this study complement the literature exploring the mechanisms that make capabilities hard to build and sustain (including core rigidities, competency traps, and rugged payoff landscape). The sources of capability erosion discussed in this paper add to the literature on barriers to imitation of capabilities by highlighting the role of time in the operation of adaptive processes. Curiously, in the case of adaptive trap, not only does the organization fail to realize better opportunities (as is the case in landscape complexity, core rigidity, and competency trap), but also may actually degrade its performance through adaptation. By elaborating on some of the challenges in the way of successful PD processes, this study offers some factors for when PD capability is hard to imitate and under what condition it is easy to build. If the dynamics discussed here play a visible role in the large picture of product development across different industries, one would expect the strength of these dynamics to partially determine the difficulty of building and maintaining a successful PD organization. Following the resourced-based line of argument, one expects PD to explain a larger fraction of firm heterogeneity in industries that PD is hard to build and sustain. Therefore, our study offers a few hypotheses on the strategic importance of PD across different industries: H1: All else being equal, PD is strategically more important in industries where platform-based PD is dominant. First hypothesis suggests that the move towards platform-based product development increases the interconnection between different products and therefore increases the significance of firefighting dynamics. As a result PD capability is harder to build and has a higher competitive value in such industries. H2: Flexibility of PD processes increases their performance heterogeneity across firms. If the quality of PD is highly dependent on flexible processes that individuals should follow, the effect of pressure on error rate will be stronger. The logic behind this assertion is that flexible processes give individuals more flexibility to mitigate the pressure by cutting corners, taking shortcuts, and different practices that lead to lower quality in the long-run. As a result, the Resource Gap-Feature Release curve will have a sharper U-shaped curve and the firefighting becomes more salient. H3: PD capability is more heterogeneous in industries where quality of the products launched influences the resources available to current development. The strength of the adaptation trap depends on how much the resources available to a project are influenced quality of products which are launched. The stronger the feedback of past product quality on PD resources (e.g., through CE and bug-fixing), the stronger is the capability erosion dynamics and the higher is the competitive value of PD in an industry. H4: The delay between development and observing the quality feedback on PD resources increases the heterogeneity of PD organizations across an industry. The decoupling between the perceived and sustainable Resource Gap-Feature Release curves, and therefore the risk of falling into adaptation trap depends on the delay in the effect of
25
old development quality on the current PD resources. The longer the delay between development and feedback of quality on resources, the stronger is the adaptation trap and the higher is the competitive value of PD in the industry. H5: Quality consequences of architecture and product base increase the heterogeneity of PD organizations’ performance in an industry. In industries where architecture and product base have a strong influence on the quality of current PD work, the dynamics of Error Creates Error and Bug-fixing are more salient and make it harder to sustain a successful PD process. Therefore we expect that the stronger the effect of current development on future architecture and product base, the higher would be the value of PD capability. This study also highlights important practical challenges for companies which rely on their product development capability. First, an important concern for the start-up companies is to get their product to the market as fast as possible, with the least resources they can afford. This is both because of limited availability of resources, and because of the importance of early presence in the competitive market. Consequently, the quality of their PD work receives lower priority than time to market and maximizing the feature release rate becomes the highest priority. However, this is the recipe for adaptation trap: at the early stages, when current engineering, bug-fixing, and other multiple-release dynamics are not active, the startup approach yields a very high output which is not sustainable for future releases. During this period, however, the norms of the PD organization are set and routines shape based on potentially unsustainable practices that want to get the product out as fast as possible. These routines make it much harder during later releases to shift the organizing patterns of the PD process to sustainable arrangements that emphasize better process and higher quality. The challenge of managing a transition from the norms of quick-and-dirty design to sustainable quality work is especially salient when companies expand through acquisitions. In these settings, a large firm enters a new product market by acquiring a start-up in that market. If the product is platform-based in nature, e.g., software, the parent company will need to support and encourage a transition from the start-up mindset, to that of a successful platform-based PD process. In the absence of such transition, the new line of product will slip into firefighting as soon as current engineering and bug-fixing feedbacks activate. In fact the challenges that one product face can then spill into other lines of development through the fact that resources are shared among different PD groups. Another important challenge in the light of the dynamics discussed in this study is the strategy for managing customer demands and expectations. One of the main customer demands is a good product support after the sales, which includes current-engineering. CE is the activity with the least value added compared to development and bug-fixing because it only solves the problems of one (a few) customer(s), and does not influence the quality of future releases significantly. However, demand for CE is very salient in the face of customer interaction. Doing CE work solves an urgent problem, thereby it receives high visibility, and it can easily be rewarded because it draws attention from different parts of the company, including the service organization and the higher management who wants to see customer complains addressed quickly. Therefore, in practice, the PD organization often gives higher priority to CE than warranted based on long-term considerations, therefore compromising the quality of future releases to fix the current problems in the field. This prioritizing challenge is ironic because a policy of ignoring customers’ request for firefighting may make them happier in the long-run.
26
A different type of tradeoff with regard to customer demand is in the inclusion of new features. It is generally assumed that including more features in the future releases of the product benefits customers. Contrary to this belief however, beyond the tipping point, trying to incorporate more feature will in fact reduce the output of the PD process. Under these conditions canceling features may in fact be a favor to customers since it helps the PD process to recover, to develop more features in total, and to get the next release out sooner and with better quality. Therefore the relationship between customer satisfaction and the efforts to add new features is contingent on the state of the product development organization: after some point, pushing harder does harm to the employees as well as the customers. Finally, this study highlights the importance of evolution of the architecture and underlying product base. If resource gap in early releases compromises quality of architecture and product base, the platform can not last for long and will lose viability soon after Error Creates Error feedback is activated. From a behavioral perspective, this is a noteworthy risk: the feedback from quality of architecture and product base comes with long delays, therefore the immediate payoff to invest in architecture design, bug-fixing, and refactoring is low. Under the resource gap pressure, it is more likely to skip these activities than the CE, even though in the long-run it can prove counter productive. This study has several limitations which open up room for further research. First, the model is built based on two case studies in software industry and therefore not all potential processes that matter to dynamics of product development could be observed. For example, CE effect is very strong in software, but not so strong in case of automobile development, while manufacturability is central in the latter case but not important in software. Consequently, the generalizability of the conclusions can not be decided until further empirical work with larger number of PD organizations is conducted. The hypotheses developed in the discussion section offer one avenue for such studies. Another question that merits further attention is the persistence of the firefighting dynamics. These dynamics persist despite the time for learning, multiple chances to experience different policies (multiple releases), and high stakes for the PD organization. Some of the discussions in this paper allude to persistence question, for example the contagion of dynamics from one release to another, yet a deep understanding of this question is crucial if a PD organization want to enhance its learning from experience. Finally, beyond generalizations about resource gap and quality, this study did not go into details of remedies for firefighting dynamics and what needs be done to avoid them. For example, one may expect loosely structured processes for development to increase the effect of pressure on quality. However, it is possible to combine flexibility and high quality by frequent synchronization of different development activities and providing quick feedback on quality of recent work (Cusumano 1997). Recognizing and designing such prossesess is of great interest to practitioners who need realistic ways for avoiding adaptation trap and getting out of firefighting, rather than a description of how one may fall into these dynamics. References: AbdelHamid, T. and S. Madnick. 1991. Software project dynamics: An integrated approach. Englewood Cliffs, NJ, Prentice-Hall. Amit, R. and P. J. H. Schoemaker. 1993. Strategic assets and organizational rent. Strategic Management Journal 14(1): 33-46.
27
Barney, J. 1991. Firm resources and sustained competitive advantage. Journal of Management 17(1): 99-120. Black, L. J., P. R. Carlile and N. P. Repenning. 2004. A dynamic theory of expertise and occupational boundaries in new technology implementation: Building on barley's study of ct scanning. Administrative Science Quarterly 49(4): 572-607. Brown, S. L. and K. M. Eisenhardt. 1995. Product development - past research, present findings, and future-directions. Academy of Management Review 20(2): 343-378. Burgelman, R. A. 1991. Intraorganizational ecology of strategy making and organizational adaptation: Theory and field research. Organization Science 2(3): 239-262. Cooper, K. G. 1980. Naval ship production: A claim settled and a framework built. Interfaces 10(6). Cusumano, M. A. 1997. How microsoft makes large teams work like small teams. Sloan Management Review 39(1): 9-20. Cusumano, M. A. and K. Nobeoka. 1998. Thinking beyond lean: How multi-porject management is transforming product development at toyota and other companies. New York, Free Press. Cyert, R. M. and J. G. March. 1963. A behavioral theory of the firm. Englewood Cliffs, N.J.,, Prentice-Hall. Dierickx, I. and K. Cool. 1989. Asset stock accumulation and sustainability of competitive advantage. Management Science 35(12): 1504-1511. Dosi, G., R. R. Nelson and S. G. Winter. 2000. The nature and dynamics of organizational capabilities. Oxford ; New York, Oxford University Press. Eisenhardt, K. M. 1989. Building theories from case study research. Academy of Management Review 14(4): 532-550. Eisenhardt, K. M. and S. L. Brown. 1998. Time pacing: Competing in markets that won't stand still. Harvard Business Review 76(2): 59-+. Eisenhardt, K. M. and J. A. Martin. 2000. Dynamic capabilities: What are they? Strategic Management Journal 21(10-11): 1105-1121. Ford, D. N. and J. D. Sterman. 1998. Dynamic modeling of product development processes. System Dynamics Review 14(1): 31-68. Forrester, J. W. 1961. Industrial dynamics. Cambridge, The M.I.T. Press. Gawer, A. and M. A. Cusumano. 2002. Platform leadership : How intel, microsoft, and cisco drive industry innovation. Boston, Harvard Business School Press. Henderson, R. and I. Cockburn. 1994. Measuring competence - exploring firm effects in pharmaceutical research. Strategic Management Journal 15: 63-84. Henderson, R. M. and K. B. Clark. 1990. Architectural innovation - the reconfiguration of existing product technologies and the failure of established firms. Administrative Science Quarterly 35(1): 9-30. Krishnan, V. and S. Gupta. 2001. Appropriateness and impact of platform-based product development. Management Science 47(1): 52-68. Krishnan, V. and K. T. Ulrich. 2001. Product development decisions: A review of the literature. Management Science 47(1): 1-21. Leonard-Barton, D. 1992. Core capabilities and core rigidities - a paradox in managing new product development. Strategic Management Journal 13: 111-125. Levinthal, D. A. 1997. Adaptation on rugged landscapes. Management Science 43(7): 934-950.
28
Levitt, B. and J. G. March. 1988. Organizational learning. Annual Review of Sociology 14: 319340. Lovas, B. and S. Ghoshal. 2000. Strategy as guided evolution. Strategic Management Journal 21(9): 875-896. MacCormack, A., C. F. Kemerer, M. Cusumano and B. Crandall. 2003. Trade-offs between productivity and quality in selecting software development practices. Ieee Software 20(5): 78-+. Meyer, M. H., P. Tertzakian and J. M. Utterback. 1997. Metrics for managing research and development in the context of the product family. Management Science 43(1): 88-111. Milgrom, P. and J. Roberts. 1990. The economics of modern manufacturing - technology, strategy, and organization. American Economic Review 80(3): 511-528. Moløkken, K. and M. Jørgensen. 2003. A review of surveys on software effort estimation. IEEE International Symposium on Empirical Software Engineering, Rome, Italy. Morecroft, J. D. 1983. System dybnamics: Portraying bounded rationality. OMEGA 11(2): 131142. Morecroft, J. D. W. 1985. Rationality in the analysis of behavioral simulation models. Management Science 31(7): 900-916. Muffatto, M. 1999. Introducing a platform strategy in product development. International Journal of Production Economics 60-1: 145-153. Nelson, R. R. and S. G. Winter. 1982. An evolutionary theory of economic change. Cambridge, Mass., Belknap Press of Harvard University Press. Peteraf, M. A. 1993. The cornerstones of competitive advantage - a resource-based view. Strategic Management Journal 14(3): 179-191. Putnam, D. 2001. Productivity statistics buck 15-year trend. QSM articles and papers. Repenning, N. P. 2000. A dynamic model of resource allocation in multi-project research and development systems. System Dynamics Review 16(3): 173-212. Repenning, N. P. 2001. Understanding fire fighting in new product development. The Journal of Product Innovation Management 18: 285-300. Rivkin, J. W. 2001. Reproducing knowledge: Replication without imitation at moderate complexity. Organization Science 12(3): 274-293. Sanderson, S. and M. Uzumeri. 1995. Managing product families - the case of the sonywalkman. Research Policy 24(5): 761-782. Sanderson, S. W. and M. Uzumeri. 1997. The innovation imperative : Strategies for managing product models and families. Chicago, Irwin Professional Pub. Sauer, C. and C. Cuthbertson. 2004. The state of it project management in the uk 2002-2003. Oxford, University of Oxford: 82. Simon, H. A. 1979. Rational decision making in business organizations. American Economic Review 69(4): 493-513. Sterman, J. 2000. Business dynamics: Systems thinking and modeling for a complex world. Irwin, McGraw-Hill. Teece, D. J., G. Pisano and A. Shuen. 1997. Dynamic capabilities and strategic management. Strategic Management Journal 18(7): 509-533. Wernerfelt, B. 1984. A resource-based view of the firm. Strategic Management Journal 5(2): 171-180. Williamson, O. E. 1999. Strategy research: Governance and competence perspectives. Strategic Management Journal 20(12): 1087-1108.
29
Winter, S. G. 2003. Understanding dynamic capabilities. Strategic Management Journal 24(10): 991-995. Zajac, E. J. and M. H. Bazerman. 1991. Blind spots in industry and competitor analysis implications of interfirm (mis)perceptions for strategic decisions. Academy of Management Review 16(1): 37-56.
Appendix A- Detailed model formulations The following table lists the equations for the full model. To avoid complexity, all switches and parameters used to break feedback loops are removed from the equations. Allocated Bug Fix Resources = Allocated Resources[BugFix] Units: Person Allocated Resources[Function] = Min(Desired Resources[Function]/SUM(Desired Resources[Function!])*Total Resources, Desired Resources[Function]) Units: Person Desired Resources[Development] = Des Dev Resources Desired Resources[CurrentEng] = Desired Resources for Current Engineering Desired Resources[BugFix] = Desired Bug Fix Resources Development Resources Allocated = Allocated Resources[Development] CE Resources Allocated = Allocated Resources[CurrentEng] Allocated Bug Fix Resources = Allocated Resources[BugFix] Average size of a new release = 40 Units: Feature Bug Fixing = Allocated Bug Fix Resources*Productivity of Bug Fixes Units: Feature/Month Des Dev Resources = Features Under Development / Desired Time to Develop / Productivity / (1-Normal Error Rate*Frac Error Caught in Test) Units: Person Desired Bug Fix Resources = Errors in Base Code / Time to Fix Bugs / Productivity of Bug Fixes Units: Person Desired Resources for Current Engineering = Sales*(Errors in New Code Developed+Effective Errors in Code Base)*Fraction Errors Showing Up / Productivity of CE Units: Person Desired Time to Develop = 10 Units: Month Dev Work Pressure = if then else (Resource Pressure Deficit < 0.99, Resource Pressure Deficit, ZIDZ (Des Dev Resources , Development Resources Allocated)) Units: Dmnl Eff Architecture and Code Base on Error Rate = (Modularity Coefficient*"Tl Eff Arc & Base on Error"(Fraction Old Features Defective)+(1-Modularity Coefficient)*Max (1, Errors in Base Code)) Units: Dmnl Eff Pressure on Error Rate = Tl Eff Pressure on Error Rate (Dev Work Pressure) Units: Dmnl Effect of Pressure on Productivity = Tl Eff Pressure on Productivity (Dev Work Pressure) Units: Dmnl Effective Errors in Code Base = Min (Effective Size of Old Release Portion , Old Features Developed)*Fraction Old Features Defective Units: Feature Effective Size of Old Release Portion = 0 Units: Feature Error Becoming Old = Features Becoming Old*Fraction New Features Defective Units: Feature/Month Error Frac in Released Feature = Error Fraction*(1-Frac Error Caught in Test) / (1-Error Fraction*Frac Error Caught in Test) Units: Dmnl 30
Error Fraction = Min (1, Normal Error Rate*Eff Architecture and Code Base on Error Rate*Eff Pressure on Error Rate) Units: Dmnl Error Generation = Feature Release*Error Frac in Released Feature Units: Feature/Month Errors in Base Code = INTEG(Error Becoming Old-Bug Fixing , Errors in New Code Developed*Time to Fix Bugs / Desired Time to Develop) Units: Feature Errors in New Code Developed = INTEG(Error Generation-Error Becoming Old , Normal Error Rate*(1-Frac Error Caught in Test)*New Features Developed / (1-Normal Error Rate*Frac Error Caught in Test)) Units: Feature External Shock = 0 Units: Feature Feature Addition = Fixed Feature Addition+PULSE (Pulse Time , Pulse Length)*External Shock / Pulse Length Units: Feature/Month Feature Release = Rate of Development*Fraction of Work Accepted Units: Feature/Month Features Becoming Old = New Features Developed / Time Between Releases Units: Feature/Month Features Under Development = INTEG(Feature Addition-Feature Release , Fixed Feature Addition*Desired Time to Develop) Units: Feature FINAL TIME = 100 Units: Month Fixed Feature Addition = 4 Units: Feature/Month Frac Error Caught in Test = 0.9 Units: Dmnl Fraction Errors Showing Up = 0.1 Units: Dmnl Fraction New Features Defective = ZIDZ (Errors in New Code Developed , New Features Developed) Units: Dmnl Fraction of Work Accepted = 1-Error Fraction*Frac Error Caught in Test Units: Dmnl Fraction Old Features Defective = ZIDZ (Errors in Base Code , Old Features Developed) Units: Dmnl Modularity Coefficient = 0.5 Units: Dmnl New Features Developed = INTEG(Feature Release-Features Becoming Old , Average size of a new release) Units: Feature Normal Error Rate = 0.4 Units: Dmnl Old Features Developed = INTEG(Features Becoming Old , Initial Old Features) Units: Feature Productivity = 0.1 Units: Feature/(Person*Month) Productivity of Bug Fixes = Productivity*Relative Producitivty of Bug Fixing Units: Feature/(Person*Month) Productivity of CE = Productivity*Relative Productivity of CE Units: Feature/(Person*Month) Pulse Length = 1 Units: Month Pulse Time = 10 Units: Month Rate of Development = Development Resources Allocated*Productivity*Effect of Pressure on Productivity Units: Feature/Month Relative Producitivty of Bug Fixing = 0.5 Units: Dmnl Relative Productivity of CE = 1 Units: Dmnl Resource Pressure Deficit = SUM (Allocated Resources[Function!]) / Total Resources Units: Dmnl Sales = 10 Units: 1/Month
31
Time Between Releases = Average size of a new release / Feature Release Units: Month TIME STEP = 0.125 Units: Month Time to Fix Bugs = 9 Units: Month [0,20] "Tl Eff Arc & Base on Error" ([(0,0)(1,2)],(0,1),(0.13,1.13),(0.28,1.34),(0.42,1.68),(0.54,1.84),(0.72,1.94),(1,2)) Units: Dmnl Tl Eff Pressure on Error Rate ([(0.5,0)-(2,2)],(0.5,0.8),(1,1),(1.15,1.11) ,(1.29,1.33),(1.40,1.54),(1.53,1.74),(1.68,1.89),(1.99,2)) Units: Dmnl Tl Eff Pressure on Productivity ([(0,0)-(2,1.5)],(0,0.6),(0.26,0.61),(0.45,0.64) ,(0.64,0.73),(0.83,0.84),(1,1),(1.22,1.2),(1.43,1.28),(1.77,1.32),(2,1.33)) Units: Dmnl Total Resources = 100 Units: Person Appendix B- The maximum PD capacity With a few assumptions, we can draw the analytical expressions for long-term capacity of the product development organization as modeled in the paper. These assumptions include: - That products remain in the field for a fixed time - Product modularity is not very high, therefore we need to keep the absolute level of problems in the code-base and architecture low. The logic for driving the capacity is simple. We can write the total resources needed for development, CE, and bug-fixing in terms of Feature Release and Resource Gap. Since in this model allocation is proportional to request, the ratio of resources requested to those allocated are the same across the three functions and equal resource gap. Therefore we can find the resources allocated to each activity in terms of resource gap and Feature Release. Consequently, knowing that when resource gap is above 1, the total resources allocated equal the total resources available, we can find Feature Release in terms of resource gap, which is the equation we need to find the optimum capacity. Formally, we can write resources allocated to each activity:
FR f P ( RG).PN .(1 − eN . f e ( RG). frT ) 1 FR.eN . fe ( RG).(1 − frT ).k * RCE = PN .(1 − eN . f e ( RG). frT ).RPCE RG 1 FR.eN . f e ( RG).(1 − frT ) * RBF = PN .(1 − eN . f e ( RG). frT ).RPBF RG RD =
(3) (4) (5)
And note the conservation of resources:
R = RD + RCE + RBF
(6) Plugging the equations 3-5 into equation 6, and solving for FR, we find the following relationship that describes Feature Release as a function of resource gap:
FR =
R.PN .(1 − eN . f e ( RG ). frT ).RG RG k 1 ] + eN . f e ( RG ).(1 − frT )[ + f P ( RG ) RPCE RPBF
(7)
Note that, as expected, in the special case where bug-fixing and current engineering don’t need any resources (e.g., by letting RPCE and RPBF go to infinity), the equation 7 is the same as equation 2, discussed in the text.
32
To find the maximum FR rate, one needs to take the derivative of FR with respect to RG (for which we need specific fe and fp functions) and equal it to zero. Finding the optimum RG (through numerical or analytical solution), we can plug it back into equation 7 to find the optimum level of capacity. Below are the variable definitions: eN: Normal error rate fe(.): Effect of resource gap on error rate fp(.): Effect of resource gap on productivity FR: Feature Release frT: Fraction of errors caught in test k: Number of fixes that need be made on the customer sites, for each defect in the code PN: Normal Productivity Ps: resource gap/ Work Pressrue R: Total resources allocated RD: Resources allocated to development RCE: Resources allocated to current engineering RBF Resources allocated to bug frixing RG: Resource Gap RPBF Relative productivity of bug-fixing as compared to normal development RPCE: Relative productivity of CE, as compared to normal development
33


![Modeling Start-ups using System Dynamics - System Dynamics Society [PDF]](https://m.moam.info/img/260x300/modeling-start-ups-using-system-dynamics-system-dy_648bbbc3098a9e4e318b459b.jpg)