e-stat: Views, Methods, Applications Erhard Cramer1 , Wolfgang Härdle 2 , Udo Kamps3 , Rodrigo Witzel4 Humboldt-Universität zu Berlin 10178 Berlin, Germany 2
[email protected], 4
[email protected] Carl von Ossietzky Universität Oldenburg 26111 Oldenburg, Germany 1
[email protected], 3
[email protected]
1. Introduction Statistical and quantitative thinking have become fundamental skills in natural sciences, life sciences, social sciences, economics, and engineering. Statistical tools and methods are applied in modelling and data analysis, e.g., in business and industry, in order to obtain decision criteria and to gain more insight into structural coherence. The necessity of using statistical methodology in so many fields, has consequences for the processes of learning and teaching (e.g., Härdle et al. 1999): high school students, for example, should get to know elementary and application-oriented statistics. They require high quality teaching of quantitative methodology with respect to presentation and motivation. In order to get across abstract contents real life examples and applications are indispensable. They underline the effectiveness and advantages of statistical methods and software tools in, e.g., business and technology. This could inspire students to put more emphasis on data analysis. The demand for user oriented education is accompanied by the need to provide a user specific view on the theoretical material. Students of economics should train their skills with examples from economics. Hence, a user specific presentation, the view, of the content is important to create interest and understanding. In order to train the theoretical background, activity of the learner is a key tool to deepen the understanding of methods. On the one hand, the students have to practice the statistical procedures on their own. On the other hand, they have to be supported by special teachware like JAVA-Applets or XploRe teaching quantlets (Härdle et al. 2000). Therefore, interactivity is a crucial feature of modern teachware (Genschel et al. 2002, Rumelhart and McClelland 1986, and Velleman and Moore 1996). In conclusion, modern teachware must be interactive and user oriented. It should be based on real life examples and applications. Last not least, it should use different media and be available anytime and anywhere which is guaranteed, e.g., by a net-based learning platform. Great efforts have been made to introduce tools in statistical education that take into account these requirements. In particular, electronic textbooks offer great opportunities to realize them. A survey of present products is provided by Symanzik and Vukasinovic (2002). They present a brief comparison of ActivStats (by P. Velleman), CyberStats (by CyberGnostic, Inc.), and MM*Stat (by W. Härdle and B. Rönz). Moreover, they report on teaching experiences with CyberStats. All these products include text material as well as multi-media and interactive components. While ActivStats has an integrated data laboratory, CyberStats and MM*Stat are tightly linked to external statistical engines. For instance, MM*Stat accesses XploRe as professional software package for exploratory data analysis. In addition, it offers teachware quantlets which are developed explicitly for teaching purposes. Going beyond pure data analysis, this tool can effectively be utilized to visualize properties of statistical methods and to gain insight into statistical procedures. This integration of both teachware and statistical software package enables the learner to acquire knowledge of a professional tool for statistical analysis during the teaching process.
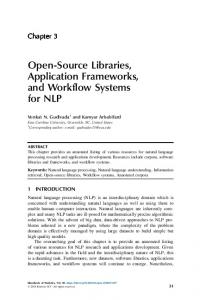
The notion of using professional software in the teaching process is fundamental in the design of the e-stat platform. This net-based system offers JAVA-Applets and films like flash animations to support the learner in the learning process (see Cramer et al. 2002). These features are covered in the mentioned electronic textbooks as well so that one might ask “Why e-stat?” A main reason for a completely new platform is that the aforementioned systems do not support standards like XML and MathML, which ensure universal usability of content in the long term. In addition, e-stat serves as an intelligent statistical encyclopaedia which covers more than the basic elements of statistics. It is more flexible than the other systems since it allows self-directed learning as well as guided learning. Teachers can design their own statistics courses from the available material and are not restricted to a prescribed sequence and selection of learning modules. In any case, included courses may be used directly as well. 2. e-stat The e-stat platform is developed as an open concept with a clear target: efficient applicability and practical adaptation in distance teaching. Its architecture (Figure 1) incorporates user-specific views and scenarios. A variety of statistical engines may be linked to the methods and applications in order to supply real life examples.
Statistical Engines
Level A,B,C
Szenarios
Kernel Modules
Modules from different Views
Courses and Course Units
Figure 1. Architecture of e-stat (see Cramer et al. 2003) The kernel presents contents from an abstract view. It covers the essential statistics topics as well as more advanced techniques like, e.g., statistical methods in finance, insurance, and marketing. An fundamental element of e-stat is the emphasis on a context specific presentation of these topics – this is realized through different views on the (same) content. In addition, e-stat classifies content by providing three levels of abstraction in order to take into account different individual mathematical and theoretical backgrounds. Users as well as teachers have the possibility to switch between the levels in order to select an appropriate one for their purposes and abilities. The contents are written on • an elementary level A (presentation in a popular scientific way by assuming no or only a low previous (mathematical) knowledge), • a basic level B (like undergraduate courses in applied statistics for students, e.g., of economics, psychology, and social sciences), and
•
an advanced level C (containing deeper material and special topics within the broad field of statistics and applied probability). Due to the integration of user-oriented views and scenarios, which are near to real world applications, web-based learning and teaching with e-stat will be possible in different ways: (1) Method-led: Learning of statistical methods along a prescribed way of modules including terms, methods, examples, exercises, etc. (2) Problem-led: The user describes his/her problem in a simplified way and a consulting component proposes statistical theory and methods for the statistical analysis of the respective data. (3) View-led: Examples from a specific area of statistical applications, e.g., economics, psychology, serve as a motivation to deal with statistical terms and methods. Views, understood as a specific subject environment, incorporate the abstract curriculum with user-specific introductions, examples, and exercises. (4) Scenario-led: Starting from a complex and maybe confusing scenario, e.g., a virtual company together with a huge amount of data from different subdivisions of an enterprise, the user should - on the job - learn to detect, to measure as well as to value structures by applying statistical tools. (5) Data-led: The complexity of the learning and teaching environment e-stat enables a self-contained introduction to exploratory data analysis. Thereby, different teaching concepts and instructional designs are supported and the system can be seen as an innovative high-quality contribution to the learning facilities of the present and of the future. These goals gave the main impact to develop e-stat • as one system suitable for teaching statistics at schools, universities, and in further vocational training, • as one system which supports supervised and self-directed learning, and • as one system which is accessible in the internet, anytime, and for anyone. A crucial element of e-stat is the use of future standards like XML and MathML which ensure compatibility to future platforms. At this time, three ways to generate e-stat modules are possible. The first method can be recommended if the content is not available in electronic form or if the author wants to design it in a new form. Content providers use an XML editor to create the e-stat text modules while the mathematical formulae can be created in a WYSIWYG environment (MathType) and saved as MathML documents. This procedure requires in most cases a complete retyping of content. If content is available in form of a Microsoft Word document or as LaTeX source the project e-stat offers tools to convert these files into e-stat modules. Material processed with Microsoft Word can be converted with low efforts. However, the formulae can not be converted automatically so that a separate conversion using MathType is necessary. Content available in LaTeX can be converted using the tool MD*Book (www.md-book.com), including formulae. Before converting, the author has to add some meta information to an existing LaTeX text in order to potentiate the generation of XML documents appropriate for e-stat. The conversion can be carried out via WWW, too. In some cases postprocessing is necessary in order to get an optimal output. 3. Methods and Applications In this section, we illustrate the integration of one of the statistical engines, XploRe, into estat (see Figure 2). For authors there are two possibilities to embed XploRe into their modules. One of them is inserting the XploRe Quantlet Client Applet (XQC) in combination with a certain quantlet into a module (1). The XQC assumes the visualization of results and the user interaction. For more complex interaction as well as visualization needs the author can create a JAVA-applet which uses the communication interface MD*Crypt for accessing the complete XploRe method pool (2). In addition to these interactive components in the modules, at any time the user can use a
server based version of XploRe in a separate window (3) for complex data analysis. In this case, estat serves as an intelligent encyclopaedia.
Figure 2. Integration of XploRe into e-stat modules REFERENCES Cramer, E., Cramer, K., Kamps, U. (2002) e-stat: A web-based learning environment in applied statistics. In: W. Härdle, B. Rönz (Eds.) COMPSTAT 2002 – Proceedings in Computational Statistics, Physica, Heidelberg 309-314. Cramer, K., Cramer, E., Kamps, U. (2003) Die elementar-modulare Struktur der Lehr- und Lernumgebung EMILeA-stat (in German). To appear in Medien in der Wissenschaft, Waxmann, Münster. Genschel, U., Gather, U., Busch, A. (2002) EMILeA-stat: Structural and didactic aspects of teaching statistics through an internet-based, multi-medial environment. In: W. Härdle, B. Rönz (Eds.) COMPSTAT 2002 – Proceedings in Computational Statistics, Physica, Heidelberg 339-342. Härdle, W., Klinke, S., Marron, J.S. (1999) Connected teaching in statistics. Statistics Computing and Statistical Graphics Newsletter 10, 12-20. Härdle, W., Klinke, S., Müller, M. (2000) XploRe Learning Guide. Springer, Berlin. Rumelhart, D., McClelland, J. (Eds.) (1986) Parallel Distributed Processing: Explorations in the Microstructure of Cognition. MIT Press, Cambridge, MA. Symanzik, J., Vekanusovic, N. (2002) Teaching Statistics with electronic textbooks. In: W. Härdle, B. Rönz (Eds.) COMPSTAT 2002 – Proceedings in Computational Statistics, Physica, Heidelberg 79-90. Velleman, P.F., Moore, D.S. (1996) Multimedia for teaching statistics: promises and pitfalls. American Statistician 50, 217-225.


![Microeconometrics : Methods and Applications [PDF]](https://m.moam.info/img/260x300/microeconometrics-methods-and-applications-pdf_64813007098a9e005a8b45ef.jpg)


