Proceedings of the 2001 International Workshop on Spatial Media, Aizu-Wakamatsu, Japan, Oct. 25-26, 2001
EARLY REFLECTION THRESHOLDS FOR VIRTUAL SOUND SOURCES
a
Durand R. Begaulta Bryan U. McClainb Mark R. Andersonc
Human Factors Research & Technology Division b San José State University Foundation c Raytheon STX Corporation a, b,c Spatial Auditory Display Laboratory, MS 262-2, NASA Ames Research Center, Moffett Field, California 94035-1000 USA a
[email protected] ABSTRACT Data on auditory thresholds for acoustic reflections were obtained from 29 subjects as a function of both spatial position and time delay in a simulated 5.1 surround sound listening environment. Absolute thresholds (perception of any type of change) were measured at the 70.7% level using a one up-two down staircase algorithm, for both anechoic and reverberant speech stimuli conditions, from 18 subjects. Additional data were gathered from 11 subjects for tone burst stimuli. Reflection threshold data are useful in the context of building acoustics, since path length attenuation and absorption can make potential reflections inaudible. Audibility of reflections is desirable for 3-D sound headphone simulations that require sound source externalization. The information is also useful for determining engineering parameters for the real-time simulation of virtual acoustic environments, such as headmounted displays that include head tracking. For all types of stimuli, results indicate that a single early reflection should be inaudible when less than 21 dB below the direct sound at 3 ms, and less than 30 dB at 15- 30 ms. 1.
INTRODUCTION
A well-known method for characterizing the acoustical characteristics of a room is to measure the response at a particular microphone position to a brief source of energy, such as a pistol shot or a balloon burst. The use of a deterministic signal (e.g., maximum length sequence, sine sweep) is also possible via post-processing of the signal. From the perspective of room acoustic quality, the end result usually involves visual inspection of a graphic display of the “room impulse response”, i.e., the squared pressure of the real part of the analyzed signal in decibels as a function of time. A similar sort of graphic can be obtained from a modeling program that uses ray tracing or other techniques for predicting, rather than measuring, the room impulse response. This information can be used for both analyzing the acoustics of a real room or for simulation of the acoustics of a virtual room. In both applications, post-analysis of the reflection amplitudes relative to the level of the direct sound determines their significance in terms of audibility. Early reflections are well-known to be potentially detrimental to
timbre reproduction, speech intelligibility, and the formation of spatial images in a loudspeaker sound field. Auditory thresholds for early reflections have been reported by various workers using real sound sources [1-3]. The current study uses virtual simulation of real sources (‘auralization’ technique) for simulating direct and reflected sources corresponding to loudspeaker locations within a 5.1 listening room configuration. The correspondence between real and virtual sound source thresholds allows an estimate of the auralization technique’s capacity to predict perceptual responses to more complex room models for both psychoacoustic investigations and sound quality evaluation. Establishment of thresholds for early reflections is pertinent to determining necessary absorptive treatment for building acoustic treatment. Another goal previously described in [4] is for management of computational resources for real-time auralization systems. 2.
METHODOLOGY, SUBJECTS
Absolute thresholds were determined for time-delayed speech and tone burst signals, relative to a non-delayed version of the same signal corresponding to an acoustic “direct path”. The delayed signals, corresponding to acoustic “reflections” within an enclosure, were manipulated in terms of both time delay and location between experimental blocks; the level of the reflection was manipulated as the dependent variable. Eighteen subjects participated in the speech threshold experiments, and nine additional subjects participated in the tone burst threshold experiment. All subjects were screened for normal hearing prior to participating in the experiment. Experimental blocks were conducted in double-walled soundproof booth having a background noise level of 15 dB (A-weighted). Speech stimuli were formed from one of 36 randomly chosen anechoic speech segment .wav files 1.3 s in duration [5]. Tone burst stimuli were formed from one of 6 randomly chosen 80 ms duration sinusoid .wav files that corresponded to octave-band center frequencies at 125, 250, 500, 1k, 2k and 4k Hz. The amplitudes of the sinusoidal stimuli were normalized to an equal loudness level of 65 phons [6]. Stimuli were presented at a level of 65 dB (A-weighted) via stereo headphones (Sennheiser HD 430).
Proceedings of the 2001 International Workshop on Spatial Media, Aizu-Wakamatsu, Japan, Oct. 25-26, 2001
. .
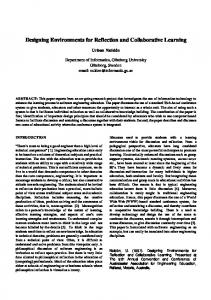
Figure 1. Layout of modeled room, listener position, and direct sound source configurations used in the experiment. Reflections correspond to boldface data in Table I. Azimuth-elevation angles (referenced to 0° at a point directly in front of the listener) were simulated via real-time head-read transfer function (HRTF)-filtering. The SLAB real-time, software-based 3-D audio processor developed at NASA Ames Research Center was used [7, 8]. An additional computer drove the experimental software that communicated to the SLAB server via a tcp/ip connection and gathered data from the subject via a two-button switchbox interfaced to the mouse serial port. A room modeling software package (Odeon 4.0) was used to obtain image model reflection timings and azimuths for a surround sound loudspeaker array within a room conforming to listening test standards (ITU). The room dimensions were 8 x 6 x 3 m, with the listener centered between the loudspeaker array and the left and right walls, 4.5 m from the back wall (see Figure 1). Loudspeakers were modeled at 0° and 120° azimuth, corresponding to “center” and “surround” channels. For each direct path, 1st and 2nd order reflections were selected (ref. Table I). To establish reflection delay time as an independent variable, the derived azimuth and elevation for a given reflection was subsequently investigated at 3, 15, and 30 ms. Specifications in the “Az. Dif.” column correspond to the inside angle subtended on the horizontal plane between the direct and reflected sound azimuths. The maximum lateral azimuth difference between the direct sound and the reflection is for the 72 and 164 degree azimuth difference angles (indicated in bold). Table I. Experimental conditions. Time delays in bold type correspond to the room model results Time Direct Az. delay (all at 0 ms. elevation). 3, 15, 30 0 3, 15, 30 0 3, 15, 30 0 3, 15, 30 120 3, 15, 30 120 3, 15, 30 120
Reflection Az. El.
Az. Dif.
0 - 50 0 72 0 151 120 -50 72 0 -76 0
0 72 151 0 48 164
Reflection surface Floor Right wall Back wall Floor Right wall Left wall
. Figure 2. Illustration of “replacement failure” in the adaptive staircase algorithm, showing five and then seven “same” stimulus pairs between the 4th and 16th trials. Using a two-alternative forced-choice paradigm, thresholds were obtained at the 70.7% level within a tolerance of 1 dB with a “one up-two down” adaptive staircase algorithm that adjusted the level of the reflection [9]. The reference (R) consisted of only the direct path, while the probe (P) consisted of the direct path plus the amplitude-scaled reflection. Two sequential stimuli were presented either as P-R, R-R, P-P, or R-P. Subjects indicated their response via the push-button interface as to whether or not the sequential stimuli were “same” or “different”. The reflection was initially presented at –4 dB relative to the direct sound. The staircase began with an 8 dB step size, and reduced in level by 50% until the 1 dB step size was reached. The staircase terminated after a total of eight “reversals” in direction. Thresholds were defined for each subject and for each block as the mean value of the five final staircase reversals at the minimum level of 1 dB. For speech stimuli, subjects were run under each of the time-location configurations indicated in Table I using both “anechoic” and “reverberant” stimuli conditions, for a total of 36 blocks. Block ordering was randomized across subjects. Anechoic stimuli included simulation of only the direct sound and a single reflection. Reverberant stimuli were generated via convolution of the direct sound with a synthetic reverberation decay, formed from exponentiallydecaying white noise decorrelated between the left-right channels and at a level –20 dB below the direct sound. This corresponds to a non-acoustically damped version of the modeled room. The mid-band reverberation time in the 500 Hz - 1 kHz octave bands corresponded to 0.63 s. For tone burst stimuli, subjects were run under a subset of the direct and reflection azimuth-elevation locations, excluding azimuth difference conditions at 151 and 164 degrees in Table I. All time delay conditions were used. The remaining conditions corresponded to the minimum (azimuth difference = 0 degrees) and maximum values (azimuth difference = 72, 164 degrees) for lateral azimuth difference.
Proceedings of the 2001 International Workshop on Spatial Media, Aizu-Wakamatsu, Japan, Oct. 25-26, 2001
Figure 3. Mean threshold values for 18 subjects for speech under anechoic and reverberant conditions. “Direct” refers to angle of direct sound in degrees, and “Az. Dif.” refers to the azimuth difference in degrees between the direct and reflected sound (ref. Table I). 3.
CRITERIA FOR DATA EXCLUSION
Data for each subject’s threshold was excluded in the computation of the overall mean threshold value for a given condition if it met one of three “failure” criteria, which were applied sequentially. A convergence failure meant that fewer than eight reversals had occurred by the occurrence of the 50th trial. The experimental block ceased running after this point, and the subject went onto the next block. Seven out of the 648 blocks speech blocks run were excluded on this basis. An outlier failure meant that the subject’s threshold was 3 standard deviations outside the overall mean threshold for each condition. Five out of the 648 speech blocks were excluded on this basis. A replacement failure occurred as a function of the adaptive staircase algorithm allowing the subject to fall into the “noise floor” by a large number of sequential presentations of “same” stimuli trials (probe-probe or reference-reference) early in the history of the block when the step size was at is maximum value of 8 dB. Too many sequential “same” stimuli trials means that the subject has insufficient opportunity to make incorrect answers for “different” stimuli and thus reverse the staircase direction. Figure 2 illustrates an example. By the time of the 16th trial, the first reversal (incorrect answer) has occurred but the level of the reflection is 68 dB below the direct sound (< 0 dB SPL!). The staircase continued to move downward because the subject was answering correctly to the fact that both the probe-probe stimuli (with an inaudible reflection) and a reference-reference stimuli (with no reflection) sound the same, both within trials and between trials. (The probability of 7 repeated “same” stimuli trials as shown in Figure 2 is once every 128 trials). To eliminate blocks with replacement failures, an algorithm eliminated all blocks for 4 or more repeated “sames” that resulted in a dB shift greater than 16. The resulting set was then correlated against the initial results for all the staircases of the same conditions. If the mean of a
particular member of the first set was 2 standard deviations or more from the mean of the group (of the same condition), than the results of that particular staircase was thrown out. A total of 5 blocks for the speech experiment met the criteria for replacement failure, and 1 block in the tone burst experiment. Overall, threshold values from a total of 17 blocks out of 648 (2.6% of the total) were excluded from computation of overall means for speech stimuli, and 1 block (0.7% of the total) were excluded for the tone burst stimuli. 4.
RESULTS
Figure 3 indicates the mean values of the results across eighteen subjects for anechoic and reverberant stimuli. For both anechoic and reverberant stimuli, thresholds decrease monotonically with increasing time delay between the direct sound and the reflection. Compared to anechoic stimuli, thresholds are increased for reverberant stimuli by about 510 dB. Thresholds decrease less with increasing time delay compared to anechoic stimuli, and the range between experimental conditions is greater. For a given direction of the direct sound, the magnitude of the azimuth angle generally causes a decrease in thresholds. With the direct sound at 120°, the maximum azimuth angle difference at 164° corresponds to decreased thresholds for both anechoic and reverberant stimuli by about 10 dB. Comparatively, when the direct sound is at 0°, the effect of the azimuth angle difference is diminished. For example, the threshold for an anechoic reflection with 0° azimuth difference at 3 ms (corresponding to a floor reflection in the modeled room) is –9 dB, compared to – 12dB for an anechoic reflection with an azimuth difference of 72°. For reverberant speech with the direct sound at 0° azimuth, the effect of azimuth difference magnitude can only be seen for the reflection at 72°.
Proceedings of the 2001 International Workshop on Spatial Media, Aizu-Wakamatsu, Japan, Oct. 25-26, 2001
Figure 4. Mean threshold values for 9 subjects for tone burst stimuli under anechoic and reverberant conditions. “Direct” refers to angle of direct sound in degrees, and “Az. Dif.” refers to the azimuth difference in degrees between the direct and reflected sound (ref. Table I). Figure 4 indicates results for tone burst stimuli. The thresholds are overall about 5-8 dB lower than for equivalent speech stimuli. For a given direction of the direct sound, the increase in azimuth difference corresponds to about a 5 dB decrease in threshold levels. At 30 ms, the threshold levels are nearly the same across conditions. For both anechoic and reverberant speech stimuli, and for the most part for the tone burst stimuli, the lowest thresholds are for the direct sound at 120°, with the 164° azimuth difference. This represents a direct sound coming from the right rear surround loudspeaker and a reflection arriving from the left wall. In this case, the direct sound has a relatively high interaural time difference with a left ear lead-right ear lag, and for the reflection the same high interaural time difference but with a right ear lead-left ear lag. This situation represents the maximum lateral difference between the direct sound and the reflection, and would yield the lowest interaural cross-correlation for subjects. Under these conditions, it is likely that subjects attended to a binaural cue (image broadening) for that class of stimuli, which may be easier to detect compared to ascertaining the timbre cue present when the direct and reflected sound were azimuthally co-located at 0°, or separated by only 48°. Table II. Results of paired t-test comparing speech stimuli data for direct sound at 0 degrees, reflection at 72 degrees, to direct sound at 120 degrees, reflection at –76 degrees, at each time delay evaluated.
3 ms p = .005 3 ms p =