Early Results from 3DESS: A 3D Engineering Shape Search System. Natraj Iyer, Kuiyang Lou ... Estimates suggest that more than 75% of engineering design activity ...... techniques to support a 3D engineering shape search system. Since our ...
Early Results from 3DESS: A 3D Engineering Shape Search System Natraj Iyer, Kuiyang Lou, Subramaniam Jayanti, Yagnanarayanan Kalyanaraman, Karthik Ramani School of Mechanical Engineering, Purdue University West Lafayette IN 47906 USA {iyern, kuilou, jayantis, yagna, ramani}@purdue.edu
ABSTRACT Estimates suggest that more than 75% of engineering design activity comprises reuse of previous design knowledge to address a new design problem. This paper presents a brief overview of a novel approach to search for 3D models. The system is built on a clientserver-database architecture. The client takes in the query input from the user along with his search preferences and passes it to the server. The server converts the shape input into feature vectors and a unique skeletal graph representation. Details of the algorithms to perform these steps are presented here. Principal advantages of our graph representation are: (i) it preserves geometry and topology of the query model, (ii) it is considerably smaller than the B-Rep graph, and (iii) it is insensitive to minor perturbations in shape, but sensitive enough to capture the major features of a shape. Critical database issues such as search system efficiency, semantic gap reduction and the subjectivity of the similarity definition are addressed. This paper reports our initial results in designing, implementing and running the shape search system.
1. Introduction Designers spend about 60% of their time in searching for the right information and it is rated as the most frustrating of an engineer’s activities [1]. In engineering, it is conservatively estimated that more than 75% of design activity comprises case-based design – reuse of previous design knowledge to address a new design problem [2]. However, physical inventories such as tooling and associated knowledge are often not located or reused resulting in significant
losses. Design and associated knowledge reuse is the key to reducing new product development time. Engineering design and manufacturing has progressed extensively from 2D to 3D in the last decade. As a result, shapes of products and associated tooling have considerably increased in complexity and number, contributing to the 3D model explosion. A significant amount of knowledge generated during design and manufacturing is attached to the 3D model. Most of this information (context) is in the form of documents, images and text. The simplest form of searching is by searching for keywords in filenames, part numbers or context attached to the CAD model. Current Product Lifecycle Management (PLM) systems allow partname based searching of 3D models. However this method is not robust primarily because of the following reasons: 1. 2. 3. 4.
All models will not have a well-defined attached context Keywords such as project names or part names may be unknown to the user Context may be too narrow or too broad to retrieve relevant models Context changes with time - such as when designers or naming conventions change.
Although a large part of our brains are devoted to the processing of shape, the visual channel has not been exploited for information retrieval in engineering. A search system which is capable of retrieving similar 3D models based on their shape will retrieve shape and related knowledge that would not be discovered by other means. Furthermore, designers relate products to 3D shapes more than to meta-data and hence a shape based system can provide an answer where other methods fail. However, effective deployment of a search system would require a combination of text and shape based searching.
There have been limited attempts in searching for 3D CAD models. To the best of our knowledge these approaches are based on a single, predefined and often oversimplified model of similarity. However, 3D search techniques focused on realistic engineering models have very different considerations than searching for 3D geometry in other domains. Based on our discussions with personnel from design, manufacturing, and cognitive psychology we confirmed that similarity is very much an applicationdriven and user-perceived notion. A universal similarity metric is impossible to formulate. Our discussions also helped us generate a needs checklist for a shape search system as shown below: 1.
2.
Sensitivity: The system must be sensitive to large variations in shape. However, it must also be invariant to trivial perturbations in shape. Similarity Measure: We treat similarity as a customizable user decision. A user can construct a similarity metric “on-the-fly” and be able to change it real-time after looking at preliminary results.
3.
Efficiency: The algorithms developed for performing similarity searches must be computationally efficient. Although database indexing could take time, subsequent processing and searching should be efficient.
4.
Effectiveness: The system must be effective enough to find the relevant results in a limited number of retrieved models. This is related to reducing the “semantic gap” between the user’s similarity notion and the database similarity metric.
5.
Global vs. Local: We also found that most users would like to know which local areas of two parts were similar or dissimilar. This requires that we store local and global shape attributes or information.
6.
Query Interface: The query interface must allow for multiple modes of inputs – quick, approximate shape creation through sketching, selecting a query model from a cluster of parts and construction of a user-driven similarity metric.
2. Related Work Almost all related methods for matching 3D shapes decompose a shape into a signature. Based on the methods used to convert a shape to a signature, they can be classified into the following categories:
1.
Invariant/Descriptor based: These methods use invariants or descriptors of the 3D shape such as volume, surface area, aspect ratio, higher order moments or moment invariants as signatures [3].
2.
Harmonics based: These approaches use a set of harmonic functions of a shape as its signature. Spherical or Fourier functions are usually used to decompose a discrete 3D model into an approximate sum of its (first n) harmonic components [4].
3.
Statistics/Probability based: Osada et al. [5] use shape functions and construct a shape distribution by random sampling of points. Ankerst et al. [6] use shape histograms to approximate and search for a 3D model.
4.
3D Object Recognition based: Some 3D object recognition approaches that have been used for 3D shape searching are Aspect Graphs [7], Spin Images [8], and Geometric Hashing [9].
5.
Graph based: Graph based approaches have employed subgraph isomorphism for matching BRep graphs [10], matching eigenvalues of a model signature graph (MSG) constructed from the BRep graph [11]. A multi-resolution Reeb graph that captures the topology of a part was proposed in [12].
6.
Feature Recognition based: Ramesh et al. [13] decompose a part into cells which are further processed to identify machining features and their spatial relationships to calculate similarity between parts. Ascher et al. [14] simplify parts into maximal feature subgraphs (MFSG) which are matched to obtain a similarity measure.
7.
Group Technology based: A two step Group Technology (GT) method was developed in [15] to compare similarity between parts. A Type Abstraction Hierarchy (TAH) was proposed in [16] as an alternative to GT.
Most previous approaches are bipolar – too granular (categories 4, 5, 6) or too lumped (categories 1, 2, 3, 7). Granular approaches represent the shape in great detail making the search intractable, while lumped approaches combine all shape characteristics into a single quantity. Furthermore, they do not address the problem of reducing the semantic gap and are not scalable. The input to most systems is a detailed model or a detailed drawing, which is unrealistic in an engineering design situation. The designer, depending on the stage of design may not know the detailed shape of the model he/she is searching for. Feature vectors and similarity metrics are predefined within most systems, thus making it impossible for the user to
define a custom similarity measure. Importantly, an application domain is not considered in most methods. The notion of similarity for engineering shapes is cognitively different than that for other shapes.
3. Search Process As seen in Figure 1, the search system consists of a Client-Server-Database architecture. The Client end consists mainly of the user interface which enables query creation and display of results. The Server side essentially takes in the shape input from the Client and converts it into multiple representations (voxel, skeleton, feature vectors and skeletal graph), which are then stored into the Database. Our approach makes the following major contributions: 1. Customized user query construction. 2. Only “essential” shape features are captured 3. Represents shape as a combination of both geometry and topology. 4. Multi-level shape representation. 5. Accurate and computationally efficient.
3.2.1. Voxelization Voxelization is defined as the process of converting a geometric representation of a synthetic model into a set of voxels (volume elements) that best represents the synthetic model within the discrete model space. In recent years, a number of curve, surface and polygon mesh voxelization algorithms have been proposed. Most algorithms provide efficient ways to extend 2D scan conversion methods to the 3D domain. The important difference between 2D scan conversion and voxelization is that voxelization is decoupled from the rendering process and hence is a one-time process. The most dominant solid representation methods are Boundary Representation (B-Rep) and Constructive Solid Geometry (CSG). BRep describes a part in terms of its vertices, edges and faces. CSG describes the part in terms of a set of Boolean operations applied to primitive geometric entities such as cubes and cylinders. Query Results Query-byexample
Query-bysketching
Feature Vector Choice Interface Model Geometry
Voxel Attributes
Dimensions
Voxelization Parameters
Surface/Volume Parameters
3.1 User Interface The function of the user interface is to allow a user to create a custom query, either by example or by sketching, and to display the search results. The primary function of the user interface is to enable the following user interactions:
2.
3.
Query-by-example: A query is initiated by choosing a part most similar to that the user desires. Part choice will be enabled by the user interface that will enable a user to drill down through clusters of similar parts to find a part to start searching with. Query-by-sketching: A query is initiated by the user by quick sketching of an approximate 3D mock-up of the model he/she is interested in searching for. Alternatively, a user could also specify the location of a CAD file at the Client end. The sketch interface is based on a web-based collaborative system implemented in Java™ and uses an ACIS modeling kernel [17]. Feature Vector Choice Interface: The user can customize the feature vectors to be used in the search. This enables the user to “reconfigure” the search at any time.
3.2. Server The first step in converting 3D models to a searchable representation is Voxelization, prior to which the model is normalized into a canonical form independent of position, orientation and scaling.
Basic Entities
Principal moments
Topology Relations
Higher order invariants
Graph based
CLIENT
Query-bySketch L2
E2
L1
E1
1.
Skeleton Attributes
Moments / Invariants
E3
Voxelization
Skeletonization
SERVER
Query-by-example
7
1
5
10 11 13
3
8
12
4
9
P0 P1
P2
14
2
L3
Skeletal Graph
6
P0 P1 P2 P3 P4 P0 P1
P0 P1
P0 P1 P2 P3
P0
P2
P3 P4
P0 P1 P2 P3 P4
P1
P2 P3 P4
P0
P1
P3
P2 P3
P0
P1
0
P0 P1
Multidimensional Index
Neural Network
Clustering
Subgraph isomorphism
DATABASE
Figure 1: Architecture showing different query processes and the components of the search system It is difficult to voxelize a B-Rep solid because the interior is not explicitly defined. Except for the pointclassification method proposed in [18], there has not been any efficient voxelization method proposed for BRep solids. However, advances in parallel computation, hardware and computational power have made voxelization of B-Rep solids almost real-time. Most 3D CAD systems such as Pro/Engineer™, SolidWorks™ and IDEAS™ use a B-Rep representation as their internal data structure. Furthermore, there is no unique CSG representation standard for a part. Therefore, in this paper, we only consider B-Rep models since most engineering parts are either available in B-Rep formats
or can be easily translated into a neutral B-Rep representation such as STEP.
3.2.2. Skeletonization The notion of a skeleton was introduced by Blum [19]. Skeletonization is the process of extracting a skeleton from a 3D binary image (voxel model). The model can be converted into a binary 3D digital model. However, in digital spaces, only an approximation to the “true skeleton” can be extracted. The two requirements for a skeleton are: 1.
Topological: A skeleton must retain the topology of the original object.
2.
Geometrical: A skeleton must be in the “middle” of the original object and must be invariant to translation, rotation and scaling.
correctness is more important than geometrical correctness. We use the skeletonization algorithm described in [22].
3.2.3. Skeletal Graph Generation The skeleton is converted into a hierarchical skeletal graph, for storing in database. This graph can be analyzed at different levels depending on information content. The main approaches in the past have been to convert the skeleton into a voxel graph [23] or into a skeleton tree [24]. We convert the skeleton into a skeletal graph made up of the following basic skeletal entities: 1.
Node – the voxel situated at the ends of the edges
2.
Edge – Set of voxels forming a single geometric entity
The three major skeletonization techniques are:
3.
Loop – One or more edges forming a closed entity
1.
Voronoi-based: The Voronoi diagram of a set of discrete points (generating points) is the partition of the given space into cells. If the density of boundary points of the 3D image goes to infinity, then the corresponding Voronoi diagram converges to the skeleton. The exact Euclidean skeleton is usually approximated by a subgraph of the Voronoi diagram [20].
Each edge in the skeleton translates into an independent geometric entity giving a shape to the model in physical space. Similarly, each loop represents a hole in the 3D model. For example, if a user wants to search for models with holes, it can be completed by searching for graphs with loops. Thus the skeletal graph is more physically relevant than feature relationship graphs, but simpler than the B-Rep graphs.
2.
Distance transform based: Distance criteria such as 4-neighbor (city block), 8-neighbor (chessboard) or (3, 4) chamfer distance are used to convert a 3D image into a distance map representing distances from object boundaries. The local extrema on the distance map appear as ridges and they are detected as skeletal points [21].
3.
Thinning: Thinning is an iterative object reduction technique for extracting skeletons in digital spaces. It can be used to generate approximate medial surfaces or medial axes of the 3D image [22]. Points in the image are deleted if they satisfy deletion conditions that preserve topology.
A skeleton marching algorithm is used to identify the basic entities form the skeleton and to construct the skeletal graph. The algorithm identifies edges and simple loops in the skeleton. Loops which do not share any edge or node with the other loops are called simple loops. To get non-simple loops in the skeleton, the skeleton is analyzed based on the depth first technique. Thus the geometry of the 3D model is captured in the individual entities of the skeleton and topology in the skeletal graph.
We choose thinning as our preferred skeletonization method because it offers advantages over Distance transform and Voronoi based skeletons. Distance transform skeletons satisfy “geometrical” conditions but may not satisfy “topological” conditions. Voronoi based skeletons satisfy both requirements, but are very expensive to compute especially for realistic engineering models. Furthermore, Voronoi skeletons have unwanted appendages which require pruning as an additional process. Thinning satisfies the “topological” requirements but does not always satisfy “geometrical” requirements. However for our application, topological
3.2.4. Feature vector extraction A 3D model is converted into a set of feature vectors for database searching. We extract the following shape descriptors for a 3D model: a.
Moments/Invariants: The three principal moments of the 3D model are extracted using the ACIS API api_body_mass_pr() and stored as a feature vector. Further, the three second order moment invariants for the model are also stored as a feature vector. Moment invariants are by nature independent of orientation. For every voxel in the model translation, rotational and scale invariant second order moments κ lmn are calculated as described below.
∞
∫ ∫ ∫x y l
κ lmn =
m
d ( x, y ) = d ( y , x )
z n ρ ( x, y, z ) dx dy dz
−∞
53 µ000
l+m+n = 2 ,
where µlmn are central moments after translation. The three moment invariants that are calculated are: I1 = κ 200 + κ 020 + κ 002 2 2 2 − κ 011 − κ110 I 2 = κ 002κ 200 + κ 002κ 020 + κ 200κ 002 − κ101 2 2 2 κ 020 − κ 011 κ 200 − κ110 κ 002 I 3 = κ 200κ 020κ 002 + 2κ110κ 011κ101 − κ101
b.
c. d.
Geometry parameters: The geometry parameters stored as a feature vector are the two aspect ratios for the bounding box, model surface area, model volume and the ratio of surface area to volume. Voxelization parameters: The voxel size and the scaling factor obtained during the normalization process are stored as a feature vector. Graph parameters: The number of loops, edges and nodes in a skeletal graph is characteristic of the shape of the 3D model. We store them as a feature vector. Further, the different topological relationships in the skeletal graph like the number of loop-loop, edge-edge and loop-edge connections are also stored as a feature vector.
3.3. Database A similarity measure is a function for quantifying the similarity between two models. It takes the feature vectors of the query model and that of a model in the database and outputs a real number that reflects the degree of similarity between the two models. It is preferable that similarity measures satisfy the metric axioms [25] as follows. Let S be a set of objects, a metric on S is a function d: S × S → ℜ , which satisfies the following metric axioms (Equations 1-5), for all x, y, z ∈ S .
d ( x, x ) = 0
d ( x, y ) = 0 ⇒ x = y
d ( x, y ) + d ( x, z ) ≥ d ( y , z )
d ( x, y ) ≥ 0
(1)
(2)
(3)
(4)
(5)
We use the Euclidean distance between points in feature space to indirectly represent the similarity measure. Clearly, this similarity measure is a metric and is the primary measure of similarity for models based on features.
3.3.1. Database Indexing Index structures are used to speed up searching in large databases, and the design of these structures is a critical issue for any realistic 3D shape search system. The logarithmic query time of B+ tree is in part responsible for the success of relational databases [26]. However, the B+ tree index is basically a one-dimensional index structure, which orders the data records by one attribute at a time. This one-dimensional index structure is not sufficient for 3D shape search systems. The fundamental problem is that the feature vectors representing 3D models are complex data types. Searching is usually based on overall similarity (similarity query) rather than the similarity of individual attributes (attribute query). We have to use all the attributes simultaneously to determine the similarity. In other words, we cannot discard a model from the candidate list only because some attributes do not match the query model. Thus, in order to search similar 3D models efficiently, we need an index structure with properties such that: (1) It is a multidimensional index. The multidimensional index arranges the models using all the feature elements, and (2) It groups similar models and puts them in the same node or contiguous index nodes. This grouping can reduce the disk I/O time during search operations. R-tree based multidimensional indexes have been extensively studied for content-based image retrieval. In such an index, points in feature space are clustered into groups, while a group is represented by a bounding rectangle/hyper-rectangle containing the points. The bounding hyper-rectangle is a tight bounding box that is represented by the coordinates of its corners. To answer a query, the query point is compared with the bounding box in order to prune the sub-tree rooted at this hyper-rectangle, using a nearest-neighbor search. Therefore, the R-tree index satisfies the requirements of the similarity index listed above. The leaf nodes contain pointers to 3D models. The search starts at the root and is directed by internal node to the leaf node. The tree structure is similar to a B+ tree; however, the criterion to arrange the records is totally different from that of B+ trees.
3.3.2. Graph-based Indexing In addition to similarities between feature vectors, we also investigate similarity based on skeletal graphs. Skeletal graphs are undirected entity graphs and are represented as adjacency matrices. We incorporate domain knowledge into our graph data structure, thereby enriching it and enhancing the search capabilities. The adjacency matrix is formulated to capture the structural properties of the skeleton, such as loop-loop, edge-loop connections, etc. This representation reflects the topology and the high-level geometry of the skeletons. The goal of our search system is to retrieve all models that are ‘similar’ and not only those that match exactly with the query model. In graph similarity search, this translates to finding models whose skeletons have isomorphism as well as subgraph isomorphism with the query model. Traditional exact approaches [27] for graph comparison lead to an NPcomplete problem. It is infeasible to efficiently find a solution except for small graphs (typically 30-50 nodes). Therefore, large graphs have to be preprocessed before comparison [28]. Since the skeletonization of 3D models produces graphs of very small size, we are able to considerably reduce indexing and search time for a large number of parts. More than 70 % of the 150 models in our database have skeletons with 8 entities or less. Skeletal graphs are indexed in the database based on a decision-tree based approach described in [28]. The small sizes of our skeletal graphs prove to be inexpensive in terms of indexing time and space requirements for this algorithm. Our system uses a rudimentary similarity measure, which is defined as the ratio of the number of entities that match between two graphs (say, GA and GB) to the size of the larger of the two graphs. # of Matching Entities Similarity(GA , GB ) = x100 Max( GA , GB )
This similarity measure is a metric since it satisfies all the metric axioms described earlier. However, this measure does not take into account the relative sizes of the skeletal entities in determining similarity, and is not refined enough for finer comparison. We are studying the use of additional geometric measures to arrive at a finer similarity measure.
3.3.3. Relevance Feedback The semantic gap and subjectivity of similarity make it difficult to correctly retrieve similar models for a user. Relevance feedback [29] is used to train the
system to reconfigure its similarity definition to reflect user’s preference so as to bridge the “semantic gap of similarity”. This reconfiguration is applied on the lowlevel feature vectors. However, it is impossible for a user to directly adjust the weights of low-level feature elements. The method to circumvent this problem is to present search results graphically to a user, ask the user to evaluate the search results, and give feedback to the system. The system, in turn, identifies patterns in the user’s feedback and adjusts the weights accordingly. Thus a user just deals with the high-level models instead of low-level features. The procedure of relevance feedback consists of the following steps: a. Database query: When the system retrieves some models based on the query example, it will order them by similarity measure of feature vectors and presents them to the user. b. Relevance Feedback: Users classify them into relevant and irrelevant groups and inform the system. c. Query reinterpretation and reconfiguration: The system, in turn, reconfigures itself to reflect the user’s preference, reinterpret user’s intention and performs the search again. d. Repeat Query: This process iterates until either the user is satisfied or the system cannot improve the results further. We utilize user’s relevance feedback for updating the query point to represent user’s query intent. After being presented the search results, the user is given an option to identify the relevant and irrelevant models. In query reinterpretation, the query neighborhood is moved to the centroid of the relevant models. The new query better represents the user’s search intention. The search based on the new query can find more relevant models that were not identified by the previous search. We are investigating other approaches such as weight reconfiguration in conjunction with neural networks.
3.3.4. Clustering In order to enable a user to quickly search a model, our system is designed to provide an easy to browse hierarchical Query-by-example interface as described earlier. This interface will use unsupervised clustering algorithms to form hierarchical similarity-based clusters. Traditionally, there are three major types of clustering algorithms: 1) Hierarchical 2) K-means clustering and 3) Self-Organizing Maps (SOMs). We have used SOMs for forming the cluster maps because they: 1) are amenable to visualization, 2) allow easy interpretation, 3) allow dynamic updating, and 4) are simple to implement. A self- organizing map (SOM) is a clustering algorithm based on a competitive learning
4. Results and Discussions We designed and implemented experiments to test our approaches to deal with challenges for 3D shape search systems, i.e. subjectivity of shape similarity, semantic gap and efficiency. The tests were conducted on a DELL Pentium 2.66 GHz PC with 1.0 GB RAM. The voxelization and skeletonization algorithms were implemented in C++ with ACIS libraries, while the database systems were implemented in Java. In actual deployment, the database will be constantly updated if a change is made to the CAD model, and the server side processes of voxelization, skeletonization, skeletal graph and feature vector extraction are repeated. We tested the ability of the multidimensional Rtree index as well as SOMs to cluster similar models with a real 3D model database, while the efficiency of search operations using the R-tree index was tested using both synthetic and real datasets. The database of the real 3D models currently consists of about 150 models. Although our real database is being expanded, the size is still relatively small as compared to typical design repositories. The sizes of synthetic datasets vary from 50 to 1,000,000 data records. The effects of database size, dimensionality of feature vector, and node volume to the efficiency of the feature vector based search were studied with the synthetic datasets. The synthetic database was created using a random number generator. The utility of relevance feedback to enable a customizable similarity definition and bridge the semantic gap was tested with the real 3D database.
of edges into straight and curved types will increase the precision of our system. As the database is scaled to have more parts, a filtering mechanism will need to be designed. Due to the presence of rich geometric information in our skeletal graphs we will be able to reduce the search space.
4.2 Feature-based Database Indexing The R-tree based multidimensional index was built for the same 150 models in our database. We used the moment invariants as the feature vector. For this database, the index has 62 nodes and 4 levels, with a maximum of five models in each node. The results of a query for this database are presented in Figure 5 of section 4.3. For a synthetic database with 1,000,000 records, the R-tree has 386,829 nodes and 11 levels.
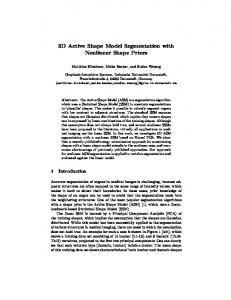
Figure 2: Query results for skeletal graph based searching 900
Ratio of all index nodes to Visited Nodes
approach [30]. It consists of a number of interconnected computational units called neurons, which are laid in either a hexagonal or rectangular topology. As new instances of 3D models are presented to the network, the positions of neurons are updated such that similar neurons move closer while dissimilar neurons move away from each other. Also, similar models are grouped in neighboring neurons, and dissimilar models are indexed in far away neurons.
Dim Dim Dim Dim
800 700 600
3 5 9 20
500 400 300 200 100 0 0
200000
400000
600000
800000
1000000
Number of Records
Figure 3: Ratios of visited nodes at different dimensionality and database size 2000
The decision-tree based index for graph matching was populated with skeleton graphs of the 150 real 3D models. Figure 2 show results for a query on the database. The search results are presented with the rank and similarity values for each retrieved model. Although, the system retrieves all the relevant models in the database, it also retrieves irrelevant parts, since there is no filtering mechanism to reduce the search space. Enriching the skeletal graph structure with more information such as local properties (volume, parametric equations and moments) and classification
Dim 3 Dim 5 Dim 9 Dim 20
1800
Number of Visited Nodes
4.1 Skeletal Graph Generation and Matching
1600 1400 1200 1000 800 600 400 200 0 0
200000
400000
600000
800000
1000000
Number of Records
Figure 4: Numbers of visited nodes vs. dimensionality and database size
The primary indicators of the search efficiency are the number of visited nodes and ratio of visited nodes during a search operation. The visited nodes are loaded into the temporary memory (RAM) from the database during search operations. The query model is compared with the models in the retrieved node to determine the search direction or to compute similarity. The ratio of visited nodes is the ratio of the total number of nodes to the number of visited nodes. Since disk I/O is the bottleneck for current computer systems, the number of nodes visited directly translates to the number of disk I/O operations, which directly impacts overall performance. The ratio of visited nodes indicates the improvement that R-tree achieves compared to an exhaustive search. Figures 3 and 4 show some results from testing synthetic data sets with different sizes and dimensionality, respectively, when the node volume is five. Dimensionality is the number of feature elements that describe a 3D model.
4.4 Database Clustering The multidimensional R-tree structure indexes models based on their similarity into the same or contiguous nodes. Figure 7 presents a few examples of the 3D models clustered in the nodes of the R-tree. However, it must be noted that R-tree is not optimized for clustering. Therefore, in this study, self-organizing maps were studied for clustering 3D engineering parts based on the second-order moment invariants. The architecture of the SOM consists of 64 nodes in an 8 x 8 hexagonal topology, while training was continued until 800 iterations.
4.3 Relevance Feedback Figures 5 and 6 are the models retrieved by the search system before and after query reconstruction based on relevance feedback. The top-left model is the query model. These results were obtained by using the moment invariants as the features. It can be seen from Fig. 6 that the similarity is recomputed and the system retrieves a larger number of similar models after relevance feedback than before. These results illustrate the effectiveness of relevance feedback in retrieving similar parts and reducing the semantic gap between the user and the feature space.
Figure 7: Models clustered in the R-tree nodes Figure 8 illustrates three sample nodes that were generated by the Self-Organizing Map (SOM). The models grouped by the SOM in each of the three sample nodes are similar. Due to space constraints we are unable to present all the results from the two methods for comparison. In the future, we will use data clustering algorithms to group similar models into clusters prior to insertion in the R-tree. This will improve the performance of the multidimensional index. We will also explore methods to cluster models based on the skeletal graph representations.
Figure 5: Search Results before relevance feedback. The top left model is the query. Figure 8: Models clustered in SOM nodes
5. Conclusions
Figure 6: Search Results after relevance feedback. The top left model is the query.
The paper has introduced the database and related techniques to support a 3D engineering shape search system. Since our system level representation is based on a neutral voxel format, changes in standards such as CAD formats and parametric models will not affect the search process.
Skeletal graphs, which capture topological properties of 3D models, were used for searching 3D models utilizing graph-matching algorithms. Parts retrieved from various queries were ranked based on a similarity measure developed in the study. To the best of our knowledge, this paper is the first to demonstrate the feasibility of using skeletal graphs for 3D shape search. An R-tree based multidimensional indexing technique was used to speed up the content-based 3D shape retrieval effectively. Preliminary testing on a synthetic database showed the scalability of the system. To improve the similarity indexing ability of the Rtree, we investigated the use of clustering algorithms to pre-classify the models. Preliminary results show that the clustering algorithms perform better than the R-tree in grouping similar models. A relevance feedback mechanism, namely, query reconstruction was used to improve the effectiveness of the search system. Additional tests on large databases are required before more conclusions can be drawn. The system performance will be tested against other available approaches in the 3D shape search domain. Furthermore, a precision vs. recall study will be performed. Additionally, methods for searching for local features in the shape will be developed.
Acknowledgements The initial funding for this project came from the 21st Century Research and Technology Fund award from the state of Indiana. We also acknowledge the University Faculty Scholar Award from Purdue University for Professor Karthik Ramani, which seeded this project. We also thank Innovation Realization Laboratory at Purdue University for supporting Natraj Iyer. We also thank Dr. Christoph Hoffmann and Dr. Sunil Prabhakar, Department of Computer Sciences, Purdue University for their valuable discussions.
References [1]. Leizerowicz, W., Lin, J., and Fox, M.S., (1996), “Collaborative Design Using WWW”, Proceedings of WET-ICE '96, CERC, University of West Virginia [2]. Ullman, D.G., (1997), “The Mechanical Design Process”, 2nd Edition, McGraw-Hill [3]. Cybenko, G., Bhasin, A., and Cohen, K., (1997), “Pattern Recognition of 3D CAD Objects”, Smart Engineering Systems Design, Vol. 1, pp.1-13
[4]. Kazhdan, M., Chazelle, B., Dobkin, D., Finkelstein, A., and Funkhouser, T., (2002), “A Reflective Symmetry Descriptor”, Proceedings of 7th European Conference on Computer Vision, Copenhagen, Denmark, pp. 642-656 [5]. Osada, R., Funkhouser, T., Chazelle, C., and Dobkin, D., (2002), “Shape Distributions”, ACM Transactions on Graphics, Vol. 21, pp. 807-832 [6]. Ankerst M., Kastenmüller G., Kriegel H-P., Seidl T., (1999), “3D Shape Histograms for Similarity Search and Classification in Spatial Databases”, Proceedings of 6th Symposium on Large Spatial Databases, pp. 207-226 [7]. Cyr, C.M., and Kimia, B., (2001), “3D Object Recognition Using Shape Similarity-Based Aspect Graph”, Proceedings of ICCV’01, pp.254-261 [8]. Ruiz-Correa, S., Shapiro, L. and Meila, M., (2000), “A New Signature Based Method for Efficient 3D Object Recognition”, Proceedings of CVPR’00, SC [9]. Lamdam, Y. and Wolfson, H.J., (1988), “Geometric Hashing: a general and efficient model based recognition scheme”, Proceedings of ICCV’88 [10]. El-Mehalawi, M., and Miller, R., (2003), “A database system of mechanical components based on geometric and topological similarity. Part I: representation and Part II: indexing, retrieval, matching, and similarity assessment”, Computer Aided Design, Vol. 35, pp. 83-94 [11]. Sun, T-L., Su, C-J., Mayer, R., and Wysk, R., (1995), “Shape similarity assessment of mechanical parts based on solid models”, Proceedings of ASME DFM Conference, Boston, MA, pp. 953-962 [12]. Hilaga, M., Shinagawa, Y., Kohmura, T., and Kunii, T., (2001), “Topology matching for fully automatic similarity estimation of 3D shapes”, Proceedings of SIGGRAPH’ 01, pp. 203-212 [13]. Ramesh. M., Yip-Hoi, D., Dutta, D., (2001), “Feature Based Shape Similarity Measurement for Retrieval of Mechanical Parts”, Vol. 1, pp. 245256 [14]. Ascher, M., Marefat, M, and Fasse, E, (2001), “A methodology for automatic retrieval of similarly shaped machinable components”, IEEE International Conference on Systems, Man, and Cybernetics, Vol. 2, pp. 2840-2845 [15]. Iyer, S. and Nagi, R., (1997), “Automated Retrieval and Ranking of Similar Parts in Agile
Manufacturing”, IIE Transactions on Design and Manufacturing, Vol. 29, pp. 859-876 [16]. Srinivas, G.., Fasse, E., Marefat, M., (1998), “Retrieval of similarly shaped parts from a CAD database”, IEEE International Conference on Systems, Man, and Cybernetics, Vol. 3, pp. 28092814
Ullman, J.R., 1976, “An algorithm for [27]. subgraph isomorphism”, Journal of the Association for Computing Machinery Vol. 23, pp. 31-42 [28]. Messmer, B., and Bunke, H., 1995, “Subgraph isomorphism in polynomial time”, Technical Report TR-IAM-95-003
[17]. Agrawal, A., Ramani, K., and Hoffmann, C., (2002), “CADDAC: Multi-Client Collaborative Shape Design System with Server-Based Geometry Kernel”, Proceedings of ASME DETC’ 02 CIE Conference
[29]. Efthimiadis, E.N., 2000, “Interactive Query Expansion: A User-based Evaluation in a Relevance Feedback Environment,” Journal of the American Society for Information Science, Vol. 51 No. 11, pp.989-1003
[18]. Lee, Y., and Requicha, A., (1982), “Algorithms for computing the volume and other integral properties of solids”, Communications of the ACM, Vol. 25, pp. 642-650
[30]. Kohonen, T., 1995, “Self-Organizing Maps”, Springer Series in Information Sciences, Springer Verlag, Berlin
[19]. Blum, H., (1967), “A transformation for extracting new descriptors of shape”, Models for the Perception of Speech and Visual Form, eds. E. Dunn, Cambridge, MA, pp. 362-380 [20]. Pudney, C., (1998), “Distance-Ordered Homotopic Thinning: A Skeletonization Algorithm for 3D Digital Images”, Computer Vision and Image Understanding, Vol. 72, pp. 404-413 [21]. Niblack, C., Gibbons, P., Capson, D. W., (1992), “Generating Skeletons and Centerlines from the Distance Transform”, Graphical Models and Image Processing, Vol. 54, pp. 420-437 [22]. Palagyi, K., and Kuba, A., (1998), “A 3D 6subiteration thinning algorithm for extracting medial lines”, Pattern Recognition Letters, Vol. 19, pp. 613-627 [23]. Reinders, F., Jacobson, M., and Post, F., (2000), “Skeleton Graph Generation for Feature Shape Description”, in Proceedings of Data Visualization 2000, pp. 73-82 [24]. Park, J., and Chang, D., (1999), “A Hierarchical Skeleton-Based Shape Description”, KSPC '99, POSTECH, Korea, pp. 597-600 [25]. Santini, S., and Jain, R., 1999, “Similarity Measures,” IEEE Transactions on Pattern Analysis and Machine Intelligence, Vol.21, No.9, pp.871880 [26]. Hellerstein, J.M., Koutsoupias, E., Papadimitriou, C.H., 1997, “On the Analysis of Indexing Schemes,” SIGMOD-SIGART Symposim on Principles of Database Systems, pp 249-256