Indonesian Journal of Electrical Engineering and Computer Science Vol. 5, No. 1, January 2017, pp. 220 ~ 228 DOI: 10.11591/ijeecs.v5.i1.pp 220-228
220
Early Test Effort Prediction using UML Diagrams Pulak Sahoo*, J. R. Mohanty School of Computer Engineering, KIIT University, Campus-15, Bhubaneswar, India, 751024, Telp 91 674 6550115 Corresponding author, e-mail:
[email protected]*,
[email protected]
Abstract Software Testing is essential for delivering quality software products. Accurate test effort estimation is an important part of project planning. Prediction of test effort at early phases of Software Developmen Life Cycle enables managers to plan ahead for the testing phase. This increases the chances of the project meeting its timeline while achieving required quality. Unified Modeling Language is a widelyused standard for representing Object Oriented Systems. Use Case and Class Diagrams are two of the most important models of the system created during early phases of software development. This work proposed that the initial test effort is predicted early using Use Case Diagram during the requirement stage and is refined during design stage when Class Diagrams are available. The predicted test efforts in both stages are functions of parameters derived from Use Case and Class Diagrams. Estimations can be revised when rest of the UML diagrams are created. Keywords: Use Case Diagram, Class Diagram, Use Case Points, Class Point, TEI Copyright © 2017 Institute of Advanced Engineering and Science. All rights reserved.
1. Introduction Software Testing is essential for realizing quality software. A large number of software products get delivered to the customers without sufficient testing. This causes adverse customer reaction affecting organization’s image and reputation. Due to this, software development organizations are increasingly focusing on testing with teams specializing on testing activities. In order to conduct test activities efficiently, proper planning is required. Planning can only be done based on estimated test effort. Hence, it is necessary to predict the test effort of the software product in early phases of Software Development Life Cycle (SDLC). Early and reasonably accurate prediction of test effort has many benefits. It enables the managers to plan for the duration and manpower. This helps in the project meeting it’s timeline while achieving required quality. Test effort estimation at an early stage of SDLC, is a relatively uncharted area and has its challenges. Limited information is available about the system in initial phases of SDLC. Typically, only functional requirements are available during the requirement phase. As time and work progresses, more and more information about the system become available. Hence, there is a need for an early test estimation in the requirement analysis phase which can be refined when more information is available in subsequent phases. Unified Modeling Language(UML) has been the most prevalent language-independent standard for representing systems from Object Oriented viewpoint. It provides well structured models through various diagrams at different stages of SDLC representing different views of the system. The UML models developed with sufficient amount of information helps in measuring the complexity and size of system with reasonable accuracy. This information can also be used to produce both test cases and test effort estimates. As part of UML models, the Use Case Diagrams are widely used to create an early model of the system. Use Case Diagrams are abstract representations of the system prepared in the requirement analysis phase while finalizing the functional scope of the system. Because of their early availability, Use Case Diagrams are the most suitable inputs for test effort estimation at early requirement stage. But the estimation obtained from Use Case Diagrams is an initial estimation which needs to be refined when more information is available. Classes are the logical building units of Object Oriented Systems(OOS). Class Diagrams representing structural entities of the system are developed during design phase. Class Diagrams are network of identified classes and represent relationships between them. Several basic relationships and their variants like association,
Received September 14, 2016; Revised December 5, 2016; Accepted December 20, 2016
221
ISSN: 2502-4752
aggregation, composition and inheritance etc. are represented in a Class Diagram. During the design stage Class Diagrams form the inputs for estimating the test effort. As the development progresses, more UML diagrams such as Sequence, Activity and State Chart diagrams become available. The estimation can then be refined further by using these diagrams as and when they are available. This work proposes estimation models for predicting test effort at early phases of SDLC for OOS. The initial test effort is estimated using Use Case Diagram during the requirement analysis phase and it is refined using Class Diagrams during design phase. It also states that the first predicted test effort is a function of attributes or parameters obtained from Use Case Diagrams and the second test effort is a function of parameters obtained from Class Diagram. The rest of this paper is organized as follows. In Section 2, some notable works done in the area of development and test effort estimation are discussed. Section 3 presents proposed approach for estimating test effort at early stages of SDLC based on UML Use Case and Class Diagrams. Section 4 shows the proposed implementation steps along with its architecture. Finally, the conclusions of this work and plans for future works are presented in Section 5.
2. Related Work In this section, we discuss some notable effort estimation work done in the recent past for development as well as testing of software systems. We also summarize the models, techniques and methodologies employed by the authors to estimate effort. Function Point Analysis (FPA) proposed by Albrecht [1] is a well accepted technique to estimate size of a software system in terms function points (FPs). The development effort can be calculated from size of the system (in FPs) by taking into account Technical Complexity Factors (TCF) and productivity factor of the organization. In 1996, Caper Jones [2] proposed a model to estimate test effort based on FPA. As per his model, the number of test cases can be 1.2 calculated from FPs using formula: Number of Test Cases = (Function Points) . In 1999, paper [3] proposed Test Point Analysis (TPA) method which uses (FPA) as the basis for system test effort estimation. TPA takes below three factors as inputs to produce the test estimation in terms of Test Points (TPs). (1) Size of the system in FPs, (2) Testing strategy used and (3) Productivity factor of the organization (number of test hours required per test point). This test effort estimation also takes into account a number of environmental factors that influence test activities. To its advantage, FPA based methods can be applied to a system at an early stage when functional requirements are ready. But, this approach requires detailed requirements and is more suitable for procedural systems than OOS. In addition to this, the process of collecting the required information and applying FPA to a software system is labor-intensive. In 2007, paper [4] suggested a model for estimating test execution effort of a test suite based on the size and complexity of test cases. The input for this model is a test suite written using controlled natural language(CNL) concisely in a standard manner. The output of this model is the size of a test suite in terms of Execution Points(EPs). This model analyzes the steps in the test case to assign EPs and then sums the EPs to get size of the test suite. The test execution effort is then calculated by multiplying a conversion factor(CF) to EPs using formula: Effort= (EP * CF). CF is the productivity of the organization’s test team. This work justifies the estimation accuracy through empirical study. But, it requires test cases to be ready before applying the estimation model. Hence it cannot be applied in early stages of SDLC. Use Case Points methodology (UCPM) was introduced by Karner [5] for early estimation of development effort from software’s Use Cases. In 2001, Nageswaran [6] developed a method to estimate acceptance testing effort based on UCPM [7]. For this, software’s Use Cases were used as inputs and below of steps are followed. (i) Identification and classification of Actors and Use Cases to get Unadjusted Actor Weight (UAW) and Unadjusted Use Case Weight (UUCW), (ii) Summation of both to get Unadjusted Use Case Points(UUCP), (iii) Calculation of Adjusted Use Case Points(AUCP) by factoring in 9 technical and environmental complexity factors, (iv) Calculation of final test effort by multiplying the AUCP with CF defining the productivity. Effort = (AUCP * CF). This approach can be used for early estimation of test effort. But, limited explanation is given about the basis for deciding the technical and environmental factors. Historical data influences the accuracy of this estimation.
IJEECS Vol. 5, No. 1, January 2017 : 220 – 228
IJEECS
ISSN: 2502-4752
222
In 2009, paper [8] proposed N-Weighted test effort estimation method based on Nageswaran’s approach. This method refined the classification of Use Cases by separating normal and exceptional scenarios and assigning different weights to those. This work suggests that normal scenarios need greater number of checks and more time to test compared to exceptional scenarios which generally results in well defined error messages. The weights assigned to both types of scenarios are determined based on historical data. Remaining steps are similar to Nageswaran’s UCP calculation steps. The authors claim that the N-Weighted method is more refined then Nageswaran’s method as it separates normal scenarios from exceptional scenarios. This increases the complexity of the method. There is also a need for collecting appropriate historical data for improving estimation accuracy. In 2011, paper [9] proposed a simplified way to estimate software development effort based on UCPM. By performing factor analysis, this work observed that some environmental and technical complexity factors have minor influence on accuracy of UCP. So the number of factors was reduced from 21 to 6. The selection of these 6 factors was done by experts with relevant skills and experience. This work also suggested that the UCP computation based on Use Case steps were more accurate than the one based on transactions. This approach simplifies UCPM without compromising estimation accuracy. But, it estimates development effort not test effort. As expressed by the authors, the limitations in this work are related to small size of the considered projects and lack of heterogeneity. As in case of UCP approach, the estimation accuracy depends on expert judgement. Paper [10] proposed a model for early test execution effort estimation for a given test suite. The input to this model is requirements in form of Use Cases. Calculation of effort is based on test suite execution vector which contains three factors: (i) Number of test cases, (ii) Test execution complexity based on a set of complexity factors and (iii) Tester rank based on testing experience and domain knowledge. This estimation approach can applied at an early stage of SDLC. But, the accuracy of estimation is dependent on expert opinions and historical data. More research is needed to analyze the logical relationship between Use Case specification and test case specification. In 2005, paper [11] presented an approach called Class Point(CP) to estimate size and effort of OOS. The CP estimation process has three major stages: (i) First the design documents are analyzed to identify and classify the classes into four types (problem domain type, human interaction type, data management type, and task management type). (ii) Each class is given a complexity level based on local methods in the class and it’s interaction with rest of the system. This happens in two steps. An initial size estimation called CP1 is done based on weights assigned to classes using two metrics, namely NEM (number of external methods) and NSR (number of Services Requested). CP1 is then refined with a second estimation CP2 based on an additional metric NOA (number of attributes) apart from NEM and NSR. The class weights are summed to get Total Unadjusted Class Point (TUCP). (iii) Finally, the CP is calculated by multiplying TCF with TUCP. CP=(TUCP * TCF). TCF is determined from influence of 24 different system characteristics. It depends on expert judgement. More research is needed to determine the effectiveness of TCFs on the final estimation. Three class metrics, namely, methods, attributes and interaction with other classes are used for estimation. In 2006, paper [12] proposed a method for early development effort estimation in terms of UML points. UML Points of a system is calculated by combining UCP and CP [11]. The steps for calculating UCP and CP were discussed earlier in this section. In this work, refinements were done to calculate both UCP and CP by taking a number of additional metrics into account. Classes were divided into four categories instead of three for better estimation accuracy. UML Points approach estimates development effort. As expressed by the authors, there is a need for more research to understand relationships between metrics and complexity. As in case of UCP and CP approaches, the estimation accuracy depends on expert judgement. Paper [13] presented an approach in which a Use Case Diagram is converted into Use Case Diagram Graph (UDG) and Sequence diagram is converted into Sequence Diagram Graph (SDG). Then, UDG and SDG are combined to form System Testing Graph (STG). The STG is then traversed to generate test cases [14]. This work can be extended to estimate test effort by taking into account the number and complexities of the test cases. Sequence diagrams are only available in detail design stage which is not early enough.
Early Test Effort Prediction using UML Diagrams (Pulak Sahoo)
223
ISSN: 2502-4752
Some of the issues with above mentioned models are labour-intensive collection of input metrics which proved to be costly, over-dependence on expert decision, historical data dependency, inaccuracies, process complexity and lack of early estimation. From the above study, it becomes clear that there is a necessity to develop a simple approach for early test effort estimation while maintaining reasonable accuracy. In this work we propose an approach which will be able to provide an estimation of test effort as early as possible in the SDLC. Based on this estimation, the project manager can start planning for resources and prepare initial schedule for testing activities. This estimation will undergo revisions in later stages as requirements become clearer and more details are available.
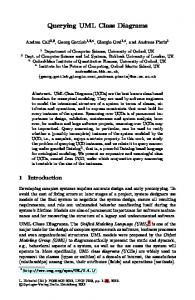
3. Proposed Approach We propose the below approaches for estimation of test effort based Use Case Diagram in the requirement phase and Class Diagram during the design phase. 3.1. Effort estimation for System Testing using Use Case Diagrams: During the requirement gathering stage, the project team works with the customer to finalize functional scope of the system. Use Case Diagrams, which are prepared to describe the system from customer’s view point, become inputs for test effort estimation at this stage. The main elements of a Use Case Diagram are: Use Cases, Actors and Associations (Actor taking part in the Use Case). Apart from these, Use Cases can have different kinds of relationships among them. The relationship can of types: Include, Extend, Inheritance, Dependency etc. Figure 1 shows Use Case Diagram [15] for ‘Hospital Management’ system.
Figure 1. Hospital Management – Top level Use Cases
3.1.1. Use Cases and their Complexity with Respect to Testing Use Cases represent different kinds of system requirements like functional units, architectural parts or allocation of functions to classes etc. In this work we will use system-level Use Cases [9] which are accompanied by Use Case scenarios [16]. The Use Case scenario can be of different types. The main scenario contains the primary sequence of activities to achieve a goal, extension or alternative scenario to the main scenario contains alternative activities. The exception scenario contains error handling activities.
IJEECS Vol. 5, No. 1, January 2017 : 220 – 228
IJEECS
ISSN: 2502-4752
224
Use Case Transactions are present in Use Case scenarios. A Transaction contains set of related activities which must performed together. Complexity of a Use Case with respect to testing is determined based on number of Transactions present in it. Some authors expressed that a Use Case’s complexity can be measured by Steps contained in it. In their view, a Transaction may have one or more Steps in it. But, we will follow Jacobson’s guideline which suggests each Step of a Use Case corresponds to a Transaction. Hence, the total number of transactions in each Use Case will determine its testing complexity. A Use Case’s complexity depends upon types of scenarios in it. Testing of normal scenarios require more number of checks compared to exceptional scenarios [8] that result in specific errors. Hence, weight assigned to a normal scenario needs to be higher than that assigned to an exceptional scenario. The complexity of a Use Case can also depend on how many Actors are interacting with it. The classification of Use Cases for test effort estimation is different from that for development effort estimation. For improved accuracy, we will use four categories (Simple, Medium, Complex and Very Complex) to classify Use Cases based on their complexity weights. 3.1.2. Actors and their Complexity with Respect to Testing An Actor (a person or an external system) performs a series of transactions in a dialogue with Use Cases of the system. An Actor can participate in one or more Use Cases and vice versa. Actor classification will depend upon their mode of communication with the Use Cases. For example, Actors may interact with Use Cases through GUI, API, some ProtocolDriven Interface or Data Store. The complexity of an Actor also depend on how many Use Cases it is interacting with. The classification of Actors for test effort estimation is different from that for development effort estimation. We will assign four classes (Simple, Medium, Complex and Very Complex) to Actors based on their complexity weights. In our proposed estimation model, the test effort is derived from a set of parameters obtained from the Use Case Diagrams. After estimating total weight of the system from Use Case Diagrams, adjustments will be applied taking into account the influences of technical and environmental maturity indicators relevant to software testing. This will tailor the estimation according to the organization conducting software testing. Lists of technical and environmental factors relevant to testing are provided in papers [6], [8], [10], [12]. It has been observed that [9] some indicators overlap and others have negligible effect on the test estimation. Factor Analysis is required to reduce the number of indicators considering only the impactful ones. Determination of indicators and their degree of influence could be done by a selected group of experienced and knowledgeable test experts. Delphi techniques [4] could be used to get agreement on the indicators. In order to get the Test Effort in Man-hours, organization dependant Productivity Factor of the test team will be multiplied. Adequately collected historical data from past similar projects should be used to get the productivity factor. Our estimation model with Use Case Diagrams as input is represented by below equations. As per equation (1), the Use Case Weight is expressed as a function of number of scenarios / transactions and number of Actors interacting with Use Case. As per equation (2), the Actor Weight is expressed as a function of the communication type and number of Use Cases the Actor is interacting with. The test effort is calculated as per equation (3).
UseCaseweight fucw # Sc _ Transnormal , # Sc _ Transtionexcep, # Int _ Actors
(1)
Where # Sc _ Transnormal and # Sc _ Transtionexcep are the numbers of transactions in normal and exceptional scenarios present in the Use Case, # Int _ actors is the numbers Actors interacting with the Use Case.
Actorweight facw Comm _ Type, # Int _ usecases
(2)
Where Comm _ Type is the mode of communication between the Actor and the Use Case (Examples of communication type: GUI, API, Protocol-Driven Interface or Data Store), # Int _ usecases is the numbers Use Cases the Actor is interacting with.
Early Test Effort Prediction using UML Diagrams (Pulak Sahoo)
225
ISSN: 2502-4752
Test_ Effortfrom _ ucds (ucd 1 UseCasewt ucd 1 Actorwt ) TEItest Prodtest (3) ucdn
ucdn
Where Test_ Effortfrom _ ucds is the test effort estimated from Use Case Diagrams ucd 1 to ucdn representing the system,
UseCase and Actor ucdn
ucd 1
ucdn
wt
ucd 1
wt
are the sum of Use Case
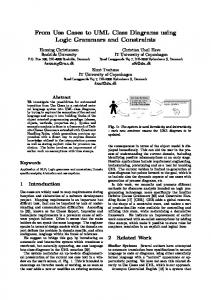
and Actor Weights giving the total weight, TEItest is the technical and environmental maturity factor for testing specific to the organization, Prodtest is the average productivity of the test team. 3.2. Effort estimation for System Testing using Class Diagrams UML Class Diagrams developed during design phase, show the structural view of the system consisting of classes and various types of relationships between them. Hence, the prediction of test effort based on Class Diagrams will be done in design stage. Figure 2 shows an example Class Diagram [15] for ‘Hospital Management’ system.
Figure 2. Hospital Management – Class Diagram
3.2.1. Complexity of Classes with Respect to Testing In order to estimate test effort from Class Diagrams [17], all the classes present in the diagrams need to be identified first. In the next step, classes will be categorized based on their complexity levels. The categorization of Classes for test effort estimation is different from that for development effort estimation. Complexity level of a class is determined based on the information associated with it in the Class Diagram. Information associated with a class is divided into two types: 1. Information encapsulated inside the class 2. Information related to its relationship with other classes. Information encapsulated inside the class consists of number of attributes and number of methods present in the class. Information related to its relationship with other classes consists of number of services required from other classes. For improved accuracy, we will use four categories (Simple, Medium, Complex and Very Complex) to classify classes based on their complexity weights. In the proposed estimation model, the test effort is derived from a set of parameters obtained from the Class Diagrams. After estimating total IJEECS Vol. 5, No. 1, January 2017 : 220 – 228
IJEECS
ISSN: 2502-4752
226
weight of the system from Class Diagrams, adjustments will be applied to the resulted value taking into account the influences of technical and environmental maturity indicators relevant to testing. The remaining steps are similar to those used in Use Case effort estimation section. Our estimation model with Class Diagrams as input is represented by below equations: As per equation (4), the Class Weight is expressed as a function of number of attributes, number of functions and number of services required from other classes. The test effort is calculated as per equation (5).
Classweight fcw # Attributes, # Methods, # Services _ Required
(4)
Where # Attributes and # Methods are number of attributes and methods encapsulated inside the class, # Services _ Required is the number of services required from classes interacting with this class.
Test_ Effortfrom _ cds cd 1 Classwt TEItest Prodtest cdm
(5)
Where Test_ Effortfrom _ cds is the test effort estimated from Class Diagrams cd 1 to cdm for the system,
Class cdm cd 1
wt
is the sum of Class Weights giving the total weight,
TEItest and
Prodtest are same as explained in equation (3). These UML [18-20] based test effort estimation models provide the managers a better understanding of the system’s testing complexity. The test efforts calculated initially from Use Case Diagrams can be compared with the refined estimates obtained from Class Diagrams.
4. Proposed Implementation Approach The architecture of the proposed UML Test effort estimator is provided in Figure 3. The steps for proposed implementation of the estimator are:
Figure 3. UML Test Effort Estimator Early Test Effort Prediction using UML Diagrams (Pulak Sahoo)
227
ISSN: 2502-4752 Table 1. Implementation Steps Step# 1 2
3
4
5
6
Step Description UCDs and CDs are created with sufficient details using CASE Tool. These diagrams are exported to machine-readable formats. The ‘Use Case diagram Parser’ extracts Use Cases, Actors and associations from the Use Case Diagram exports. The ‘Class diagram Parser’ extracts classes, attributes, methods and relationships from Class Diagram exports. The ‘UCD classifier’ categorizes the Use Cases and Actors based on defined classification setup for UCDs. The ‘CD classifier’ categorizes the classes based on defined classification setup.The classification setups reside in database. GUI is provided for creating and maintaining the classification setup. The ‘Unadjusted UCD Test effort estimators’ and ‘Unadjusted CD Test effort estimators’ calculate Unadjusted Test Effort for UCD and CDs respectively. The Technical and Environmental maturity factors are setup in the database. These factors are used for calculating TEItest value described in equation 3. GUI is provided for creating and maintaining the factors and their influences. In final step, the Adjusted Test efforts are calculated by multiplying the Unadjusted Test efforts (Productivity of test team).
with
TEItest and Prodtest
5. Conclusion This paper proposed models for prediction of test effort based on UML Use Case and Class Diagrams in requirement and design phases of SDLC respectively. The purpose is to enable managers to plan ahead for the testing phase in terms resource and schedule, so that quality software product is realized within the stipulated timeline. Some of the existing estimation models like FPA, TPA, EP, UCP, CP and UML Point discussed in the literature are used to estimate effort for the development as well as testing of the software products. The issues with above mentioned models are labour-intensive collection of input metrics, overdependence on expert decision and historical data, inaccuracies, processing complexity and lack of early estimation. Hence, there is a necessity to develop a simple approach for early test effort estimation while maintaining reasonable accuracy. In this work, we proposed an approach that is simple and will be able to provide test effort estimation at early stages of SDLC. Our estimation model can be expanded later to produce more refined estimates with inputs as remaining UML diagrams like Sequence, Activity and State Chart diagrams.
References [1]
Albrecht A. Measuring application development productivity. Proceedings of the joint SHARE/GUIDE/IBM application development symposium. 1979: 83–92. [2] Capers Jones. Applied software measurement. McGraw-Hill. 1996 [3] Van Veenendaal EPWM, Dekkers Ton. Test point analysis: a method for test estimation. 1999. [4] Aranha Eduardo, Paulo Borba. An estimation model for test execution effort. IEEE First International Symposium on Empirical Software Engineering and Measurement (ESEM 2007). 2007: 107-116. [5] Karner G. Metrics for Objectory. Diploma Thesis, University of Linköping, Sweden. 1993. [6] Nageswaran Suresh. Test effort estimation using use case points. Quality Week. 2001: 1-6. [7] Schneider Geri, Winters Jason P. Applying use cases: a practical guide. Pearson Education. 2001. [8] de Almeida Érika Regina Campos, Bruno Teixeira de Abreu, Regina Moraes. An alternative approach to test effort estimation based on use cases. IEEE International Conference on Software Testing Verification and Validatio. 2009: 279-288. [9] Ochodek Miroslaw, Nawrocki J, Kwarciak K. Simplifying effort estimation based on Use Case Points. Elsevier Information and Software Technology. 2011; 53(3): 200-213. [10] Zhu Xiaochun, Zhou B, Wang F, Qu Yi, Chen Lu. Estimate test execution effort at an early stage: An empirical study. IEEE International Conference on Cyberworlds. 2008: 195-200. [11] Costagliola Gennaro, Ferrucci Filomena, Tortora Genoveffa, Vitiello Giuliana. Class point: an approach for the size estimation of object-oriented systems. IEEE Transactions on Software Engineering. 2005; 31(1): 52-74. [12] SangEun Kim, Lively William M, Simmons Dick B. An Effort Estimation by UML Points in Early Stage of Software Development. Software Engineering Research and Practice. 2006: 415-421.
IJEECS Vol. 5, No. 1, January 2017 : 220 – 228
IJEECS
ISSN: 2502-4752
228
[13] Sarma, Monalisa, Rajib Mall. Automatic test case generation from UML models. IEEE 10th International Conference on. Information Technology (ICIT 2007). 2007: 196-201. [14] Qiuying Li, Lei Luo. Determining the Minimal Software Reliability Test Effort by Stratified Sampling. Indonesian Journal of Electrical Engineering and Computer Science. 2013; 11(8): 4399-4406. [15] http://www.programsformca.com/ [16] Hussain Altaf, Nadeem Aamer, Ikram Muhammad Touseef. Review on formalizing use cases and scenarios: Scenario based testing. IEEE International Conference on Emerging Technologies (ICET). 2015: 1-6. [17] Satapathy Shashank. Mouli, Kumar Mukesh, Rath Santanu Kumar. Class Point Approach for Software Effort Estimation using Soft Computing Techniques. IEEE International Conference on Advances in Computing, Communications and Informatics (ICACCI). 2013: 178-183. [18] Jorgensen Paul C. Software testing: a craftsman's approach. CRC press. 2016. [19] Hui Huang, Dongyue Yin. UML-based Requirements Analysis on Risk Pre-control System in Coal Enterprise. Indonesian Journal of Electrical Engineering and Computer Science. 2013; 11(7): 40124019. [20] Zhiyong Zhang, Jie Liu, Xinhui Zhang. UML modeling for dynamic logistics system based on DEVS. Indonesian Journal of Electrical Engineering and Computer Science. 2013; 11(4): 2168-2173.
Early Test Effort Prediction using UML Diagrams (Pulak Sahoo)