ECODE: Event-Based Community Detection from Social Networks Xiao-Li Li 1, Aloysius Tan1, Philip S. Yu2, See-Kiong Ng1 1
Institute for Infocomm Research, 1 Fusionopolis Way #21-01 Connexis Singapore 138632 2 Department of Computer Science, University of Illinois at Chicago, IL 60607-7053 {xlli,skng}@i2r.a-star.edu.sg,
[email protected],
[email protected]
Abstract. People regularly attend various social events to interact with other community members. For example, researchers attend conferences to present their work and to network with other researchers. In this paper, we propose an Event-based COmmunity DEtection algorithm ECODE to mine the underlying community substructures of social networks from event information. Unlike conventional approaches, ECODE makes use of content similarity-based virtual links which are found to be more useful for community detection than the physical links. By performing partial computation between an event and its candidate relevant set instead of computing pair-wise similarities between all the events, ECODE is able to achieve significant computational speedup. Extensive experimental results and comparisons with other existing methods showed that our ECODE algorithm is both efficient and effective in detecting communities from social networks. Keywords: social network mining, community detection, virtual links
1
Introduction
In recent years, many real world networks, such as worldwide web [1], social networks [2] [3], biological networks [4] [5] [6] [7] [8] [9], citation networks [10], communication networks [11] etc, have become available for data mining. A key task of mining these networks is to unravel the underlying community substructures. Community detection can reveal important functional information about the realworld networks. For example, communities in the biological networks usually correspond to functional modules or biological pathways that are useful for understanding the causes of various diseases [7]. In the social networks, knowledge about the underlying community substructures can be used for searching for potential collaborators, devising strategies to optimize the social relationships, identifying key persons in the various communities, etc. Qualitatively, detecting communities from networks involves dividing the vertices into groups such that there is a higher density of links within groups than between them [12] [13]. Numerous algorithms have been proposed to detect communities from various networks in recent years. However, detecting community substructures from large scale networks is still a challenging issue [12]. First of all, these algorithms are
not very efficient as they either compute pair-wise similarities between all the entities or cliques (agglomerative methods), or iteratively calculate the cutting edges (divisive methods) based on the values of some measures, e.g. betweenness scores. Secondly, it is common in practice that the social entities only interact with a limited subset of community members. As such, there exist communities which do not have very dense connections among all its members. This will make existing algorithms, most of which are density-based, suffer. We observe that people regularly attend various social events to interact with other community members. Many communities are formed and strengthened during such events as the members are able to effectively interact en masse in addition to traditional one-on-one interactions with one another. For example, in the academic domain, researchers often attend conferences, seminars and workshops to network with other community members whom they may not yet have direct working relationships with, but who have common research background and interests with them. In such events, old links are strengthened while new links are formed as the community members present their work, talk about the possible technical solutions for specific problems, provide feedbacks and suggestions to their peers’ work, discuss the possibility of future research direction and the collaboration topics, etc, during the formal programs as well as the informal tea breaks, lunches, and dinners. Similarly, in business domain, professionals also often attend business meetings and trade exhibitions to find potential collaborators, discuss with their business plans, exchange ideas on the issues regarding the economic situation, and find commercial opportunities in current and/or emerging markets. Event information can thus be quite useful for inferring communities from social networks. In this paper, we have proposed a novel ECODE algorithm which detects community substructures from events. ECODE stands for Event-based COmmunity Detection. In ECODE, similar events are merged using hierarchical clustering to form bigger communities. We summarize the main contributions in this paper as follows: For the first time, the event-based community detection problem is formally defined. This will facilitate the use of event data for better detection of community substructures in social networks. Our proposed ECODE algorithm uses events instead of single persons or cliques as the basic unit to perform hierarchical clustering efficiently. In fact, ECODE only computes the similarity scores from a part of the selected potentially similar events, which further speeds up our algorithm. A novel idea termed as virtual links has been proposed to enhance the connectivity among members within same communities. The virtual links, which are contentbased associations, can be used to enrich the potentially sparse connections amongst the community members, resulting in effective community detection. Experimental results showed that our method that can effectively address the challenging problems in the community detection, namely, the issues of low efficiency and low connectivity within community. ECODE not only significantly outperformed the existing state-of-the-art community detection methods, but it also detects the hierarchical substructures of communities in the social networks, which can provide more insights on community formations. Our algorithm also allows the communities discovered to have overlapping structures.
2
Related Work
Detecting communities or modules from networks has attracted considerable attention in recent years [14]. The current research on community detection can be divided into two main thrusts, namely, agglomerative methods and divisive methods [13] [15]. Agglomerative methods adopt bottom-up strategies to build a tree where the leaves can be either a single node or dense graphs [16] [12] [17] [18] [4] [19] [20]. The agglomerative methods proposed in [12], [16], [17] and [18] evaluate the pair-wise similarities or closeness s(i, j) for every pair of nodes i and j in the network. Starting from individual nodes as initial groups, the process involves iteratively merging the two most similar groups into larger and larger communities. A tree which represents the whole network is built from the bottom up to the root. In comparison, the agglomerative methods proposed in [4], [19] and [20] detect dense graphs, such as the maximal cliques [4] [19] and k-core [20], as the initial leaves. They then repeatedly join together the two most similar dense graphs to larger communities. Divisive methods, on the other hand, construct a tree in the reversed order [21] [22] [23] [15] [24] [25]. They start from the root, which represents the whole network, and divide the network progressively into smaller and smaller disconnected sub-networks which can correspond to the communities. The fundamental idea of the divisive methods is to select links that are inter-cluster links and not intra-cluster links to be cut. A well-known divisive algorithm has been proposed by Girvan and Newman [26]. The algorithm selects the links to be cut based on the values of the “edge betweenness” ― a link’s betweenness score is defined as the number of shortest paths between all pairs of nodes in the network that pass along it. Links with large betweenness score are thus “bridge”-like edges (or inter-cluster links) linking densely connected clusters, since many shortest paths between the different clusters will have to pass through these edges. Spectral graph partitioning methods have also been employed to detect the groups by identifying an approximately minimal set of links from the given graph [27] [28]. The block modeling method can be considered as a classical Social Network Analysis (SNA) method for this problem [29]. Many interesting problems have been explored recently by taking time factors into consideration. The work in [30] investigated communities that grow rapidly and explored how the overlaps between pairs of communities change over time. The work in [31] showed to discover what the “normal” growth patterns in social, technological and information networks are. A tractable model for information diffusion in social networks was proposed in [32], while the work in [33] studied how communities evolve over time in dynamic multi-mode networks.
3
The Proposed Technique
In this section, we present our proposed ECODE algorithm. In Subsection 3.1, we provide the problem definition of event-based community detection. Then, in Subsection 3.2, we introduce a content-based virtual link method. Next, in Subsection 3.3, we describe three different similarity measures. We present our ECODE algorithm in Subsection 3.4. Finally, we assign people to corresponding communities.
3.1
Problem Definition
Let event set E = { φi | φi is a event, i = 1, 2, …, n}. Each event φi can be represented as a graph φi ={Vi, Ei} where Vi ={vj | vj is an individual entity who attended the event φi}, Ei ={(vj,vk) | vj and vk are two individual entities who have certain relationships, vj, vk ∈ Vi}. Each link (vj,vk) in Ei could be vj and vk work together (physical links).
2
1
3
4 Physical links
5
H
7
6 Virtual links
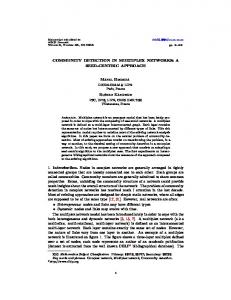
Fig. 1. Illustration of community detection
Given an event set E, our objective is to detect those communities {C1, C2, …, Cp} where each individual community Ci (i=1, 2, …, p) has much more intra-links (links within Ci) but relatively less inter-links cross different communities (links between Ci and Cj, j = 1, 2, …, p, i ≠ j) (link perspective). In addition, there should be relatively small number of vertices that participate in two communities Ci and Cj (i ≠ j). Fig. 1 illustrates an event community detection problem where the nodes are individual entities (represented by colored circles) and there are two different types of links, i.e. physical links (represented by solid lines) and virtual links (represented by dotted lines). Virtual links connect a pair of entities from different events who do not have direct interactions but work on some similar topics. Fig. 1 depicts 7 events 1, …, 7 (circled), and 2 main communities existing separated by H (community 1: 1, 2, 3, 4 and community 2: 5, 6, 7). Note that some people attend multiple events and they are thus located in the intersections of these communities. If there are many common participants in two separate events (vertex overlapping), then these events are probably related and those people in the two events should belong to the same community. The virtual links enhance the connectivity across different events within the same community, which are useful to merge events to form bigger communities.
3.2
Virtual Links between Events
Given a vertex vi, we consider its associated content in various events di : for the researchers’ social networks, these could be vi’s research papers, presentation slides, project descriptions, curriculum vitae, etc to profile vi’s interests. For a pair of vertices vj and vk from different events (vj∈φj ={Vj, Ej}, vk∈ φk ={Vk, Ek}, j ≠ k), we evaluate
if there is a virtual link between vj and vk by computing whether their content similarity consim(vj,vk) is big enough, i.e. consim(vj,vk)>δ, where δ is a threshold which can be computed by averaging the similarities among the non-connected entities within randomly selected events R E , i.e.
1 | | R
i R
consim ( v , v ) ,v ,v | | j
(1)
k
j
k
i
i
where (vj,vk) is a pair of non-connected entities in event φi , |φi | is the number of all the non-physical link pairs in φi, and φR is the event set selected from event set E. The content similarity vj and vk , consim(vj , vk) in equation (1) can be defined as consim (v j , v k )
(2)
1 | f (v j ) f (v k ) | K con | f (v j ) | * | f (v k ) |
In equation (2), f(vj) represents the feature set of vertex vj after eliminating the stop words; Kcon is a normalization constant and K con max (consim (va , vb )) . consim(vj , vk) a ,b
(ranged from 0 to 1) will be bigger if two vertices shared a lot of common features. While the people within same community have a higher chance to interact with each other, each individual entity typically still only interacts with a limited number of his or her community members. In community detection, it is thus quite important to enrich the social network by linking those entities with common interests together. Here, we propose virtual links to connect those people from different events whose content similarity is equal to or higher than the average feature similarity between people within randomly selected events. 3.3
Similarity Measures
Communities can consist of the people from different events. It is thus necessary to combine the smaller events together to form those bigger communities. We evaluate the similarities between events by the following three different similarity measures. Given two graphs φi ={Vi, Ei} and φj ={Vj, Ej}, the vertex similarity between two events φi and φj is defined as Vex _ sim ( i , j )
| Vi V j | | Vi V j |
(3)
/ K vex
where KVex is a normalization constant and KVex max(Vex _ sim( a ,b )) . According a ,b
to equation (3), if two events share a high proportion of members, then they are considered to be events for the same community. The physical similarity between two events φi and φj is defined as PL _ sim(i , j )
| {(vi , v j ) | (vi , v j ) k , k i, k j, vi Vi \ V j , v j V j \ Vi } | | Vi \ V j | * | V j \ Vi |
/ K PL
(4)
where KPL is a normalization constant and K max( PL _ sim( , )) . Equation (4) PL i j a ,b
basically evaluates how closely the members from different events interact with each
other. If there are a lot of physical inter-links (involved in different events, such as φk) between the members from two events φi and φj, then the events are highly likely to be events for the same community. In the same way, we define the virtual link similarity between two events φi and φj: VL _ sim(i , j )
| {(vi , v j ) | vi i , v j j , consim(vi , v j ) , vi Vi \ V j , v j V j \ Vi } | | Vi \ V j | * | V j \ Vi |
/ KVL
(5)
where KVL is a normalization constant and K max(VL _ sim( , )) . Note that the VL i j a ,b
virtual link similarity in Equation 5 is similar to the physical link similarity in Equation 4 – the only difference is that we use the virtual links replace the physical inter-links between the members from the two events. It may appear that the virtual links are not very useful as the virtual links between entities not involving in the same events merely indicate that the individuals are doing something similar but they do not have any physical interactions. However, we will show that the virtual links are actually more useful for community detection than the physical interaction links. 3.4 ECODE Algorithm We adopt an agglomerative clustering approach for our community detection algorithm ECODE (Fig. 2). The objective is to detect similar events in terms of overlapping vertices and virtual links, and then merging them to form bigger communities. The algorithm terminates when the quality of the detected communities in the merging process have become maximal. In Fig. 2, ECODE algorithm starts with the members from each event forming an initial community. Although we could employ standard hierarchical clustering, the need to compute pair-wise similarities between all initial leaf nodes is too time-consuming for large networks. To improve the efficiency of our technique, in Step 2 of our algorithm, we only select those event pairs which are potentially similar to compute their similarities. 1. For each event φi ={Vi, Ei} (i = 1, 2, …… , n), φi ∈ E 2. Find its candidate relevant set Eφi where the members from φi also frequently participated in the each event in Eφi 3. Compute the similarities between φi and each event φip in Eφi 4. While (quality of current-level of tree increases) 5. Find the most similar events φi and φj and merge them into a new event φnew 6. Construct a candidate set Eφnew for φnew from its children’s candidate sets Eφi and Eφj 7. Compute the similarities between the new event φnew and each event in Eφnew 8. Compute the quality of current level of the tree Fig. 2. ECODE algorithm for community mining
Given an event φi, we want to find its candidate relevant set Eφi, which consists of potential similar events that φi’s entities/members have also participated in. To do this, we first construct event transaction set Tφi where each record includes an entity and the various events that he/she is involved in. We want to detect candidate relevant event set Eφi for event φi where those events in Eφi have high support in Tφi, i.e.
Eφi ={φj| supportTφi(φi , φj)>α, φi , φj ∈ E, j ≠ i}
(6)
where α is a parameter to control the size of candidate relevant set Tφi. The problem to find high support associated events can be modeled as mining frequent item sets problem ― there exist many efficient algorithms for this problem in the data mining domain [34]. We are thus able to compute Eφi rapidly. For each event φi and its candidate relevant set Eφi, Step 3 computes the similarities sim(φi , φj) between φi and each event φip in Eφi which is defined as the linear combination of vertex similarity Vex_sim (φi , φip) and virtual link similarity VL_sim (φi , φip): b
sim(φi , φip) = * Vex_sim (φi , φip) + (1- )* VL_sim (φi , φip),
(7)
where (0≤ ≤1) is a parameter to adjust the weighs for the importance of vertex similarity and virtual link similarity. If =1 ( =0), then we only consider the vertex similarity (virtual similarity). In our experiments, we will test ’s sensitivity. Note that according to Equation (5), obtaining VL_sim (φi , φj) will incur significant computational costs because of the computation of feature similarities between all the pair-wise events φi and φj. In order to speed up its computation, we adopt a sampling strategy which randomly selects some entities, i.e. φip and φjp from φi and φj respectively and reduce VL_sim (φi , φj) to a manageable VL_sim (φip , φjp). Steps 4 to 8 perform the hierarchical clustering process. In Step 5, the most similar events φi and φj are merged together into a new event φnew. We then construct candidate relevant set Eφnew for φnew (merge Eφi and Eφj to get the events whose support is larger than α) and compute the similarities between φnew and each event φk in Eφnew based on their children’s similarities, i.e. sim(φnew , φk) = sim(φi , φk) +sim(φj , φk)
(8)
Finally, we compute the quality of the current level of the tree. Note that our hierarchical clustering may not necessarily result in a tree since we are not building one big community – we will stop the merging process if the current merging step does not improve the quality of the current level of tree. Newman has proposed a quality function Q (modularity) to evaluate the goodness of a partition [15]: Q
(e
ii
(9)
2
ai )
i
where
eii is the number of edges in the same group/community connecting the
vertices (intralinks) and ai ² is the sum of edges from the vertices in group i to another group j (interlinks). Since we have observed that there are many interactions across different communities, instead of using the physical links, we use the content/feature-based approach. We represent each event using a TFIDF representation, and then use cosine similarity to compute the intra-similarities and inter-similarities. The quality equation in (9) can be rewritten into Equation (10), Q
( cos sim (i , i ) cos sim (i , j ) i
j
2
)
(10)
Basically, using Equation 10 favors a community substructure which has in overall bigger intra-similarity and less inter-similarity in terms of their topics and content. Our ECODE algorithm stops at a level of tree with the maximal Q value. 3.5 Assign People to Corresponding Communities We note that each entity may occur in multiple communities. For each entity, we discover the core communities in which the entity is highly involved in. If ai is a member of community set C={C1, C2, …, Cp}, we compute the community attachment scores of ai to Cj (j=1, 2, …, p) as follows s(a ,C ) i
j
a k C k i
int ( a , a ) int ( a ) i
j
k
(11)
i
where int(ai, ak) is the number of links between ai and other members in community Cj and int(ai) is the total number of links of ai, i.e. ai’s degree. If ai is not a member of Cj but it can be connected to Cj through intermediate connectors (indirect neighbors), its community attachment scores can be computed as s (ai , C j )
a k C m , a l C m j
j
int ( a i , a k ) int ( a k , a l ) * int ( a i ) int ( a k )
(12)
Note if s ( a , C ) p s ( a , C ) / p , then Ck will be regarded as ai’s core community. i i i k i 1
4 Experimental Results We evaluate the proposed ECODE algorithm by using it to mine communities from a large researcher social network built by using bibliography data. The datasets that we have used for our experiment are publication data from the Digital Bibliography and Library Project (DBLP). The DBLP database provides bibliography information on major computer science journals and conferences (http://www.informatik.unitrier.de/~ley/db/). DBLP currently lists more than one million articles; each article record contains the author names, paper title, conference or journal name, and year of publication, as well as other bibliographic information. For our work, we used only the information on the author names, paper titles and conference names. In our experiments, each conference will be regarded as one event. We have selected 6 domains in computer science, namely database, data mining, machine learning, multimedia, bioinformatics, and natural language processing, which represent different communities in computer science. For each community, 3 events (in this case, top conferences) were selected and a total of 28,998 papers (from 1970 to 2008) were retrieved from DBLP, including 31,122 authors/entities and 127,238 links (physical links between every two co-authors). The link density of the network is quite small, which is equal to 127238/(31122*31121/2)= 0.00026274, indicating that each researcher will only interact with a very limited subset of community members which results the low connectivity issue in the network.
Table 1. Communities, events and community core members Domain/Communities Database (DB) Data Mining (DM) Machine Learning (ML) Multimedia (MM) Bioinformatics (BI) Natural Language Processing (NLP)
Events SIGMOD, VLDB, ICDE KDD, ICDM, SDM ICML, NIPS, ECML CVPR, ICCV, ACM MM RECOMB, ISMB, CSB ACL, COLING, EACL
#PC members 557 738 1,007 802 951 187
Table 1 summarizes the communities and the corresponding events (column 1 and 2). To evaluate the quality of the detected communities, we also manually construct gold standard community data sets consisting of community core members, namely, the technical program committee (PC) members, for each event (note that there is no existing gold standard for evaluating the communities in social networks). The third column lists the number of PC members for these top conferences from 2000 to 2007. Next, we describe the experimental setting. In our ECODE algorithm, for each event, we will find its “candidate relevant set” which consists of its potential similar events where α is used to control the size of candidate relevant set (Equation 6). In our experiments, α is set as 4, but we have also tested the sensitivity how α affects our algorithm later on (Fig. 4). In order to compute the virtual links between two events, we randomly selected 10 events/conferences and compute the average similarity of non-connected community members as the virtual link threshold δ (Equation 1). In addition, in order to speed up the computation, we randomly selected 100 members in each event to compute the virtual links between them. We also tested how the number of members affects the performance of our technique (Fig. 5). For Equations 2 and 10, we only used the paper titles as the associated documents since they are readily available. In ECODE algorithm, we combined the vertex similarity and virtual link similarity (equation 7) where is used to weight the two similarities. In our experiments, is fixed as 0.9, and we also test ’s sensitivity in Fig. 6. Note all our experiments were run with a standard Intel Core 2 2.40 GHz desktop with 2GB RAM. Let us now present the experimental results. Table 2 lists the results using two recently published techniques CONGO [24], EAGLE [19] (they have performed better than state-of-the-art techniques), as well as our proposed techniques with different similarity measures, such as vertex similarity (ECODE_Vex), physical links (ECODE_PL), virtual links (ECODE_VL), combined vertex and virtual links (ECODE). The table lists the performance of various techniques in terms of Recall_BM, which is obtained by computing the best match of discovered communities to gold standard communities with one to one mapping. To do so, we find all the similarity scores (Equation 3 was used to compute the scores) between the discovered communities and the gold standard communities. Then, we find the first best match pair with the biggest similarity score to match a discovered community with a gold standard community. We continue this process for the remaining gold standard communities until all the gold standard communities have found their best match discovered communities, or that no discovered community can be matched to the gold standard communities. Recall_BM is defined as the number of the members in gold standard communities retrieved by discovered communities divided by the total number of members in gold standard communities.
Table 2. Overall performances of various techniques Methods Performance
CONGO EAGLE ECODE_Vex 13.7% 27.6% 63.5%
ECODE_PL ECODE_VL ECODE 53.3% 64.1% 69.9%
Table 2 shows that ECODE produces the best results, achieving a Recall_BM score of 69.9%, which is 42.3%, and 56.2% higher than the Recall_BM of the two existing techniques CONGO and EAGLE respectively. Compared with only using physical link, virtual link, and vertex similarities, ECODE also generated better results, illustrating that integrating the vertex links and virtual links improves the effectiveness of detecting communities in the social networks. ISMB
SIGMOD VLDB
RECOMB CSB
ICDE
SDM ICDE CVPR ACM MM NIPS ECML ICDM VLDB SIGMOD KDD EACL ACL COLING
KDD ICDM
SDM ICML ECML
NIPS CVPR ICCV ACM MM RECOMB ISMB CSB ACL COLING
ICCV ICML
EACL
ECODE_PL
ECODE_Vex
SIGMOD VLDB
SIGMOD VLDB
ICDE KDD ICDM SDM ICML ECML CVPR
ICDE KDD ICDM SDM ICML ECML
NIPS
ICCV ACM MM NIPS
CVPR ICCV ACM MM
RECOMB ISMB CSB ACL COLING
RECOMB ISMB CSB ACL COLING
EACL
EACL
ECODE_VL
ECODE
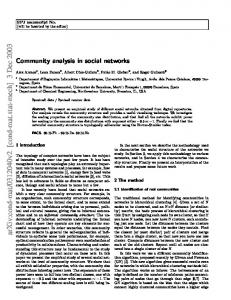
Fig. 3. Dendrograms of DCODE for communities using different similarity measures We further checked the four dendrograms of our ECODE algorithms with different similarity settings, which are shown in Fig. 3. We observe that the dendrogram of ECODE is much more meaningful than ECODE_PL, ECODE_Vex as well as ECODE_VL. From the results of ECODE_PL, we can see that it is almost like
random clustering. This is because researchers tend to have collaborations with those from different communities. As such, the physical links are rather misleading for forming community substructures. ECODE_Vex showed a more meaningful result; however, there are still some faults in the clustering process. For example, CVPR and ICCV (multimedia conferences) were grouped with data mining and machine learning communities first before being grouped with ACM MM although ACM MM, CVPR and ICCV are multimedia-related conferences. As for ECODE_VL, while their results are better than ECODE_PL in terms of its dendrogram, conferences belonging to the same community such as ICML, ECML and NIPS (machine learning conferences) are not grouped together. NIPS was grouped with ICML and ECML after both have been clustered to the database, data mining, and multimedia community. In comparison, by weighting and combining different similarity measures (vertex and virtual links), ECODE algorithm was able to categorize the right conferences to the right communities. Our ECODE algorithm discovered 8 communities where all the merging steps are correct. This shows that ECODE’s integrating of the virtual links and vertex overlapping was effectively used to detect the community substructures. In addition, our clustering cut-off (Equation 10)—the dotted line in Fig. 3—is also very accurate, showing that ECODE was able to early-stop the hierarchical clustering and detect meaningful communities. 0.8
10 9 8
0.6
Time (Hours)
Performance
0.7
0.5 0.4
7 6 5 4 3 2
0.3
1 0.2 2
3
4
5
6
7
The size of candidate relevant set
8
0 2
3
4
5
6
7
8
The size of candidate relevant set
Fig. 4. Performance of ECODE with different size of candidate relevant set
Fig. 4 shows the performance of ECODE with different sizes of candidate relevant set, from 2 to 8 with Step 1. The performance of ECODE increases as the size of candidate relevant size increases from 2, 3 to 4, but it does not change after that. The plot on the right portion of Fig. 4 shows the actual running time against the size of candidate relevant set. As expected, more computations were needed when the size of candidate relevant set increases. However, by considering both performance and running time plots together, Fig. 4 indicates that after the size of the candidate relevant set has increased to a certain degree — in this case, 4 — more computation is no longer useful for community detection as it only increases the computational time without increasing the performance. It also shows that our candidate relevant set has effectively captured the more related events so that it can save a large amount of computational time, as compared with computing all the pair-wise similarities which is typically used for hierarchical clustering. Recall that we also selected a subset of authors to compute the virtual links among two events in order to improve the efficiency of our algorithm. To study the
sensitivity of the number of authors selected, we performed a series of experiments using different numbers of authors, from 50 to 200 with a step of 50. The results are shown in Fig. 5. While the results of using 100, 150 and 200 authors are better than using only 50, there are no significant improvements. This means that our ECODE algorithm with small number of authors can perform reasonably well even when we select only 50 or 100 authors from each event. On the other hand, in terms of efficiency, our algorithm will perform much fast when we use less authors for computing virtual links, as shown in the right part of Fig. 5. 1
16
0.9
14
0.8 12
Time (Hours)
Performance
0.7 0.6 0.5 0.4 0.3
10 8 6 4
0.2
2
0.1 0
0
50
100
150
Number of Authors Selected
200
50
100
150
200
Number of Authors Selected
Fig. 5. Performance of ECODE with different number of selected authors
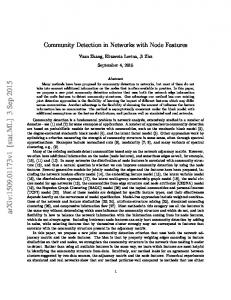
In equation 7, we have used to weight the importance of vertex 0.75 similarity and virtual link similarity. Fig. 6 shows how the values of affect 0.7 the performance of ECODE algorithm. 0.65 In Fig. 6, when increases, the performance of ECODE also increases 0.6 until reaches 0.9. Fig. 6 shows that 0.55 combining the vertex similarity and virtual link similarity can get 0.5 0 0.1 0.2 0.3 0.4 0.5 0.6 0.7 0.8 0.9 1 consistent better results when ∈[0.5,0.9] than using vertex similarity Fig. 6. The performance of ECODE with and virtual link similarity individually. Finally, in Fig. 7, we show the 20 top representative researchers with the most publications in our discovered communities. We observe that these top researchers are typically shared by two or more communities (e.g. Tao Jiang is shared by four, i.e. bioinformatics, database, data mining and machine learning). In fact, all the data mining researchers are shared by two or more communities (no single data mining circle in Fig. 7), indicating that data mining is highly related to other domains, and data mining researchers are always doing applications or research in other domains. Note that out of the total 3,488 PC members in Table 1, there were about a third of them (1,118) who were not assigned any community because these community (PC) members did not have any publications in the conferences listed. We have searched all their publications in DBLP (they published in other related conferences anyway). By incorporating their publication data into current publication data sets, we were Performance
0.8
able to assign 782 of them to one or more correct communities through indirect neighbors with an accuracy of 77.75% (using Equation 12). After assigning all these authors to their respective communities, the Recall_BM score for ECODE algorithm has a significant further improvement from 69.9% to 87.1%, as shown in Table 3. As such, the Equation 12 (assigning entities to community based on connectivity information) can be useful to effectively infer the underlying community belongings.
Fig. 7. The top researchers in our discovered communities
Table 3. Performance before and after assigning unpublished authors for various communities Communities Bioinformatics (BI) Database (DB) Data Mining (DM) Multimedia (MM) Machine Learning (ML) Natural Language Processing (NLP) Average
Before assigning unpublished authors 49.7% 87.1% 59.4% 62.6% 70.5% 89.8% 69.9%
After assigning unpublished authors 77.6% 97.3% 80.1% 85.9% 87.5% 94.1% 87.1%
5 Conclusions Communities are often formed and strengthened during various social events attended by individuals to interact with other members of the community. Event information can thus be quite useful for inferring communities from social networks. In this paper, we have therefore proposed an Event-based COmmunity DEtection algorithm ECODE to mine the underlying community substructures of social networks from event information. Unlike conventional approaches, ECODE makes use of content similarity-based virtual links in the social networks. The virtual links are found to be more useful for community detection than the physical links. By performing computation between an event and its candidate relevant set instead of computing pair-wise similarities between all the events, ECODE was able to achieve significant computational speedup. We have performed extensive experimental results on the events and social network data of Computer Science researchers. Comparisons with other existing methods showed that our ECODE algorithm is both efficient and effective in detecting communities from social networks. We have so far focused on the social networks for our approach in this work. In our future work, we plan to generalize our current approach to mine other networks. For example, we aim to mine protein complexes from protein interaction networks where proteins are vertices and protein interactions between two proteins are the links [9]. Each protein in protein interaction networks will have various biological evidences (similar to content profiling data in social networks) such as sequences, protein domains, motifs, molecular functions, cellular components as well as other protein’s physico-chemical properties etc. In this scenario, virtual links will connect two proteins if they have overall bigger similarities in terms of sequence similarity, functional similarity, location similarity etc. We will leave this as our future work.
References 1. Albert, R., H. Jeong, and A.-L. Barabási, Diameter of the world-wide web. Nature, 1999. 401: p. 130-131. 2. Wasserman, S. and K. Faust, Social Network Analysis. 1994, Cambridge: Cambridge University Press. 3. Li, X.-L., et al., Searching for Rising Stars in Bibliography Networks, in DASFAA. 2009. 4. Palla, G., et al., Uncovering the overlapping community structure of complex networks in nature and society. Nature, 2005. 435: p. 814-818. 5. Li, X.-L., et al., Interaction Graph Mining for Protein Complexes Using Local Clique Merging. Genome Informatics, 2005. 16(2). 6. Li, X.-L., C.-S. Foo, and S.-K. Ng, Discovering Protein Complexes in Dense Reliable Neighborhoods of Protein Interaction Networks, in CSB. 2007. 7. Steinhaeuser, K. and N. Chawla, A Network-Based Approach to Understanding and Predicting Diseases. 2009: Springer Verlag. 8. Wu, M., et al., A Core-Attachment based Method to Detect Protein Complexes in PPI Networks. BMC Bioinformatics, 2009. 10(169). 9. Li, X.-L., et al., Computational approaches for detecting protein complexes from protein interaction networks: a survey. BMC Genomics 2010. 11(Suppl 1:S3 ).
10. Redner, S., How popular is your paper? An Empirical Study of the Citation Distribution. Eur. Phys. J., 1998. B(4): p. 131-138. 11. Nisheeth, S., M. Anirban, and R. Rastogi, Mining (Social) Network Graphs to Detect Random Link Attacks in ICDE. 2008. 12. Clauset, A., M.E.J. Newman, and C. Moore, Finding community structure in very large networks Phys. Rev. E 2004. 70 p. 066111. 13. Radicchi, F., et al., Defining and identifying communities in networks. PNAS, 2004. 101(9): p. 2658-2663. 14. Fortunato, S., Community detection in graphs. Physics Reports 2010. 486: p. 75-174. 15. Newman, M.E.J., Modularity and community structure in networks. PNAS, 2006. 103(23): p. 8577-8582. 16. Ravasz, E., et al., Hierarchical Organization of Modularity in Metabolic Networks. Science, 2002. 297: p. 1551–1555. 17. Clauset, A., Finding local community structure in networks. Phys. Rev. E 2005. 72. 18. Boccaletti, S., et al., Detection of Complex Networks Modularity by Dynamical Clustering. Physical Review E, 2007. 75. 19. Shen, H., et al., Detect overlapping and hierarchical community structure in networks CoRR abs/0810.3093, 2008. 20. Seidman, S.B., Network structure and minimum degree. Social Networks, 1983. 5: p. 269287. 21. Holme, P., M. Huss, and H. Jeong, Subnetwork hierarchies of biochemical pathways. Bioinformatics, 2003. 19(4): p. 532 - 538. 22. Gleiser, P. and L. Danon, Community structure in jazz. Advances in Complex Systems, 2003. 6: p. 565. 23. Tyler, J.R., D.M. Wilkinson, and B.A. Huberman, Email as Spectroscopy: Automated Discovery of Community Structure within Organizations. Communities and Technologies, 2003: p. 81-96. 24. Gregory, S., A Fast Algorithm to Find Overlapping Communities in Networks, in ECML/PKDD. 2007: Warsaw, Poland. 25. Bie, T.D. and N. Cristianini, Fast SDP relaxations of graph cut clustering, transduction, and other combinatorial problems. Journal of Machine Learning Research, 2006. 7: p. 1409-1436. 26. Girvan, M. and M.E.J. Newman, Community structure in social and biological networks. PNAS, 2002. 99(12): p. 7821-7826 27. Newman, M.E.J., Detecting community structure in networks. European Physical Journal B, 2004. 38: p. 321-330. 28. Ding, C., X. He, and H. Zha, A Spectral Method to Separate Disconnected and Nearlydisconnected Web Graph Components., in KDD. 2001. 29. Wasserman, S. and K. Faust, Social network analysis: methods and applications. 1994: Cambridge University Press. 30. Backstrom, L., et al. Group Formation in Large Social Networks: Membership, Growth, and Evolution. in Proceedings of the Twelfth ACM SIGKDD International Conference on Knowledge Discovery and Data Mining (KDD 2006). 2006. Philadelphia, USA. 31. Leskovec, J., J. Kleinberg, and C. Faloutsos. Graphs over Time: Densification Laws, Shrinking Diameters and Possible Explanations in ACM SIGKDD International Conference on Knowledge Discovery and Data Mining (KDD). 2005. 32. Kimura, M. and K. Saito. Tractable Models for Information Diffusion in Social Networks in ECML/PKDD. 2006. 33. Tang, L., et al., Community Evolution in Dynamic Multi-Mode Networks, in SIGKDD. 2008. 34. Agrawal, R., T. Imielinski, and A. Swami, Mining Association Rules Between Sets of Items in Large Databases, in SIGMOD Conference. 1993.