vol. 166, no. 3
the american naturalist
september 2005
E-Article
Ecological Specialization of Mixotrophic Plankton in a Mixed Water Column
Tineke A. Troost,* Bob W. Kooi,† and Sebastiaan A. L. M. Kooijman‡
Faculty of Earth and Life Sciences, Department of Theoretical Biology, Vrije Universiteit, De Boelelaan 1085, 1081 HV Amsterdam, The Netherlands Submitted December 8, 2004; Accepted April 26, 2005; Electronically published July 11, 2005
abstract: In recent years, the population dynamics of plankton in light- or nutrient-limited environments have been studied extensively. Their evolutionary dynamics, however, have received much less attention. Here, we used a modeling approach to study the evolutionary behavior of a population of plankton living in a mixed water column. Initially, the organisms are mixotrophic and thus have both autotrophic and heterotrophic abilities. Through evolution of their trophic preferences, however, they can specialize into separate autotrophs and heterotrophs. It was found that the light intensity gradient enables evolutionary branching and thus may result in the ecological specialization of the mixotrophs. By affecting the gradient, other environmental properties also acquire influence on this evolutionary process. Intermediate mixing intensities, large mixing depths, and high nutrient densities were found to facilitate evolutionary branching and thus specialization. Later results may explain why mixotrophs are often more dominant in oligotrophic systems while specialist strategies are associated with eutrophic systems. Keywords: mixotrophy, mixed water column, ecological specialization, evolutionary branching, mass balance formulation, light- and nutrient-limited environment.
We study the evolution of trophic preference of a population of mixotrophic plankton in a mixed water column by means of a modeling approach. Mixotrophs are capable of both auto- and heterotrophy, which means that they can use both organic and inorganic sources for the production of biomass. We enable the mixotrophs to specialize into pure auto- and heterotrophs by allowing their trophic * Corresponding author; e-mail:
[email protected]. †
E-mail:
[email protected].
‡
E-mail:
[email protected].
Am. Nat. 2005. Vol. 166, pp. E45–E61. 䉷 2005 by The University of Chicago. 0003-0147/2005/16603-40781$15.00. All rights reserved.
preferences to evolve. Nitrogen content, mixing intensity, and mixing depth are environmental properties that are typical to aquatic systems and are known to have a large impact on the ecological dynamics of plankton. Here, we study their effects on the evolution of trophic preferences and thus the ecological specialization of the mixotrophs. The focus is on mixotrophic organisms for two reasons. The first reason is that the phenomenon of mixotrophy is widespread. Eukaryotes acquired photoautotrophy via the uptake of chloroplasts (Margulis 1993); in most taxa, however, this did not result in the loss of heterotrophy. Hence, many typical photoautotrophs are able to use organic compounds as an energy, carbon, and/or nitrogen source (Zajic 1970), and basically they are mixotrophs. This seems to be the case especially in algae. Algae are not a natural group but a collection of unrelated taxa that each have fully heterotrophic close relatives; this applies to bluegreen bacteria, chlorophytes, rhodophytes, euglenophytes, dynozoans, chlorarachnids, cryptophytes, haptophytes, and heterokonts (see, e.g., Cavalier-Smith 1998). This suggests that, in addition to their well-known autotrophic abilities, many algae may also have some (unknown) heterotrophic abilities. Many other organisms—including plants, some animals, fungi, forams, and radiolarians— acquired phototrophy via symbiosis (Kooijman and Hengeveld 2005); these are again mixotrophs. Although the practical importance of either of the assimilatory routes in these organisms is often small or depends on environmental conditions, mixotrophy is thus much more common then is generally recognized. The second reason for studying mixotrophs is their autotrophic and heterotrophic abilities, which enable a complete recycling of matter and nutrients. Therefore, they form the simplest nondegenerate ecosystem possible. Such single-species mixotrophic communities share many characteristics with the canonical communities (Kooijman and Nisbet 2000; Kooijman et al. 2004), that is, a three-species system consisting of producers, consumers, and decomposers. We therefore believe that these very much simplified theoretical single-species ecosystems do capture some of the basic features of all ecosystems. From this, it also
E46 The American Naturalist Table 1: Symbols for transformations and compounds Index A AA AH M G C N V D
Transformation/compound Assimilation Autotrophic assimilation Heterotrophic assimilation Maintenance Growth DIC DIN Biomass Detritus
follows that specialization of mixotrophs into auto- and heterotrophs corresponds to the first steps in the evolution of the ecosystem to develop from a very simple to a more complex ecosystem. Studying this process may therefore provide insight in the evolution of food webs and ecosystems. In recent years, an extensive amount of research has been done on the effects of chemical and physical properties on plankton blooms and species composition. Obviously, nutrients and light play a large role; they affect the abundance and the species composition of phytoplankton communities through their ratio (Hall et al. 2004; Klausmeier et al. 2004) as well as through their absolute supply (Huisman and Weissing 1995). Physical properties, on the other hand, affect the availability of nutrients and light, and therefore they can have a great impact on the dynamics and species composition as well (Huisman and Weissing 1995). The vertical turbulent diffusion coefficient and the mixing depth were found to define critical conditions for phytoplankton blooms (Huisman et al. 1999a, 2002; Ebert et al. 2001; Huisman and Sommeijer 2002). Diehl (2002) explains how the primary causes of biomass limitation shift with increasing mixing depth. Yet other factors were found to determine the species composition, such as fluctuations in light intensity (Litchman 1998; Litchman and Klausmeier 2001). While the research on phytoplankton has thus been centered around ecological dynamics, their evolutionary dynamics have received considerably less attention. Although several studies have been done to assess the effects of resource gradients on evolutionary outcomes, these studies were of a more general character (Brown 1996; Fryxell 1997; Geritz et al. 1998; Day 2000; Ronce and Kirkpatrick 2001; Krivan and Sirot 2002; Doebeli and Dieckmann 2003; Mizera and Meszena 2003). Analysis of the evolutionary dynamics of a more specific and realistic system is expected to lead to more specific results and additional insights. Also, many of the studied systems have selfgrowing, reproducing lowest trophic levels (the logistic
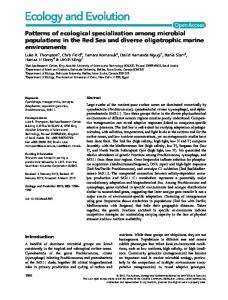
growth model is very popular) and are based on implicit assumptions about their food dynamics; frequently, they are at odds with conservation of mass (Kooi et al. 1998). In reality, however, all trophic levels are closely interlinked, including the zero trophic (abiotic) level. These assumptions can have considerable effects on the evolutionary dynamics of the system, as already became apparent in a previous study on mixotrophs in a closed and homogeneous system (Troost et al. 2005). In this study, we again explicitly take into account the dynamics of the lowest trophic level, but now we consider the mixotrophs to live in a mixed water column with a light intensity gradient; this is a closed but heterogeneous system. The article is organized as follows: first, we give a short description of the mixotroph model and the methods used for analyzing its evolutionary outcomes. Then, we discuss the general effects of a light intensity gradient on the ecological and evolutionary dynamics of the mixotroph system. Thereafter, we explain how system characteristics such as spatial structure and mass balances affect the evolutionary outcomes. Finally, we discuss the specific effects of mixing intensity, mixing depth, and nitrogen content on the evolution of specialization. Modeling Mixotrophs in a Water Column We model a mixotrophic population in a water column, which is based on the mixotroph model presented in Kooijman et al. (2002). The model is based on the dynamic energy budget theory, which is a modeling framework for metabolic processes based on physiological rules for uptake and use of energy and nutrients (Kooijman 2000). It respects the principles of energy and mass conservation and stoichiometric constraints on the synthesis of biomass. The population dynamics of the mixotrophs were simplified according to the same assumptions made by Troost et al. (2005), which were found to have no qualitative effect and only a small quantitative effect on the evolutionary outcomes of the system. The model has only one state variable for the mixotrophic organisms (biomass X V) and three state variables to describe the abiotic environment: detritus X D, dissolved inorganic carbon (DIC) X C, and dissolved inorganic nitrogen (DIN) X N. The latter two states consist of only one nutrient, while biomass and detritus are thought of as generalized compounds containing both carbon and nitrogen and other elements in a fixed chemical composition. It is assumed that elements other than carbon and nitrogen are not limiting the growth of the organisms. The system is closed for mass but open to energy (light and heat production). The four state variables partake in five transformations: assimilation A (autotrophic AA and heterotrophic A H assimilation), growth G, maintenance M, and death H (see
Specialization of Mixotrophs table 1). A diagram of these transformations is shown in figure 1. The mixotrophic organisms are capable of both autotrophic and heterotrophic assimilation, for both of which they have a certain affinity, denoted by rA and r H, respectively. The mixotrophs use DIC, DIN, and light for the autotrophic pathway and detritus for the heterotrophic pathway. Once taken up, these resources are synthesized into basic building blocks. Part of the assimilates is used for maintenance; the rest is turned into biomass. When an organism dies, its biomass turns into detritus and becomes available for its conspecifics. Maintenance costs, overhead costs for growth, and stoichiometric constraints take care of the conversion of organic carbon and nitrogen back into their inorganic form; other means of mineralization of detritus such as decomposition by bacteria are not considered. A brief description of the main growth fluxes and evolutionary processes is given below, which is followed by a section on the spatial structure of the water column and the equations for the vertical transport. A detailed discussion on the growth equations of the mixotrophs is given in the appendix.
E47
Assimilation and Evolution The mixotrophs are capable of both autotrophy and heterotrophy, and therefore they are assumed to use light, carbon, nitrogen, and detritus for assimilation. The corresponding functional responses ( fA for the uptake of nutrients involved in the autotrophic route and f H for the uptake of nutrients involved in the heterotrophic route) are calculated with the use of synthesizing units (SU; cf. Kooijman 1998), which provide a simple and realistic method for calculating production fluxes at simultaneous limitations. This method provides a more realistic alternative for Liebig’s law, which assumes that only one resource is limiting at a time. The mixotrophs are characterized by their affinities for the autotrophic and heterotrophic assimilatory pathways rA and r H, which together represent the trophic preference of the organisms. These affinities affect the organism’s autotrophic and heterotrophic assimilation rates j V, AA and j V, AH and consequently the total assimilation rate j V, A (eqq. [A6]–[A8]). Affinities for either pathway are assumed to entail costs for building the necessary machinery, which
Figure 1: Diagram of the metabolism of a mixotroph. The shaded box encloses the organism, the lighter part of which denotes its membranes containing the assimilatory machinery. A circle denotes a synthesizing unit (only synthesizing units with two or more substrates are shown). The organism has one state variable for biomass XV . The environment consists of three states: dissolved inorganic carbon XC , dissolved inorganic nitrogen XN, and detritus XD. Arrows indicate the structure-specific transformation fluxes.
E48 The American Naturalist are included by means of the yield coefficient yC, V, which consists of certain base costs y 0 increased by extra costs for building the assimilation machineries y A and y H, which for both pathways is proportional to the corresponding affinity (eq. [A14]). The parameter z determines the shape of the cost function; convex cost functions (z 1 1) give the organisms an intrinsic advantage to evolve to specialized strategies, while concave cost functions (z ! 1) give them an intrinsic advantage to evolve to mixotrophic strategies. Intrinsic advantage means that it is naturally inherent to the physiology of the organism and thus not induced by the external environment. As a default, the cost function is chosen to be linear (z p 1) because this gives a neutral trade-off that does not favor mixotrophic or specialized strategies (Troost et al. 2005). The two affinities are assumed to be traded off, following the requirement that r H ⫹ rA p 1.
冕 冕
⫺L m
X C⫹ p
(X C(L z , t) ⫹ X D(L z , t) ⫹ X V (L z , t))dL z ,
(2)
[X N(L z , t) ⫹ n N,V (X D(L z , t) ⫹ X V (L z , t))]dL z ,
(3)
0 ⫺L m
X N⫹ p
0
in which n N, V is the fixed amount of nitrogen per mole carbon in biomass and detritus. The system is open to energy; light comes in at the surface and is absorbed by biomass, detritus, and nonplankton components. According to Lambert-Beer’s law, the light absorption is proportional to the density of biomass and detritus and to the background turbidity. The change in light intensity is given by ⭸JL, F (L , t) p ⫺(a ⫹ b V X V (L z , t) ⫹ b D X D(L z , t))JL, F(L z , t), ⭸L z z
(1)
(4)
That is, we effectively have a one-dimensional trait space, which is denoted by r p rA. Organisms that have a r of unity are thus pure autotrophs, and those that have a zero r are pure heterotrophs; strategies in between correspond to mixotrophic organisms with a range of different trophic preferences. The trophic preference r of the mixotrophs is genetically determined, and in combination with their abiotic environment, it determines the fitness of the organisms. The mixotrophs reproduce asexually, and a parent passes its trophic preference on to its offspring; sloppy heredity may, however, introduce small changes in the trophic preference. These mutations give rise to differences in fitness between the organisms, and mutants with a higher fitness can replace (or coexist with) the resident population; it is by a series of such replacements that the population evolves. A timescale separation is assumed to exist between the ecological and the evolutionary timescale, so mutations occur only after the system has reached a steady state.
where a denotes the background turbidity; b V and b D are the specific absorption coefficients for biomass and detritus. Integrating this equation over depth gives the following light intensity JL, F at depth L z and time t:
Spatial Structure, Light Gradient, and Vertical Transport The aquatic environment in which the mixotrophs live is modeled as a one-dimensional water column. The vector X(L z , t) denotes the densities of the compounds (X C, X N, X D, X V) at depth L z and time t ; L z 苸 (⫺L m, 0), where L m is the maximum depth of the water column. Mass transport through the column is possible, but the column as a whole is closed for mass. Hence, the total carbon content X C⫹ and the total nitrogen content X N⫹ of the system are constant; they consist of the amounts of carbon (or nitrogen) in each of the four compounds, integrated over the depth of the water column:
JL, F(L z , t) p
[
冕
Lz
JL, F(0) exp aL z ⫹
]
(b V X V (l, t) ⫹ b D X D(l, t))dl , (5)
0
where JL, F(0) is the amount of incoming light at the surface. Diurnal changes in incoming light intensity are not taken into account. As a default, self-shading (light absorption by plankton components) is neglected (b V p 0, b D p 0), and equation (5) can be simplified into JL, F(L z) p JL, F(0) exp (aL z).
(6)
The value of the background turbidity (a p 0.07 m⫺1) was chosen such that the light intensity is reduced to about 6% at 40 m depth. In the oligotrophic/eutrophic scenarios, where self-shading is taken into account, the specific absorption coefficients of biomass and detritus were set to values of b V p 0.1 and b D p 0.05 m2 mol⫺1, respectively. The specific absorption coefficient of biomass was assumed to be higher than that of detritus because of the presence of photosynthetic pigments in biomass; these pigments are largely broken down in detritus. Values of the specific absorption coefficients were based on those found in Falkowski and Woodhead (1992) and Valiela (1995). The decrease in light intensity affects the autotrophic
Specialization of Mixotrophs assimilation rate; density gradients build up as a consequence and induce diffusive transport through the water column. This diffusive transport is modeled as a downgradient mixing process, which uses a finite mixing coefficient. Therefore, a density gradient is retained throughout the mixed layer even at considerable turbulence levels. The phytoplankton cells are assumed to be neutrally buoyant; that is, there is no advection. The reaction-diffusion equation for the change in density of the compounds amounts to ⭸X ⭸2 (L z , t) p F ⫹ K V 2 X(L z , t), ⭸t ⭸L z
(7)
E49
of “adaptive landscapes,” of which some examples are given in figure 2. Adaptive landscapes plot invasion fitness to strategy; they visualize by which mutants a resident population can be invaded. The residents (denoted by a solid circle) have, as was discussed above, a zero invasion fitness. Evolution is directed toward strategies with a higher invasion fitness than the resident strategy and will therefore follow the fitness gradient D1 , that is, the derivative of the fitness function with respect to the trait of the mutant rmut: D1 p
⭸srres (rmut ). ⭸rmut
(9)
where the growth term F is a vector consisting of the righthand sides of equations (A1); K V p 0.5 m2 day⫺1 and denotes the vertical mixing coefficient that is assumed to be the same for all compounds and uniform over the whole depth of the water column. Mixing is thus not hindered by a thermo- or pycnocline, and the mixing depth of the water column is equal to its maximum depth. Neumann boundary conditions are imposed; this implies no material fluxes at the surface and the maximum depth of the water column:
In figure 2, the direction of evolution is indicated by arrows. Evolution will drive the population to a singular strategy (SS) at which the fitness gradient vanishes (D1 p 0); this is an evolutionary equilibrium. The evolutionary stability of such an SS is determined by the second derivative (D2) of the fitness function:
⭸X (L , t) p 0 for L z p ⫺L m, 0. ⭸L z z
Two types of singular strategies that are most relevant to this study are the continuously stable strategies (CSS) and the evolutionary branching points (EBP). The CSSs are attractors and lie at a fitness maximum at which the second derivative of the fitness gradient is negative (D2 ! 0); this is an evolutionarily stable situation, and the population will remain at such a strategy (fig. 2B). The EBPs are attractors as well, but these lie at a fitness minimum at which the second derivative of the fitness gradient is positive (D2 1 0); now any nearby mutant is able to invade (fig. 2E). In this case, disruptive selection will induce the population to split up and become dimorphic. In the remainder of the article, the adaptive landscapes and the vertical profiles show only the system for residents that have already reached an SS.
(8)
Evolutionary Analysis Predictions of the evolutionary outcome of the system are made with the use of adaptive dynamics (AD) theory (Dieckmann and Law 1996; Metz et al. 1996; Dieckmann 1997; Geritz et al. 1997). In this theory, the invasion fitness of a mutant invading in a resident population srres(rmut ) is defined as its long-term average per capita growth rate. The resident population is assumed to have reached a steady state with its environment so that resources are reduced to a level that just covers the costs of exploitation; the residents thus have by definition a zero invasion fitness: srres(rres ) p 0. A mutant is assumed to be rare and will therefore not affect the environment in the short term. Mutants that have a positive invasion fitness (specific growth rate) may be able to invade; those that have a negative invasion fitness will just die out. Following the invasion, a mutant may replace the resident population and become the new resident or live on in coexistence with the original population. Together, the changed population and the environment will reach a new steady state, in which the new residents will again have a net specific growth rate of 0. The evolutionary process can be illustrated by means
D2 p
⭸ 2srres (rmut ). 2 ⭸rmut
(10)
Results and Discussion Vertical Profiles and Evolutionary Outcomes When no light intensity gradient is present, the system is spatially homogeneous. In this case, and if costs for autotrophy and heterotrophy are neutral with respect to specialization (z p 1), the population will evolve to a trophic preference of r p 0.68. This is a singular strategy that lies at a fitness maximum and thus is evolutionarily stable (CSS); the corresponding adaptive landscape is almost flat (fig. 3F, dotted line). When imposing a light intensity gra-
E50 The American Naturalist
Figure 2: Schematic examples of adaptive landscapes; the residents are denoted by a solid circle, and the arrows indicate the direction in which the population will evolve. A, D, The strategy of the residents is smaller than the singular strategy (SS). B, E, The resident strategy is equal to the SS. C, F, The resident strategy is larger than the SS. B represents an adaptive landscape of an SS that is evolutionarily stable (continuously stable strategy [CSS]), while E represents an adaptive landscape of an SS that is evolutionarily unstable (evolutionary branching point [EBP]).
dient (fig. 3E), the system becomes heterogeneous, which has both ecological and evolutionary consequences. On an ecological timescale, the autotrophic production rate begins to vary throughout the system and becomes highest in the euphotic surface layer. Here, nutrients will get depleted while biomass and detritus densities will increase. The resulting differences in concentrations will cause net movement due to diffusion. Imposing a light intensity gradient thus triggers a cascade of density gradients, locally limiting factors, and diffusive transport processes. This results in the steady state profiles that are shown by the solid lines in figure 3A–3D. These profiles correspond well to the typical vertical structure of the water column in tropical latitudes (Mann and Lazier 1996): the light intensity is highest at the surface, while the source of nutrients is at depth; at the surface, a nitrogen-depleted layer exists. The model also captures the observed sharp gradient in the nitrogen density and the shallow peak of autotrophic production (not shown). On an evolutionary timescale, the light intensity gra-
dient induces the SS to shift to a slightly more autotrophic value (r p 0.69), which now comes to lie at a fitness minimum (fig. 3F, solid line). This is an evolutionary branching point (EBP), at which the mixotrophic population may split up into two specialized subpopulations. Here, evolutionary branching is expected to result in (almost) pure autotrophs (r p 0.97) and heterotrophs (r p 0.0), since these form an evolutionarily stable coexistence; this coexistence was found by manually adjusting the traits of the two strategies until they were at the boundary or at an ESS. The autotrophs in this coexistence are at a fitness optimum with a fitness gradient of 0, while the heterotrophs are at a fitness boundary maximum (fig. 3F, dashed line). The dotted lines in figure 3A–3D show the profiles that result after evolutionary branching has taken place. The total amount of biomass is not very different from that of the mixotrophic population, and the distribution has changed slightly. The DIC and DIN densities have increased, but the depth of the nitrogendepleted layer is unchanged.
Specialization of Mixotrophs An intuitive explanation for the occurrence of the evolutionary branching and the resulting ecological specialization of the mixotrophs is related to their lack of flexibility. Each variation in habitat can be optimally exploited
E51
by a different phenotype. However, the mixotrophs have a fixed phenotype with a constant ratio of the two affinities that they cannot adjust on an ecological timescale. Neither can autotrophs and heterotrophs, but by changing their abundances relative to the other, they are able to change the ratio of autotrophy to heterotrophy. Together, they can adjust themselves to any habitat, which gives them an advantage over mixotrophic phenotypes. The result that a light intensity gradient induces evolutionary branching is consistent with previous, more general studies on the effects of spatial (or temporal) heterogeneity on evolutionary outcomes. Some of these studies (Fryxell 1997; Krivan and Sirot 2002) assumed two, three, or a range of habitats with, for instance, different resource types or productivities that lead to differences in demographic parameters that are consistent across genotypes; in these studies, the genotype determines the habitat choice or preference. Other studies (Brown 1996; Geritz et al. 1998; Day 2000; Ronce and Kirkpatrick 2001; Doebeli and Dieckmann 2003; Mizera and Meszena 2003) assumed that no habitat was intrinsically more productive than another but that different genotypes achieve different growth rates, carrying capacities, or mortality rates (genotype by environment interaction; Brown 1996; Geritz et al. 1998; Day 2000; Ronce and Kirkpatrick 2001; Doebeli and Dieckmann 2003; Mizera and Meszena 2003); here, the habitat choice is passive, like in this article. In these studies, it was found that heterogeneity of the environment facilitates evolutionary branching. Doebeli and Dieckmann (2003) explain that the underlying mechanism is an enhanced degree of frequency dependence. Open and Closed Systems
Figure 3: Vertical profiles and adaptive landscape for the monomorphic population (solid lines) and those for the dimorphic population after evolutionary branching has taken place (dotted and dashed lines). The former consists of mixotrophs that have reached the singular strategy; the latter population consists of separate heterotrophs (dashed line h) and almost pure autotrophs (dashed line a) that have reached an evolutionarily stable coexistence. A–E show the densities of dissolved inorganic carbon (XC), dissolved inorganic nitrogen (XN ), detritus (XD ), biomass (XV ), and the light intensity gradient (JL,F ), plotted against the depth Lz . The adaptive landscapes in F plot invasion fitness srres(rmut) against a range of mutant strategies rmut; the dashed line shows the adaptive landscape with two resident strategies after branching, and the dotted line shows the (almost flat) adaptive landscape at the singular strategy for a homogeneous system.
A remarkable difference between this and earlier studies becomes apparent when the locally different habitats, present in the heterogeneous systems, are considered in isolation. When isolated, these habitats resemble homogeneous systems with different environments. In most studies, the populations will adapt to these different environments, resulting in a different phenotype per habitat. By contrast, in the mixotroph system, the population will always evolve to one and the same mixotrophic strategy, regardless of its habitat. The difference lies in the fact that the mixotroph system is closed for mass. The isolated habitats can thus be considered as closed and homogeneous systems, for which we showed that their evolutionary outcomes are not affected by environmental properties indeed (Troost et al. 2005). This result was explained by the feedback mechanisms of the mixotrophs and the recycling processes in the system that couple the steady state densities of the environment such that they cannot change independently. Changing an environmental property affects
E52 The American Naturalist not one but all of the steady state densities. Ultimately, the feedback fluxes produced by the mixotrophs determine the steady states of the environment and not vice versa. Therefore, the evolutionary outcome is determined only by the organism’s intrinsic properties quantifying these feedback fluxes. Organisms with equal properties will thus always evolve toward the same (mixotrophic) strategy. Apparently, the light intensity gradient not only facilitates evolutionary branching but also provides the degrees of freedom that enable phenotypic variation (and thus ecological specialization) to occur. This freedom is associated with the vertical transport in the water column. Although the transport of the organisms is analogous to the migrational or dispersal processes considered in previous studies, transport of other compounds in the environment is generally not taken into account. For the mixotrophs, however, such transport is essential, because the system is closed for mass and a full recycling of material has to take place. Transport between the layers relaxes the requirement of mass conservation, which now has to be respected only at the level of the whole water column. As a consequence, complementary processes such as autotrophic and heterotrophic assimilation can be carried out at different locations as long as their products are exchanged. It is also possible to induce evolutionary branching in homogeneous systems, but then an intrinsic advantage is required that favors specialism over mixotrophy. Such an advantage can, for example, be induced by a nonlinear cost function (z 1 1). The spatial gradient in this study, however, induces evolutionary branching without an intrinsic advantage (z p 1). In some cases, it even induces evolutionary branching with an intrinsic disadvantage (z ! 1), as will be discussed later. Whereas in closed and homogeneous systems the environmental properties have no effect on the evolutionary outcomes at all, in a closed and spatially heterogeneous environment these properties may acquire influence through their effect on the spatial gradient. Examples of such environmental properties are mixing intensity, mixing depth, and total nutrient content, which are discussed in the following sections. In homogeneous systems, environmental properties can only induce phenotypic variation when the system is opened for mass (Troost et al. 2005). Opening the system for mass relaxes the requirement of full material recycling and thus reduces the effect of the feedback mechanisms. As a consequence, the environmental properties that determine the in- and outfluxes of the system can affect the steady state densities of the environment, and as such, they acquire influence on the evolutionary outcomes as well (Troost et al. 2005). Another difference with previous studies is the occurrence of habitat segregation. Doebeli and Dieckmann (2003) show that branching induced by spatial heteroge-
neity and local adaptation is often accompanied by geographical segregation. This is because the local environment at the one end of the gradient is more favorable for one of the morphs, while the local environment at the other end is more favorable for the other morph. Basically, such a single spatial gradient thus provides two opposite gradients, which results in a clear habitat segregation of the two morphs. Figure 3D, however, shows that after mixotrophs have specialized into separate autotrophs and heterotrophs, habitat segregation does not occur. Although the autotrophs are more abundant at the surface and the heterotrophs are (relatively) more abundant at the bottom of the column, the geographical differentiation is not sharp and far from complete. This is because the light intensity gradient has a direct effect only on the autotrophs; these autotrophs produce the substrates for the heterotrophs, so the resulting detritus gradient is closely related to that of the light intensity gradient and certainly not opposite of it. The mutual dependency of the two phenotypes, and thus that of the two substrate gradients, restricts the degree of the spatial heterogeneity. This explains why a clear habitat segregation does not occur. Probably, it also explains why the fitness differences between the various strategies are not very large and why the spatial profiles of the mixotrophs before branching are so similar to the profiles of the auto- and heterotrophs after branching. To induce and maintain two opposite substrate gradients (more spatial heterogeneity) in the studied system, we will need additional mechanisms that actively separate autotrophic and heterotrophic substrates. These mechanisms could, for instance, be a downward transport (sinking) of detritus, in combination with upward diffusion of DIC and DIN. The upward diffusion of DIC and DIN can probably also be replaced by the more effective alternative of a continuous influx of these nutrients at the surface of the water column. This would imply opening the system for mass and thus reducing the mutual dependency of the two phenotypes. This could be taken a step further by assuming a “lateral” in- and outflux, that is, in- and outputs of material over the whole depth of the column, which would totally eliminate the mutual dependency between the auto- and heterotrophs and readily increase the degree of spatial heterogeneity. Because in studies of open systems recycling is not necessary, feedback loops and mutual dependencies are often not considered. Hence, habitat segregation will be found more often in those studies than in studies considering closed systems. The Role of Diffusion and Turbulent Mixing Figure 4A shows the evolutionary stability of the system when the mixing intensity is varied simultaneously with z. We recall that values of z larger than 1 give the organisms
Specialization of Mixotrophs
E53
Figure 4: Bifurcation diagrams showing the evolutionary outcomes of the mixotroph system when the shape coefficient z (eq. [A14]) is varied simultaneously with (A) the mixing intensity KV and (B) the total nutrient content XN⫹ ; CSS denotes that for these parameter values, the organisms will evolve toward a mixotrophic strategy at which they will remain; EBP denotes that the singular strategy is evolutionarily unstable so that the population may split up and evolve into specialists. The dashed line in A denotes the critical mixing intensity above which the system is not viable, and in B it denotes the critical nutrient content below which the system is not viable.
an intrinsic advantage to specialize into autotrophic and heterotrophic strategies, while values smaller than 1 provide a disadvantage to specialization. In the figure, it can be seen that when only molecular diffusion takes care of the vertical transport (K V p 9.10⫺5 m2 day⫺1), the evolutionary equilibrium (SS) will be stable unless z becomes equal to or larger than unity. This implies that, if they have an intrinsic disadvantage to specialization, the organisms will always evolve to a mixotrophic strategy and remain on it. Apparently, the substrate gradients resulting from molecular diffusion are not sufficient to “counteract” such a disadvantage. In real life, however, vertical transport is not restricted to molecular diffusion. Eddy or turbulent diffusion is due to external sources such as wind stress and mixes the water much more effectively than does the molecular motion. Figure 4A shows that at higher mixing intensities, the SS becomes unstable, even though z ! 1. In this case, the population may thus split up and specialize into autotrophs and heterotrophs, regardless of their intrinsic disadvantage to specialization. Clearly, increasing the mixing intensity makes the singular strategy more susceptible to invasion and thus facilitates ecological specialization. Although it was shown that an increase in the mixing intensity facilitates evolutionary branching, it can be theorized that the effect will be reduced at very high intensities. This is because at high mixing intensities, the water column will lose its heterogeneous character; even though the light intensity gradient will still be present, the organisms will be circulating randomly through the column and will on average be exposed to the same amount of light.
Effectively, a completely mixed system will thus be equal to a homogeneous system, which by definition has no spatial gradient. However, it was found that high mixing coefficients (K V 1 102) lead to the extinction of the population. At these mixing intensities, the phytoplankton cells are mixed to great depths and will on average be exposed to light intensities that are too small to allow a net positive population growth. Apparently, the depth of the water column exceeds the critical depth, which for neutrally buoyant phytoplankton is equal to the “Sverdrup depth” (Huisman et al. 1999b). This is the depth at which the integrated autotrophic production exactly equals the integrated respiration. To test the effects of a high mixing intensity, we thus needed to reduce the mixing depth to prevent the population from extinction. In natural systems, the mixing depth is limited by a thermo- or pycnocline. Here, we simply reduced the maximum depth of the water column to 40 and 30 m, respectively; the steepness of the light intensity gradient and the grid cell size used for discretization were unchanged; the cost function was assumed to be neutral with respect to specialization (z p 1). Figure 5 shows that high mixing intensities indeed result in a decrease of the second derivative of the fitness function (dashed line for L m p 40 m, dotted line for L m p 30 m). This suggests that facilitation of evolutionary branching is highest at intermediate mixing intensities. Since intermediate mixing intensities result in intermediate gradients of DIN and “light exposure,” this is in agreement with Doebeli and Dieckmann (2003), who find that at inter-
E54 The American Naturalist
Figure 5: Second derivative of the fitness function D2 for a range of mixing intensities and at various mixing depths: Lm p 70 m (solid line), Lm p 40 m (dashed line), and Lm p 30 m (dotted line). In this graph, the cost function is assumed to be neutral with respect to specialization (z p 1).
mediate gradients the facilitation of evolutionary branching is highest. From the figure, it also follows that an increase in the mixing depth positively affects evolutionary branching and thus supports ecological specialization. While increasing the mixing coefficient was thus found to facilitate the process of evolutionary branching, it seems to have only a small effect on the final evolutionary outcomes that result after branching has taken place. The mixotrophs again specialize into pure heterotrophs and almost pure autotrophs. The corresponding adaptive landscape is qualitatively also very similar to the landscape that was found at the default parameter values (fig. 3F, dashed line); at higher mixing intensities, it just becomes more pronounced, with a deeper fitness valley between the two coexisting strategies. Effects of the Total Nutrient Content Nutrients such as nitrogen and phosphorus are important limiting factors in aquatic systems. The mixotrophs in our model are nitrogen limited, as can be seen from the nitrogen-depleted layer in the vertical profiles (fig. 3B). Although an increase in the total amount of DIN in the system does lead to an increase in the amount of biomass, it does not affect the depth of the nitrogen-depleted layer, and neither does it affect the evolutionary outcomes (not shown). This is because nitrogen does not directly interfere with the light intensity and its gradient. However, when taking into account self-shading, nitrogen content will affect the light intensity gradient indirectly. Self-shading decreases the total amount of available light and alters the light intensity gradient. In eutrophic
systems (which have a larger total nutrient content) organisms are more abundant, so a larger proportion of the incoming light is absorbed than in oligotrophic systems (with smaller nutrient contents). Figure 4B shows the evolutionary stability of the system when X N⫹ and z are varied simultaneously. Below a critical nitrogen content (X N⫹ ! 28), the system is not viable. At small nitrogen contents, the singular strategies are evolutionarily unstable (EBP) only at a narrow range of z values where the intrinsic disadvantage to specialization is small. At higher nutrient contents, the range of z values under which branching will occur has increased. High nutrient contents may thus lead to ecological specialization under a larger range of cost functions. This result links evolutionary branching and specialized strategies to higher nutrient contents and thus to eutrophic systems, while it links mixotrophic strategies to oligotrophic systems. Indeed, mixotrophs are observed to be most dominant in oligotrophic environments (Beaver et al. 1988; Holen 2000). This is mostly explained by the fact that mixotrophs have access to two food sources, which is assumed to increase their chances of survival when resources are limited (Nygaard and Tobiesen 1993; Thingstad et al. 1996; Raven 1997; Dolan and Perez 2000). The present result that evolutionary branching is facilitated by eutrophic conditions more than by oligotrophic conditions may provide an additional mechanism underlying the association between mixotrophs and oligotrophic environments. Conclusions Evolution of Specialization The light intensity gradient makes evolutionary branching possible, such that mixotrophs living in a mixed water column may specialize into separate autotrophs and heterotrophs. Because the system is closed for mass, the diffusive transport of all compounds through the system is essential and makes ecological specialization possible. By affecting the light intensity gradient, other environmental properties can also acquire influence on the evolutionary behavior of the system. It was found that evolutionary branching, and thus ecological specialization, is facilitated most by intermediate mixing intensities and large mixing depths. Under these circumstances, evolutionary branching may occur even when the organisms have an intrinsic disadvantage to specialization (z ! 1). If self-shading is taken into account, higher nutrient densities will facilitate specialization as well. This may provide an explanation for the observation that mixotrophs are more dominant in oligotrophic systems while specialized autotrophs and heterotrophs are more often found in eutrophic systems. Ecological specialization of mixotrophs results in a very simple
Specialization of Mixotrophs food web of autotrophs and heterotrophs and thus may correspond to the first steps in the evolution of an ecosystem. Since the results show how various environmental properties facilitate ecological specialization, they provide insight in how the environment affects the organization of food webs and which environmental conditions favor the development of ecosystems. Although nitrogen content and mixing intensity can increase the ranges of z values for which evolutionary branching occurs, this increase is not very large when compared with the full range of possible z values (fig. 4). This suggests that the shape of the cost function is more important than the environmental parameters in determining the evolutionary outcomes of the system. However, the quantitative impact of the spatial heterogeneity and that of the environmental properties may well depend on the degree of heterogeneity itself; including additional mechanisms that increase the spatial heterogeneity (e.g., sinking of detritus) may therefore be of importance before reaching quantitative conclusions. Also, the quantitative impact of the environmental parameters depends on the used parameter values, while the model was not tested against (nor fitted to) empirical data, and not all of the parameter values were empirically based. Therefore, we focus on the qualitative rather than on the quantitative results of the model. It would be interesting, however, to test the model predictions experimentally, such that the relative impact of environmental parameters can be quantified. Unfortunately, such experiments are difficult to realize. Experimental work with closed few-species ecosystems is rare; Kawabata et al. (1995) managed to maintain a threespecies community of heterotrophic protozoa, saprotrophic bacteria, and mixotrophic euglena, but experiments involving closed systems with only mixotrophs are not known to the authors. Furthermore, the predictions involve evolutionary processes, which requires experiments that continue over long time periods. However, we are optimistic about future possibilities, since in various experiments microbial populations limited by a single resource have been observed to evolve into stable dimorphisms (Rozen and Lenski 2000; Friesen et al. 2004). Concluding Remarks on Mass Conservation and Spatial Structure The study revealed that the assumptions on mass conservation and spatial structure can greatly affect the evolutionary outcomes. This should be taken into account when choosing or developing a model for the study of evolutionary behavior. In this final section, we summarize these effects and indicate their significance with respect to evolutionary speciation processes. In closed and homogeneous systems, evolutionary
E55
branching does not occur unless the organisms have an intrinsic advantage to specialization (z 1 1; Troost et al. 2005). Moreover, for z ≤ 1, phenotypic variation is not possible at all: the population always evolves to the same (mixotrophic) strategy. Environmental properties do not have any effect on this. Opening the system for mass makes phenotypic variation possible, and populations living in a different environment may now each evolve to a different trophic preference. This process of “local adaptation” of the asexual mixotrophs may correspond to a speciation process in sexually reproducing organisms. Such a speciation process would be “allopatric” since the reproductive isolation of the two descendant species is initially due to their geographical separation. Introducing a spatial heterogeneity (spatial gradient) in the system, as was done in this study, may induce evolutionary branching, even when the organisms have an intrinsic disadvantage to specialization (z ≤ 1). Hence, it may cause the mixotrophs to specialize into separate autotrophs and heterotrophs. Like local adaptation, evolutionary branching of the asexual mixotrophs may correspond to a speciation process in sexual organisms. In this case, however, speciation would be “sympatric,” since the two descendant species live in the same or in overlapping areas and geneflow is thus not hindered by geographical barriers. Finally, we showed that habitat segregation resulting from a spatial heterogeneity will be found more often in studies of open systems than in those considering closed systems. This is related to the mutual dependencies and feedback loops inherent to the full mass recycling, which may restrict the degree of spatial heterogeneity and its effects. Evolutionary branching resulting in habitat segregation suggests the possibility of an adaptive route to allopatric or parapatric speciation (Mizera and Meszena 2003). Acknowledgments We are grateful for the thorough comments by two anonymous reviewers, which have considerably improved the contents and presentation of the article. APPENDIX The Mixotroph Model State Variables and ODEs This appendix gives a detailed discussion on the growth equations of the mixotroph model. The spatial structure and vertical transport are discussed in the main text. Although all state variables depend on time t and on depth
E56 The American Naturalist
Figure A1: Detailed diagram of the metabolism of a mixotroph, showing the symbols of the fluxes. The shaded box encloses the organism, the lighter part of which denotes its membranes containing the assimilatory machinery. A circle denotes a synthesizing unit (only synthesizing units with two or more substrates are shown). The organism has one state variable for biomass XV . The environment consists of three states: dissolved inorganic carbon XC, dissolved inorganic nitrogen XN, and detritus XD. Arrows indicate the structure-specific transformation fluxes.
L z, here we discuss only how they depend on time, while their depth is considered to be fixed. The model is based on the mixotroph model presented in Kooijman et al. (2002) and is based on the dynamic energy budget theory. The population dynamics of the mixotrophs were simplified according to the same assumptions made in Troost et al. (2005), which are discussed in “Simplifications.” The model has only one state variable for the mixotrophic organisms (biomass X V) and three state variables to describe the abiotic environment (detritus X D, dissolved inorganic carbon [DIC] X C, and dissolved inorganic nitrogen [DIN] X N). The latter two states consist of one nutrient only, while biomass and detritus are thought of as generalized compounds containing both carbon and nitrogen and other elements in a fixed chemical composition. It is assumed that elements other than carbon and nitrogen are not limiting the growth of the organisms. The system is closed for mass but open to energy (light and heat production). The four state variables partake in five transformations: assimilation A (autotrophic AA and heterotrophic A H assimilation), growth G, maintenance M, and death H. An over-
view of these transformations was already given in the main text, accompanied by figure 1. A more detailed diagram is given in figure A1, which shows the symbols for all fluxes. DIC and DIN are assimilated via the autotrophic route, and their specific uptake fluxes are denoted by j C, AA and j N, AA; the resulting autotrophic assimilation flux is j V, AA. Detritus is taken up by the heterotrophic route, whose uptake flux is denoted by j D, AH; the resulting heterotrophic assimilation flux is j V, AH. The two assimilation fluxes are combined into a total production rate j V, A. Part of these assimilates are transformed into biomass (j V, G); maintenance costs (j V, M) and overhead costs take care of the conversion of organic ⫺1 material back into inorganic nutrients: (1 ⫺ yC, V)j V, AA, ⫺1 (yD, V ⫺ 1)j V, AH, and (1 ⫺ yC, V)j V, AH. The biomass density is diminished through mortality (j V, H); upon death, the biomass of these organisms turns into detritus (j D, H). The notation of these fluxes and the corresponding equations are introduced in table A1; default values of the parameters are given in table A2. The amounts of biomass, detritus, and DIC are all expressed in the number of moles of carbon. Therefore, at transformations without additional costs or losses, the pro-
Specialization of Mixotrophs duction flux equals minus its associated uptake flux: j V, H p ⫺j D, H and j V, M p ⫺j C, M. Also, biomass is assumed to have a constant chemical composition, and n N, V specifies the fixed amount of nitrogen per mole carbon. As a result, the uptake flux of DIN j N, AA equals n N, V times j C, AA; similarly, other fluxes involving nitrogen can also be rewritten: j N, M p n N, Vj C, M and j N, AH p n N, Vj C, AH. Finally, the specific maintenance and death rates of the mixotrophs are assumed to be constant, so j V, M p k M and j V, H p h. The temporal changes in state variables can now be summarized as follows:
d X p X V (j C, AA ⫹ j C, AH ⫹ k M), dt C
(A1a)
d X p X V (j C, AA ⫹ j C, AH ⫹ k M)n N, V , dt N
(A1b)
d X p X V (j D, AH ⫹ h), dt D
(A1c)
d X p X V (j V, G ⫺ h), dt V
(A1d)
where X i is the concentration of state variable i and ji, j is the specific flux of compound i partaking in transformation j. The fluxes are given by
j C, AA p ⫺
j V, AA , yC, V
j C, AH p ⫺j D, AH ⫺
(A2) j V, AH , yC, V
t Lz Xi Xi⫹ fi h Ji, j ji, j ji, Am ji, AK Ki KV kM ni, j yi, j z zi a bi ri
Dimension t l mol l⫺3 mol … t⫺1 mol i t⫺1 mol i mol mol i mol mol i mol mol l⫺3 l 2 t⫺1 t⫺1 … mol i mol … … l ⫺1 l 2 mol i⫺1 …
V⫺1 t⫺1 V⫺1 t⫺1 V⫺1 t⫺1
j⫺1
Note: t p time, l p length.
(A3)
j D, AH p ⫺yD, Vj V, AH ,
(A4)
j V, A ⫺ kM. yC, V
(A5)
j V, G p
The transformation of detritus into assimilates comes with overhead costs. The yield coefficient yD, V determines the fraction of detritus required per amount of produced assimilates. To compensate for the loss in this transformation, an additional amount of detritus is taken up. Therefore, the uptake flux of detritus j D, AH is equal to minus the amount of assimilates that is used for heterotrophic assimilation j V, AH times the yield factor yD, V (eq. [A4]). From the assimilation products, maintenance costs are paid; the resulting amount of material is used for growth (see eq. [A5]). At the transformation of assimilates into biomass, overhead costs have to be paid again, which is in this case taken care of by means of the yield coefficient yC, V. The DIC is thus taken up by autotrophic assimilation, but because of the overhead costs, not all of the carbon becomes biomass; the “lost” carbon is released in the environment in its inorganic form again. The same goes for DIN and detritus: part of these resources that are taken
Table A1: Symbols used for variables Symbol
E57
Interpretation Time Depth below water surface Concentration of compound i Total amount of compound i Scaled functional response for element/process i Hazard rate Flux of compound i associated with transformation j Structure-specific flux of compound i: Ji, j /MV Structure-specific max assimilation flux of compound i Structure-specific max saturation flux of compound i Saturation constant for compound i Turbulent mixing coefficient Maintenance rate Chemical coefficient for element i in compound j Mol compound i required per mol compound j Shape coefficient for the cost function Flux ratio ji, Am/ji, AK for compound i Background turbidity coefficient Specific absorption coefficient for compound i Affinity for assimilation route i (autotrophic or heterotrophic)
E58 The American Naturalist Table A2: Default parameter values Parameter h jL, F (0) jL, FK jV, AAm jV, AHm KC KN KD KV kM Lm nNV XC⫹ XN⫹ y0 yA yH yD, V z zC zN zCH a bD bV
Value .1 ⫺1 50 4.5 4.0 500 .1 2,500 .5 .1 70 .15 2,400 40 1.1 .5 .1 1.3 1 .1 .1 .01 .07 .1 .05
Dimension day⫺1 mol mol⫺1 mol mol⫺1 mol mol⫺1 mol mol⫺1 mM mM mM m2 day⫺1 day⫺1 m … mM mM mol mol⫺1 mol mol⫺1 mol mol⫺1 … … … … … m⫺1 m2 mol⫺1 m2 mol⫺1
day⫺1 day⫺1 day⫺1 day⫺1
up for assimilation are released again into the environment in the form of DIC and DIN. It is assumed that the overhead costs are paid from the assimilates produced in both assimilatory routes and in proportion to the two assimilatory fluxes. The DIC and DIN fluxes due to overhead costs paid by the autotrophic route come back into the environment in the same form (inorganic) as they were taken from it. Therefore, these can be “bypassed” in calculating j C, AA. This flux is then equal to minus the amount of DIC that is taken up from the environment for assimilation (j V, AA) plus the amount of DIC that is released through overhead costs; the latter amount can be calculated by subtracting the amount that is actually transformed into biomass (j V, AA/yC, V) from the amount that is taken up (j V, AA). This results in the following equation: j C, AA p ⫺j V, AA ⫹ (j V, AA ⫺ j V, AA/yC, V), which can be simplified into j C, AA p ⫺j V, AA/yC, V (eq. [A2]). Similarly, the amount of DIC that is released from the heterotrophic route j C, AH is equal to the difference between the amount taken up for assimilation j V, AH and the amount that is actually transformed into biomass: j V, AH ⫺ j V, AH /yC, V. But also at the transformation of detritus into assimilates, overhead costs had to be paid, and DIC and DIN were released. These losses are equal to the difference between the amount that is taken up for assimilation (yD, Vj V, AH) and the amount that is actually transformed into
assimilates (j V, AH). Combining these two release fluxes of DIC in the environment results in the following equation: j C, AH p (yD, V ⫺ 1)j V, AH ⫹ (j V, AH ⫺ j V, AH /yC, V). This equation can be simplified as j C, AH p yD, Vj V, AH ⫺ j V, AH /yC, V, in which the first term can be substituted by ⫺j D, AH (eq. [A3]). The deviation in equations (A2)–(A5) from Kooijman et al. (2002) is caused by the extra overhead costs that were included for the production of biomass by means of yC, V. These costs were introduced in Troost et al. (2005) to provide a trade-off between autotrophy and heterotrophy. Without such costs, the mixotrophs could increase both their assimilatory capabilities without any negative consequences. Although yet another trade-off is assumed in this study (see eq. [1]), these additional overhead costs were maintained. This provides the possibility to include an intrinsic advantage to either mixotrophic or specialist strategies and makes it better possible to compare these results with those of the previous study. In the next section, these costs and the assimilation fluxes j V, AA, j V, AH, and j V, A are explained. Assimilation Mixotrophs have two assimilatory pathways, the autotrophic and the heterotrophic one, of which the products are combined substitutably for biomass production. In the model, a central role is played by the affinities that the organisms have for each of these two assimilatory pathways: rA for the autotrophic route and r H for the heterotrophic route. A higher affinity may be interpreted as an increase or an improvement in the assimilation machinery that results in a higher assimilation flux. Autotrophic and heterotrophic assimilation fluxes j V, AA and j V, AH are proportional to the affinities, to the maximum assimilation rates j V, AAm and j V, AHm, and to the functional responses fA and f H: j V, AA p rA j V, AAm fA ,
(A6)
j V, AH p r H j V, AHm f H .
(A7)
In Kooijman et al. (2002), the affinities were not included in the assimilation fluxes but in the gross growth flux j V, A. Another difference is that here we assume that no limitation exists to the total assimilation flux (see “Simplifications”). The total assimilation flux then becomes j V, A p j V, AA ⫹ j V, AH.
(A8)
The functional responses fA and f H are modeled with the use of synthesizing units (SUs; Kooijman 1998, 2000), which provide a simple and realistic method for calculating production fluxes at simultaneous nutrient and light lim-
Specialization of Mixotrophs itations. Planktonic protists have a photosynthetic system that consists of two photosystems with which they stepwise convert carbon dioxide, nitrogen, and light into biomass. First, carbon dioxide and photons are bound by carriers. Then, the carbon dioxide is reduced into a carbohydrate. Nitrogen is bound and, together with the carbohydrates, synthesized into biomass. This process can be modeled by coupling several SUs. Binding fluxes of carbon fC and nitrogen f N can be calculated by a simple one-substrate SU; the reduction rate of carbon fCH can be calculated by a complementary SU for which both carbon and electrons are essential. Finally, fA can be calculated again with a complementary SU for which both carbohydrate and nitrogen are essential: fC p
XC , KC ⫹ XC
(A9)
fN p
XN , KN ⫹ XN
(A10)
fCH p
(1 ⫹ z⫺1 C ) , ⫺1 ⫺1 1 ⫹ z⫺1 f ⫹ x ⫺ (z C fC ⫹ x L )⫺1 C C L
(A11)
with x L p
⫺JL,F , JL,FK
y H, which for both pathways is proportional to the corresponding affinity: yC, V p y 0 ⫹ y A[1 ⫺ (1 ⫺ rA)z] ⫹ y H[1 ⫺ (1 ⫺ r H)z]. (A14) We recall that in this article we took r p rA p 1 ⫺ r H. The parameter z determines the shape of the cost function; convex cost functions (z 1 1) give the organisms an intrinsic advantage to specialized strategies, while concave cost functions (z ! 1) give them an intrinsic advantage to mixotrophic strategies. The fourth term in the cost function (y AH) as it was used in Troost et al. (2005), involving costs due to the interaction between the two assimilatory routes, was for simplicity not taken into account (y AH p 0). On the basis of Raven (1997), the costs related to the autotrophic machinery y A were assumed to be higher than the costs related to the heterotrophic machinery y H. The costs are paid by both assimilatory pathways (j V, AA and j V, AH), proportional to the contribution of these pathways to the total assimilation flux j V, A; see equations (A2), (A3), and (A8). Simplifications
⫺1 ⫺1 [1 ⫹ z⫺1 N ⫹ z CH ⫺ (z N ⫹ z CH) ] fA p , ⫺1 ⫺1 ⫺1 ⫺1 1 ⫹ z N f N ⫹ z CH fCH ⫺ (z N f N ⫹ z CH fCH)⫺1
(A12)
where K i is the saturation constant for compound i and z i is a scaling parameter that weighs the contributions of carbon C, carbohydrates CH, and nitrogen N. Light influx JL, F (negative, because photons flow in) is scaled with parameter JL, FK so that a multiplication of these two fluxes with an arbitrary number (different from 0) has no effect. At the surface of the water column, the light influx can be taken proportional to the solar irradiance (photon flux per unit of surface area of water/air boundary layer). Below the surface, the light influx depends on the depth according to equation (5) (with self-shading) or to equation (6) (without self-shading). The functional response of the heterotrophic route f H depends on the binding of detritus, which can be represented by a one-substrate SU: fH p
E59
XD , KD ⫹ XD
(A13)
in which K D is the saturation constant for detritus. Affinities for either pathway are assumed to entail costs for building the necessary machinery, which are taken care of by means of the yield coefficient yC, V. This yield coefficient consists of certain base costs y 0, increased by extra costs for building the assimilation machineries y A and
As mentioned above, the population dynamics of the mixotrophs were simplified according to the same assumptions made by Troost et al. (2005). These assumptions were found to have no qualitative and only a small quantitative effect on the evolutionary outcomes, while they simplify the model considerably. The first simplification concerns the structure of the organisms. The mixotrophs are assumed to consist only of structural biomass and not to have storage pools or reserves. Reserves may be very important when studying the transient behavior and ecological dynamics of a system and, in particular, when considering a fluctuating environment. However, here we assume a constant environment; in addition, we study the evolutionary dynamics of the system for which we assume that the system is always in steady state at an ecological timescale. Second, it is assumed that no limit exists to the total assimilation rate j V, A, which was done by increasing the maximum assimilation rates (kA and k H r ⬁). As a consequence, the total assimilation flux j V, A can be calculated by simply adding the autotrophic and heterotrophic assimilation rates j V, AA and j V, AH. This makes the maximum assimilation rates (kA and k H) as well as the intermediary assimilation fluxes that were used in Kooijman et al. (2002; j VA, AA and j VH, AH) redundant and thus leads to a simpler formulation. Again, this assumption mainly affects the transient dynamics of the system.
E60 The American Naturalist Third, DIN was assumed not to play a role in the heterotrophic assimilation route. In Kooijman et al. (2002), detritus was complemented with DIN in order to synthesize the nitrogen-rich reserves. Here, we assume that DIN does not affect the heterotrophic route at all, and the flux is removed from the equations. In the base model, the saturation constant for the uptake of DIN via the heterotrophic route K NV was already set to a small value, such that the heterotrophic assimilation rate was hardly affected by DIN. Since the two models become equal when the saturation constant goes to 0 (K NV r 0), they are effectively very similar. Finally, we used a more common formulation of Lambert-Beer’s law 5 by removing the maximum depth L m from the equation. This resulted in a different interpretation and dimension of a. Numerical Methods To calculate the steady state vertical profiles of the four variables (X C, X N, X D, X V), the equations are solved with the method of lines: first, the spatial derivatives are discretized using central differences on a regular grid consisting of N cells; then, the resulting system of 4N ordinary differential equations is solved by numerical integration. For this, we use a standard FORTRAN routine (DIVPAG) from the International Mathematical and Statistical Libraries (IMSL) for implicit integration of ordinary differential equations (ODEs), which can handle stiff systems. To speed up the calculations, the routine is set to select the chord method in which the Jacobian is replaced by a diagonal approximation based on a directional derivative. It turns out that a value of N p 40 gives sufficiently accurate results. Because the plankton cells are assumed to be neutrally buoyant, we do not have an advection term in the reaction-diffusion equations. This makes it rather straightforward to solve them. When taking into account self-shading, the depth integral in equation (5) classifies the partial differential equation (PDE) model as an integro-PDE, which is computationally more demanding than simulation of standard PDEs (Huisman and Sommeijer 2002). Calculations, however, did not raise any problems. To calculate the evolutionary outcomes, we need to calculate the invasion fitness of potential mutants. In the heterogeneous environment, the specific growth rate of the mutants varies with depth. Therefore, we cannot use their specific growth rate as the invasion criteria straightaway, but we have to take into account the distribution of the resident and the mutant population over the depth of the water column. Mathematically, this comes down to calculating the dominant eigenvalue l, evaluated in the SS of the linearized discretized system that includes the
mutant. If l is negative, the mutant cannot invade; if l is positive, the mutant is able to invade. Therefore, an additional state variable for the mutant is included in the model; its density was set to 0 (X Vmut p 0) since mutants are assumed to be rare. The resulting system now consists of 5N ODEs. The Jacobian of this system is calculated with a FORTRAN routine (again from the IMSL) that uses forward differences (DFDJAC), and the associated eigenvalues are found with the routine DEVLRG. Because mass balances are applied to the total carbon and nitrogen content in the system, two of the resulting eigenvalues are always 0. The resident population is assumed to be in stable equilibrium with its environment, so all other eigenvalues of the system without the mutant are negative. For the system including the mutant, the largest eigenvalue (other than the two zeros) represents the long-term growth rate of the mutant and thus its invasion fitness: srres(rmut ) p l. The evolutionary equilibria, at which the first derivative of the fitness function at the strategy of the resident is equal to 0 (D1 p 0), were found with the bisection method. The second derivatives of the fitness function (D2) are determined quantitatively by taking second-order central finite differences. Literature Cited Beaver, J. R., T. L. Crisman, and R. W. Bienert Jr. 1988. Distribution of planktonic ciliates in highly coloured subtropical lakes: comparison with clearwater ciliate communities and the contribution of myxotrophic taxa to total autotrophic biomass. Freshwater Biology 20:51–60. Brown, J. S. 1996. Coevolution and community organization in three habitats. Oikos 75:193–206. Cavalier-Smith, T. 1998. A revised six-kingdom system of life. Biological Reviews of the Cambridge Philosophical Society 73:203– 266. Day, T. 2000. Competition and the effect of spatial resource heterogeneity on evolutionary diversification. American Naturalist 155: 790–803. Dieckmann, U. 1997. Can adaptive dynamics invade? Trends in Ecology & Evolution 12:128–131. Dieckmann, U., and R. Law. 1996. The dynamical theory of coevolution: a derivation from stochastic ecological processes. Journal of Mathematical Biology 34:579–612. Diehl, S. 2002. Phytoplankton, light, and nutrients in a gradient of mixing depths: theory. Ecology 83:386–398. Doebeli, M., and U. Dieckmann. 2003. Speciation along environmental gradients. Nature 421:259–264. Dolan, J. R., and M. T. Perez. 2000. Costs, benefits and characteristics of mixotrophy in marine oligotrichs. Freshwater Biology 45:227– 238. Ebert, U., M. Arrayas, N. M. Temme, B. P. Sommeijer, and J. Huisman. 2001. Critical conditions for phytoplankton blooms. Bulletin of Mathematical Biology 63:1095–1124. Falkowski, P. G., and A. D. Woodhead, eds. 1992. Primary produc-
Specialization of Mixotrophs tivity and biochemical cycles in the sea. Vol. 43. Environmental Science Research. Plenum, New York. Friesen, M. L., G. Saxer, M. Travisano, and M. Doebeli. 2004. Experimental evidence for sympatric ecological diversification due to frequency-dependent competition in Escherichia coli. Evolution 58:245–260. Fryxell, J. M. 1997. Evolutionary dynamics of habitat use. Evolutionary Ecology 11:687–701. Geritz, S. A. H., J. A. J. Metz, E´. Kisdi, and G. Mesze´na. 1997. Dynamics of adaptation and evolutionary branching. Physical Review Letters 78:2024–2027. Geritz, S. A. H., E´. Kisdi, G. Mesze´na, and J. A. J. Metz. 1998. Evolutionary singular strategies and the adaptive growth and branching of the evolutionary tree. Evolutionary Ecology 12:35– 57. Hall, S. R., M. A. Leibold, D. A. Lytle, and V. H. Smith. 2004. Stoichiometry and planktonic grazer composition over gradients of light, nutrients and predation risk. Ecology 85:2291–2301. Holen, D. A. 2000. The relative abundance of mixotrophic and heterotrophic ciliates in an oligotrophic lake. Archiv fu¨r Hydrobiologie 150:1–15. Huisman, J., and B. P. Sommeijer. 2002. Maximal sustainable sinking velocity of phytoplankton. Marine Ecology Progress Series 244:39– 48. Huisman, J., and F. J. Weissing. 1995. Competition for nutrients and light in a mixed water column: a theoretical analysis. American Naturalist 146:536–564. Huisman, J., P. Van Oostveen, and F. J. Weissing. 1999a. Critical depth and critical turbulence: two different mechanisms for the development of phytoplankton blooms. Limnology and Oceanography 44:1781–1787. ———. 1999b. Species dynamics in phytoplankton blooms: incomplete mixing and competition for light. American Naturalist 154: 46–68. Huisman, J., M. Arrayas, U. Ebert, and B. P. Sommeijer. 2002. How do sinking phytoplankton species manage to persist? American Naturalist 159:245–254. Kawabata, Z., K. Matsui, K. Okazaki, M. Nasu, N. Nakano, and T. Sugai. 1995. Synthesis of a species-defined microcosm with protozoa. Journal for Protozoology Research 5:23–26. Klausmeier, C. A., E. Litchman, T. Daufresne, and S. A. Levin. 2004. Optimal nitrogen-to-phosphorus stoichiometry of phytoplankton. Nature 429:171–174. Kooi, B. W., M. P. Boer, and S. A. L. M. Kooijman. 1998. On the use of the logistic equation in models of food chains. Bulletin of Mathematical Biology 60:231–246. Kooijman, S. A. L. M. 1998. The synthesizing unit as model for the stoichiometric fusion and branching of metabolic fluxes. Biophysical Chemistry 73:179–188. ———. 2000. Dynamic energy and mass budgets in biological systems. 2nd ed. Cambridge University Press, Cambridge. Kooijman, S. A. L. M., and R. Hengeveld. 2005. The symbiotic nature of metabolic evolution. Pages 159–202 in T. A. C. Reydon and L. Hemerik, eds. Current themes in theoretical biology: a Dutch perspective. Springer, Dordrecht.
E61
Kooijman, S. A. L. M., and R. M. Nisbet. 2000. How light and nutrients affect life in a closed bottle. Pages 19–60 in S. E. Jørgensen, ed. Thermodynamics and ecological modelling. CRC, Boca Raton, FL. Kooijman, S. A. L. M., H. A. Dijkstra, and B. W. Kooi. 2002. Lightinduced mass turnover in a mono-species community of mixotrophs. Journal of Theoretical Biology 214:233–254. Kooijman, S. A. L. M., T. Andersen, and B. W. Kooi. 2004. Dynamic energy budget representations of stoichiometric constraints on population dynamics. Ecology 85:1230–1243. Krivan, V., and E. Sirot. 2002. Habitat selection by two competing species in a two-habitat environment. American Naturalist 160: 214–234. Litchman, E. 1998. Population and community responses of phytoplankton to fluctuating light. Oecologia (Berlin) 117:247–257. Litchman, E., and C. A. Klausmeier. 2001. Competition of phytoplankton under fluctuating light. American Naturalist 157:170– 187. Mann, K. H., and J. R. N. Lazier. 1996. Dynamics of marine ecosystems: biological-physical interactions in the oceans. 2nd ed. Blackwell Science, Oxford. Margulis, L. 1993. Symbiosis in cell evolution. Freeman, New York. Metz, J. A. J., S. A. H. Geritz, G. Mesze´na, F. J. A. Jacobs, and J. S. van Heerwaarden. 1996. Adaptive dynamics: a geometrical study of the consequences of nearly faithful reproduction. Pages 183– 231 in S. J. van Strien and S. M. Verduyn Lunel, eds. Stochastic and spatial structures of dynamical systems. Elsevier, Amsterdam. Mizera, F., and G. Meszena. 2003. Spatial niche packing, character displacement and adaptive speciation along an environmental gradient. Evolutionary Ecology Research 5:363–382. Nygaard, K., and A. Tobiesen. 1993. Bacterivory in algae: a survival strategy during nutrient limitation. Limnology and Oceanography 38:273–279. Raven, J. A. 1997. Phagotrophy in phototrophs. Limnology and Oceanography 42:198–205. Ronce, O., and M. Kirkpatrick. 2001. When sources become sinks: migrational meltdown in heterogeneous habitats. Evolution 55: 1520–1531. Rozen, D. E., and R. E. Lenski. 2000. Long-term experimental evolution in Escherichia coli. VIII. Dynamics of a balanced polymorphism. American Naturalist 155:24–35. Thingstad, T. F., H. Havskum, K. Garde, and B. Riemann. 1996. On the strategy of “eating your competitor”: a mathematical analysis of algal mixotrophy. Ecology 77:2108–2118. Troost, T. A., B. W. Kooi, and S. A. L. M. Kooijman. 2005. When do mixotrophs specialize? adaptive dynamics theory applied to a dynamic energy budget model. Mathematical Biosciences 193:159– 182. Valiela, I. 1995. Marine ecological processes. 2nd ed. Springer, New York. Zajic, J. E., ed. 1970. Properties and products of algae. Plenum, New York. Associate Editor: Franz J. Weissing Editor: Jonathan B. Losos