stem S ervic es. Ecosystem. Services. In the Coastal Zone of the Nordic Countries ...... often contain diverse and structurally complex underwater forests that host a ... services appear to be free or cheap to utilize. ..... the food web and resilience.
People are dependent on the ocean and coasts and their resources for their survival and well-being. Coastal ecosystems of the Nordic countries, such as kelp forests, blue mussel beds, eelgrass meadows and shallow bays and inlets, provide a number of supporting, provisioning, regulating, and cultural ecosystem services to both the local communities as well as the wider population who benefit from them. The study has focused on examining these coastal values through selected examples, and recommend possible applications and relevance for the management of the Nordic coastal areas and their resources. The project has also identified key gaps in the knowledge and suggests where further work should be emphasized.
Ecosystem Services
Ecosystem Services
TemaNord 2016:552
Nordic Council of Ministers Ved Stranden 18 DK-1061 Copenhagen K www.norden.org
Ecosystem Services In the Coastal Zone of the Nordic Countries
Ecosystem Services In the Coastal Zone of the Nordic Countries Hege Gundersen, Tanya Bryan, Wenting Chen, Frithjof E. Moy, Antonia N. Sandman, Göran Sundblad, Susi Schneider, Jesper H. Andersen, Sindre Langaas and Mats G. Walday
TemaNord 2016:552
Ecosystem Services In the Coastal Zone of the Nordic Countries Hege Gundersen, Tanya Bryan, Wenting Chen, Frithjof E. Moy, Antonia N. Sandman, Göran Sundblad, Susi Schneider, Jesper H. Andersen, Sindre Langaas and Mats G. Walday ISBN 978-92-893-4747-1 (PRINT) ISBN 978-92-893-4748-8 (PDF) ISBN 978-92-893-4749-5 (EPUB) http://dx.doi.org/10.6027/TN2016-552 TemaNord 2016:552 ISSN 0908-6692 Standard: PDF/UA-1 ISO 14289-1 © Nordic Council of Ministers 2017 Layout: NMR Cover photo: Scanpix Print: Rosendahls-Schultz Grafisk Printed in Denmark
Although the Nordic Council of Ministers funded this publication, the contents do not necessarily reflect its views, policies or recommendations. Nordic co-operation Nordic co-operation is one of the world’s most extensive forms of regional collaboration, involving Denmark, Finland, Iceland, Norway, Sweden, the Faroe Islands, Greenland, and Åland. Nordic co-operation has firm traditions in politics, the economy, and culture. It plays an important role in European and international collaboration, and aims at creating a strong Nordic community in a strong Europe. Nordic co-operation seeks to safeguard Nordic and regional interests and principles in the global community. Shared Nordic values help the region solidify its position as one of the world’s most innovative and competitive.
Contents
Ecosystem Services .................................................................................................................. 5 In the Coastal Zone of the Nordic Countries ........................................................................ 5 Preface ......................................................................................................................................7 Terms and abbreviations .......................................................................................................... 9 Summary ................................................................................................................................ 11 Kelp forests ....................................................................................................................... 11 Eelgrass meadows .............................................................................................................12 Blue mussel beds ............................................................................................................... 13 Shallow bays and inlets ...................................................................................................... 15 1. Introduction ...................................................................................................................... 17 1.1 Background ............................................................................................................ 17 1.2 Aim and scope of the report ................................................................................... 20 1.3 Types of ecosystem services ...................................................................................21 1.4 Ecosystem valuation and ecosystem accounting .................................................... 25 2. The oceans and seas of the Nordic countries ..................................................................... 29 2.1 The North Sea and Skagerrak.................................................................................. 31 2.2 The Norway Sea and Barents Sea ............................................................................32 2.3 The Baltic Sea ......................................................................................................... 33 3. Ecosystem services of kelp forests ..................................................................................... 35 3.1 Distribution and physical requirements ................................................................... 35 3.2 Threats and challenges .......................................................................................... 36 3.3 Supporting services.................................................................................................41 3.4 Provisioning services ...............................................................................................43 3.5 Regulating services ................................................................................................ 45 3.6 Cultural services ..................................................................................................... 50 4. Ecosystem services of eelgrass meadows ........................................................................... 51 4.1 Distribution and physical requirements ................................................................... 51 4.2 Threats and challenges .......................................................................................... 54 4.3 Supporting services.................................................................................................55 4.4 Provisioning services .............................................................................................. 59 4.5 Regulating services .................................................................................................61 4.6 Cultural services ..................................................................................................... 63
5. Ecosystem services of blue mussel beds ............................................................................ 65 5.1 Distribution and physical requirements ................................................................... 65 5.2 Threats and challenges ........................................................................................... 67 5.3 Supporting services ................................................................................................ 68 5.4 Provisioning services .............................................................................................. 69 5.5 Regulating services................................................................................................. 73 5.6 Cultural services ..................................................................................................... 75 6. Ecosystem services of shallow bays and inlets ................................................................... 79 6.1 Distribution and physical requirements ................................................................... 79 6.2 Threats and challenges ........................................................................................... 82 6.3 Supporting services ................................................................................................ 83 6.4 Provisioning services .............................................................................................. 87 6.5 Regulating services................................................................................................. 88 6.6 Cultural services ..................................................................................................... 92 7. Discussion ......................................................................................................................... 95 7.1 Conclusions ............................................................................................................ 95 7.2 Knowledge gaps ..................................................................................................... 98 References ............................................................................................................................ 103 Norsk sammendrag............................................................................................................... 123 Tareskog ......................................................................................................................... 123 Ålegrasenger .................................................................................................................. 124 Blåskjellbanker................................................................................................................ 125 Grunne bukter og viker.................................................................................................... 126
Ecosystem Services
In the Coastal Zone of the Nordic Countries
Hege Gundersen (NIVA)
Tanya Bryan (GRID-Arendal)
Wenting Chen (NIVA)
Frithjof E. Moy (IMR)
Antonia N. Sandman (AquaBiota)
Göran Sundblad (AquaBiota)
Susi Schneider (NIVA)
Jesper H. Andersen (NIVA)
Sindre Langaas (NIVA)
Mats G. Walday (NIVA)
Preface
This report gives an overview of the values related to important ecosystems along the Nordic coasts. Four key systems were selected to be examined for their services. These were kelp forests, eelgrass meadows, blue mussel beds, and shallow bays and inlets. The report is based on the common knowledge and network of researchers across the Nordic countries and is conducted under the leadership of the Norwegian Institute for Water Re search (NIVA) in collaboration with the Institute of Marine Research (IMR), GRID-Arendal, NIVA Denmark Water Research, and the Swedish AquaBiota Water Research. The project is funded by the Nordic Council of Ministers (NCM) and is a collabora tion between The Environment and Economy Group (MEG), Marine Group (HAV) and Terrestrial Ecosystem Group (TEG). We hope this overview will support the further work in our countries to solve common challenges and to ensure an integrated marine man agement of the Nordic countries. October 2016 Fredrik Granath Chairman of the Working Group on Environment and Economy under the Nordic Coun cil of Ministers
Terms and abbreviations
Tabel 1: List of terms and abbreviations used in the report Baseline
The line consisting of segments between the outermost islands and reefs along the coast at low tide
Biotope
An area of uniform environmental conditions providing a living place for a specific assemblage of plants and animals
CBD
Convention on Biological Diversity (UN)
Coastal zone
All marine areas within one nautical mile outside the baseline
Cultural services
A category of Ecosystem Services, such as recreational, aesthetic, and spiritual benefits (MEA 2005)
Ecosystem
A dynamic complex of plant, animal, and microorganism communities and the non-living envi ronment interacting as a functional unit (UNEP 2006)
Ecosystem Services
The direct and indirect contributions from the ecosystems to human welfare (TEEB 2010). The benefits that people obtain from ecosystems (UNEP 2006)
EU
European Union
FAO
Food and Agriculture Organization of the United Nations (UN)
FGFRI
Finnish Game and Fisheries Research Institute
FTEs
Full-time Equivalents
Habitat
An ecological or environmental area that is inhabited by a particular species of animal, plant, or other type of organism
HAV
The Marine Group (working group of NCM)
HELCOM
Baltic Marine Environment Protection Commission – Helsinki Commission
HVMFS
(Swe: Havs- och vattenmyndighetens författningssamling)
IMR
Institute for Marine Research
IPBES
The Intergovernmental Platform on Biodiversity and Ecosystem Services
MEA
The Millennium Ecosystem Assessment
MEG
NCM Working Group on Environment and Economy
MR-M
NCM for Environment
Baseline
The line consisting of segments between the outermost islands and reefs along the coast at low tide
Natura 2000
A network of nature protection areas in the European Union. The network includes both terres trial and marine sites
NCM
The Nordic Council of Ministers
NIVA
Norwegian Institute for Water Research
NOK
Norwegian Krone (currency)
Provisioning services
A category of Ecosystem Services, such as food, water, timber, and fiber (MEA 2005)
Regulating services
A category of Ecosystem Services, such as climate, floods, disease, wastes, and water quality (MEA 2005)
SAV
Submerged aquatic vegetation
SDG
Sustainable Development Goals (UN)
SDM
Spatial Distribution Modeling
SEK
Swedish Krona (currency)
Supporting services
A category of Ecosystem Services, such as soil formation, photosynthesis, and nutrient cycling (MEA 2005)
SwAM
The Swedish Agency for Marine and Water Management
TEEB
The Economics of Ecosystems and Biodiversity
TEG
NCM Working Group on Terrestrial Ecosystem
UN
The United Nations
UNEP
The United Nations Environmental Programme
WFD
Water Framework Directive
10
Ecosystem Services
Summary
People are dependent on the ocean and coasts and their resources for their survival and well-being. Coastal ecosystems of the Nordic countries, such as kelp forests, blue mus sel beds, eelgrass meadows and shallow bays and inlets, provide a number of support ing, provisioning, regulating and cultural ecosystem services to both the local commu nities as well as the wider population who benefit from them. These are high biodiversity ecosystems with numerous species of flora and fauna. They act as important nursery habitats for several species of fish, shellfish and plants, including commercial species. They are also an important part in a number of system processes including water purification, coastal erosion protection and carbon fixation, to mention a few. Further, the coastal zone is important as a recreational area for swim ming and fishing and there is a large potential for new applications such as biofuel pro duction and increased production of alginate. As a result, there are many interests and benefits related to these areas. Four key ecosystems have been selected to be examined in this report. These are kelp forests, eelgrass meadows, blue mussel beds and shallow bays and inlets. For kelp forest and mussels, the economic potential of cultivation is also considered. The study has focused on examining these coastal values through selected exam ples, and recommend possible applications for the management of the Nordic coastal areas and their resources. The study also identifies key knowledge gaps and suggests where further work should be emphasized.
Kelp forests The three dimensional structure of the kelp forest provides habitat, nursery ground and food for a myriad of mobile pelagic and benthic organisms. Kelp plants are photosyn thetic organisms and therefore hugely important as primary producers, and regarded among the most productive systems on earth. The production of particulate organic material throughout the year enhances secondary production also in other surrounding communities. The structure of the forest implies high resilience to disturbances and bi ological control against potential pests and invasive species.
Kelp has a long tradition of being used as fertilizer, and there is a growing interest for human foods based on algae and seaweed, and for hundreds of different products made from kelp alginate. There is also an increasing demand for non-fossil energy which has made kelp interesting as biofuel. Norway is said to be capable of cultivating 20 million tons of kelp with an annual added value of 40 billion NOK. Since kelp forests are assumed to be crucial habitats for many economic important fish species, the value creation from fishery and other sea food is high. Fish are believed to depend on this habitat for spawning, hatching, nursing and grazing. Kelp forests are remarkably resilient to natural disturbances such as wave impacts, storm surges, and other extreme oceanographic events and this service is essential for the safeguarding of ecosystem functions. Being primary producers, kelp use solar en ergy to convert inorganic material to organic matter through photosynthesis and there fore affect the biochemical cycles and regulate the global climate by using CO2. The kelp plants act as reserves or sinks for CO2 as long as they are alive and through the disposal of dead organic plant material into the sediments. However, the proportion of dead kelp material stored for the future is still an unanswered question. Eutrophication mitigation is mediated by kelp forests and reduces the threats of algal blooms, hypoxia, etc., thus contributing to the improvement of water quality, which is, in terms of trans parency, believed to infer great benefits for the production of food and to all aspects of ecosystem diversity and function. Many studies are also supporting bioremediation and integrated aquaculture practices that utilize seaweeds as biofilters in multitrophic farming operations. Coastal defense, such as erosion prevention, represents a critical ecosystem service provided by the kelp forest and will be increasingly important along many coastlines as the consequences of anthropogenic climate change intensifies. Certain ecosystem services related to tourism can be directly associated with kelp forest, such as scuba diving, whereby people actually enjoy watching a healthy kelp for est with its associated biodiversity. But there is also a strong indirect connection via for instance the role of kelp in eutrophication mitigation, since swimming and other activ ities will be experienced more positively in clean water. Also, recreational fishing in ma rine waters is a big industry and is related to kelp through the importance of kelp forests as fish habitats.
Eelgrass meadows Eelgrass meadows provide habitat for a wide range of species due to the three dimen sional structure it creates on shallow soft bottoms. They provide suitable substratum for a rich epifauna and flora which also in turn support diverse fish communities finding
12
Ecosystem Services
shelter and food. This ecosystem is considered the most productive of shallow, sedi mentary environments and has a high production, building up both above- and below ground biomass during growth season. By high primary production, nutrient cycling, and by providing a three dimensional structure, eelgrass in many ways provide biologi cal control. Growth of many marine bacterial species is inhibited by water-soluble ex tracts of eelgrass leaves, and by that eelgrass is altering the activity of microorganisms. Today, eelgrass harvesting is of no value, but eelgrass has for centuries been used as building material for houses, as cattle feed and soil amendment. No medicinal use is known for eelgrass, but it may be a good resource for screening natural antibiotics due to its slow decay rates. No commercial or subsistence fishery is conducted in eelgrassmeadows today, but eelgrass is still essential for commercial fisheries through its role as key habitats for juvenile cod and other commercial species. Seagrass and other eelgrass meadows are natural hot spots for carbon sequestra tion and have a high ability to produce, trap, and store organic compounds, making them important carbon sinks. Due to nutrient cycling and storage, eelgrass minimize the efflux of ammonia and phosphate to the water column, clean the water and miti gate eutrophication, and possibly reduce growth of opportunistic macroalgae and phy toplankton. Eelgrass may play an important role in biogeochemical cycling of heavy metals. Uptake of nutrients by eelgrass and other submerged aquatic vegetation can help to prevent nuisance algal blooms and can improve water clarity. The eelgrass leaf canopy and the network of rhizomes and roots fix and stabilize the sediment and reduce resuspension of sediment by currents and waves. Ecosystem services provided by eelgrass meadows, like high biodiversity and shel ter and feeding ground for many species, implies that the eelgrass meadows are popu lar fishing sites for recreational fishing. Eelgrass meadows play a role in tourism by cleaning the water, through eutrophication mitigation and coastal defense, and by boosting the biodiversity on sandy beaches and create good sites for bathing and rec reational fishing.
Blue mussel beds The blue mussel is one of our most common marine species and an important habitat builder. Blue mussels increase biodiversity by providing substrate for algae and refuge for small animals. Constituting 70% of the coastal biomass in the Baltic, blue mussels contrib ute greatly to ecosystem structure and function. By filtering phytoplankton, including toxic algae, filter feeders like blue mussels can inhibit or even prevent harmful blooms and also its influence on biological control can be attributed to their filtering abilities.
Ecosystem Services
13
Traditionally, blue mussels have been more important as bait than for direct human consumption. However, the mussels are a good source of iron, selenium and vitamin B12. They have small but healthy fats, with a large proportion of omega-3 fatty acids. Investigations are in progress to ascertain whether mussels can be used to filter out nu trients at sewage works. Further, blue mussels are also being explored for possible ben efits through marine bioprospecting; researchers have developed a glue which can stop bleeding wounds in less than 60 seconds. The commercial blue mussel fishing industry is not as big as its aquaculture, but fishermen in the Limfjord in Denmark have for sev eral decades harvested blue mussels for food production, and up to 100 000 tons are scraped up from the sea floor each year. Being an important habitat builder for many other species of algae and fauna, blue mussel beds have relatively high biodiversity, and are thus quite resilient to disturb ances. The role of blue mussels in carbon storage is assumed to be connected to the amount of carbon stored in blue mussel banks. The amount of released carbon from the decomposed mussel that are actually sequestrated for the future, however, is believed to be minimal. As phytoplankton feeders, mussels play a key role in the ecosystem, par ticularly in light of ongoing eutrophication from human activities. Mussels can help to counteract eutrophication by being harvested and used as food, animal feed and ferti lizer. Perhaps the most important service of blue mussels, in addition to reducing eu trophication, is its ability to take up, and thereby remove, organic pollutants and toxic substances. Through its filter feeding habits, blue mussels can reduce the amount of phytoplankton and cyanobacteria in the water column and thus contribute to water pu rification, filtering and removing of hazardous substances. Mussels can store relatively large amounts of toxins without themselves being affected. Being long-lived, this stor age helps preventing the toxic substance from ending up in far more sensitive organ isms. Mussel beds can influence tidal flow and wave action within estuaries, modify pat terns of sediment deposition, consolidation and stabilization and are thus potentially useful for coastal protection. The pleasure and recreative value of blue mussel picking, and the enjoyment of gathering your own food, are an important cultural ecosystem service in many coastal communities. Blue mussel beds can also be an attractive view for divers and snorkelers, and help maintaining water quality fit for swimming and beaching.
14
Ecosystem Services
Shallow bays and inlets A multitude of ecosystem services are provided by the flora and fauna of shallow, wave sheltered bays and inlets in the northern Baltic Sea. Shallow bays and inlets are charac terized by rich vegetation communities, including submerged rooted plants and charo phytes (early relatives to modern land plants often given high conservation values), as well as algae on the occasional hard substrate, and grasses along the shoreline. These systems often contain diverse and structurally complex underwater forests that host a range of other organisms. The most important ecosystem services include their sup porting role for biodiversity, habitat provision and maintaining food webs. These eco systems serve as essential habitat for several species of fish, including perch, pike and cyprinids such as roach, by providing habitat and food during the most sensitive earliest life-stages. The service of top down control exerted by large predatory fish can through trophic cascades prevent eutrophication symptoms of the system. The primary produc tion of plants and benthic macro- and microalgae in these systems is high, contributing substantially to the total primary production of the Bothnian Bay. Charophytes can effectively remove organic chemicals and metals from the water. They mitigate cyanobacterial blooms in surface waters, reduce the viability of certain pathogen microalgae, as well as reduce the development of benthic biofilms. Both commercial and subsistence fisheries are dependent on recruitment of the target spe cies, and perch, pike, roach, rudd, tench, breams, and other cyprinids benefit from the generally warmer temperatures of shallow bays and inlets. Several studies have measured carbon uptake and storage for particular species and areas of wave sheltered bays and inlets in the Baltic Sea, which taken together in dicate their potential importance for carbon sequestration. Phosphorus can be re moved via assimilation by submerged aquatic plants and in wetlands and via many other mechanisms. Sedimentation in vegetated patches can reduce the risk of resus pension, increase water visibility, as well as bind nutrients in the sediments, thereby reducing eutrophication. Although not well documented, it is assumed that many of the submerged rooted plants of the bays and inlets will have sediment stabilizing ef fects, since all structures dampening wave and current energy favor sediment retention and coastal protection. Fish species recruited in shallow, wave sheltered bays and inlets are highly valued in the Baltic countries, and the contribution of these habitats to the amount of expend itures of recreational fishing is potentially large. Due to their sheltered character, bays and inlets are popular for boating, swimming, kayaking and other activities which are dependent on healthy ecosystems providing regulating services such as water filtering and eutrophication mitigation.
Ecosystem Services
15
1. Introduction
1.1
Background
Marine and coastal biotopes are among the most productive ecosystems on earth and provide a range of social and economic benefits to humans. As much as one third of the world’s population lives in coastal areas, which covers only 4% of the Earth’s total land area. In 2013, 135 million tons of shellfish, seafood and aquatic plants were harvested from the ocean for food and industrial application (FAO 2015), comprising 16% of the global population’s animal protein intake (FAO 2014). Worldwide, nearly 200 million full-time equivalent jobs are found in marine fisheries alone, accounting for about one in every fifteen people employed on the planet (Teh and Sumaila 2013). Furthermore, coastal tourism is one of the fastest growing sectors of global tourism and provides di rect and indirect employment for many people and generates local incomes. The Millennium Ecosystem Assessment (MEA) evaluated in 2005 the services pro vided by ecosystems, and how changes in these services will impact upon human wellbeing (MEA 2005). The United Nations Environmental Programme (UNEP 2006) gives a synthesis of the results concerning the marine and coastal ecosystems. The two re ports provide an analysis of the ecosystem services at global and sub-global (local or regional) scales in terms of current conditions and trends, plausible future scenarios, and possible responses for sustainable resource use. Another important initiative is “The Economics of Ecosystems and Biodiversity” (TEEB), which was founded in 2007 by leaders of the G8 countries. TEEB aims to get a better understanding of “the true economic value of the benefits we receive from na ture” (TEEB 2010). Several countries in Europe, such as Germany, the Netherlands and Poland have initiated national TEEB studies, and Nordic countries (Finland, Sweden, Norway, Denmark and Iceland) have published a synthesis on the socio-economic role and significance of biodiversity and ecosystem services (TEEB Nordic, Kettunen et al. 2012) in addition to official reports in Norway (NOU 2013:10), Sweden (SOU 2013:68), and Finland (Jäppinen and Heliölä 2015). Within the Norwegian TEEB report, the Commission was asked to describe the con sequences for society of the degradation of ecosystem services, to identify how rele
vant knowledge can best be communicated to decision-makers, and to make recom mendations about how greater consideration can be given to ecosystem services in pri vate and public decision making. The findings of this report indicated that:
Our huge consumption of ecosystem services is largely due to the fact that the services appear to be free or cheap to utilize. The fact that natural capital is scarce and the loss of nature comes at a cost is often not taken into consideration when decisions about production and con sumption are made. The Nordic countries should attempt to better demonstrate these values in de cision-making processes. These values must be better communicated to both the general public as well as decision-makers at all government levels and be included in policy instru ments, regulations and incentives.
These conclusions indicate that an ecosystem services approach is a helpful addition to current environmental and resource management practices as it helps to demonstrate how protecting nature is important to our well-being. The TEEB Nordic report looks at the region more generally. While they have a section on marine and freshwater fisher ies, the report also acknowledges that there is a large knowledge gap around marine ecosystem services, beyond fisheries. On a global scale, all of the Nordic countries, but in particular Norway, have com mitted to working to achieve a number of international targets, including meeting Aichi targets and the UN Sustainable Development Goals (SDG), which can benefit from us ing an ecosystem service approach. Aichi Target 2 states that “[b]y 2020, at the latest, biodiversity values have been integrated into national and local development and pov erty reduction strategies and planning processes and are being incorporated into na tional accounting, as appropriate, and reporting systems”, while SDG 14 calls for the conservation and sustainable use of the oceans, seas and marine resources for sustain able development and provides a comprehensive framework for moving towards sus tainable ocean use. By including ecosystem services in these global policy frameworks, these countries have the opportunity to provide leadership and guidance on how to strengthen local and national level policy and planning frameworks through the holistic integration of ecosystem services into these processes. The intensive use of the oceans has led to considerable pressure on marine re sources and marine environment, resulting in an urgent need for sustainable coastal management which must be based on knowledge of the ecosystem and the conse
18
Ecosystem Services
quences of different uses (Meld. St. 37, 2012–2013, HELCOM 2007). There is also an un derstanding within the Nordic countries that marine areas should be managed through ecosystem-based and multi-sectoral policies, with integrated management plans as important tools. For Norway, see Meld. St. 8 (2005–2006), Meld. St. 10 (2010–2011), Meld. St. 37 (2012–2013), von Quillfeldt et al. 2009 and HELCOM 2007, for Sweden, see e.g. SFS 2010:1341, SFS 2012:373, HVMFS 2012:18. The objective of the management plans is to facilitate the sustainable use of resources and ecosystem services in the wa ters while maintaining the structure, functioning, productivity and biodiversity. The management plans are thus a tool for promoting economic development and food se curity within a sustainable framework and ensure good environmental status. The different ecosystems of the Nordic coasts together contribute to a long range of important services for the benefit of humans. They are highly productive ecosystems that purify the water (c.f. Kautsky 1981, Dame and Prins 1998, Kufel and Kufel 2002, Kovtun-Kante et al. 2014, Rodrigo et al. 2014), protect against erosion and storm surges (c.f. Brix 1997, Madsen et al. 2001, Horppila and Nurminen 2003, Rönnbäck et al. 2007, Costanza et al. 2014), fuel marine food webs through the capture, storage and export of carbon (Dayton 1985, Krumhansl and Scheibling 2012), as well as being important nursery grounds for many species, including commercial fish species (Norderhaug et al. 2005). Some of the ecosystems are also proved to be major contributors to carbon stor age and sequestration (Nellemann et al. 2009). Traditionally, the resources associated with these ecosystems have been used for direct exploitation (e.g. blue mussels, sea weeds and macroalgae) as food and animal feed. More recently, new applications such as the production of alginate and biofuel are becoming increasingly profitable. This re port gives an overview of ecosystem services from coastal areas of the Nordic countries, with examples from kelp forests, seagrass meadows, blue mussel beds and shallow bays and inlets. Some recent reports have been reviewed to compile the results of this report. The most essential ones to help define marine ecosystem services have been the MEA (2005), UNEP (2006), in addition to the management plans for the different sea areas, already mentioned. Especially, some recent reports summarizing the ecosystem ser vices in the oceans and seas of the Nordic countries have been very informative. These are treating the marine ecosystems of the North Sea and Skagerrak (Ottersen et al. 2010, Magnussen et al. 2102), the Swedish seas (Naturvårdsverket 2008, Bryhn et al. 2015, Naturvårdsverket 2015, Hasler et al. 2016). Many of these reports also describe the non-coastal zone, i.e. sea areas outside the baseline. When it comes to evaluating the ecosystems in monetary values, the BalticSTERN (2013) have been particularly use ful, in addition to e.g. Gren et al. (2000) and Naturvårdsverket (2015).
Ecosystem Services
19
1.2
Aim and scope of the report
Ecosystem services are one of the main priorities of the Nordic Environmental Action Pro gramme for 2013–2018. The work on ecosystem services is embedded in the Convention on Biological Diversity, as one of the strategic objectives for the work forward in 2020. This report is the result of a project financed by the working groups on Environment and Economy (MEG), Coastal Environments (HAV) and Terrestrial Ecosystem (TEG) of the Nordic Council of Ministers (NCM). Collaborators have been the Norwegian Insti tute for Water Research (NIVA), the Institute of Marine Research (IMR), GRID-Arendal and AquaBiota Water Research. The report aims to give an overview of the available information on the benefits and values of ecosystem services in the coastal zone of the Nordic countries, through illustrations and selected examples. Also, the possible uses and relevance for the man agement of these areas, resources, important knowledge gaps, and recommendations for further work are emphasized. The assessment of ecosystems in the coastal zone and the services they provide is a very broad subject. The task has therefore been restricted to a few selected shallowwater ecosystems, all of which have great importance for the condition and manage ment of key ecological functions in the Nordic countries. The four selected ecosystems are 1) kelp forests, 2) eelgrass meadows, 3) blue mussel beds, and 4) shallow bays and inlets, which together cover large parts of the Nordic countries’ coastal areas. Geographically, the assessment includes the following Nordic countries: Denmark, Finland, Norway, Sweden, Aland, Estonia, Latvia, and Lithuania. The team expertise has in particular been strong on the coastal ecosystems surrounding Norway, Sweden, Finland and Denmark (including the north-western Baltic Sea, Bottenvika, Kattegat, Skagerrak, North Sea, Norwegian Sea and Barents Sea) – and the valuation of these. For an assessment of the other areas (e.g. the south-eastern Baltic, the Faroe Islands and Iceland), we have used available literature and relevant contacts and networks. The coastal zone has been defined as all marine areas within one nautical mile out side the baseline, which consists of line segments between the outermost islands and reefs along the coast at low tide. Thus, ecosystem services related to fisheries (except those related to nursing grounds for fish and recreational fishing), petroleum industry, and shipping are kept out of this evaluation. This report attempts to cover all services provided by the selected ecosystems of the coastal zone of the Nordic countries. However, greater emphasis has been placed on recreational (coastal) fishing, carbon capture and storage, and the ecosystems’ role in buffering against ocean acidification and eutrophication. For blue mussels and kelp
20
Ecosystem Services
forests, we have also looked at the commercial and ecological values from their culti vation – both at present and the future, unexploited potential. Trends, future scenarios, and management issues, are regarded as beyond the scope of the project, and covered only in a limited extent in the report. But these as pects are often covered in more detail within the management plans for specific areas, such as Skagerrak and the North Sea (Meld. St. 37, 2012–2013, Ottersen et al. 2010), the Norwegian Sea (Meld. St. 37, 2008–2009), the Barents Sea (Meld. St. 8, 2005–2006, Meld. St. 10, 2010–2011, Meld. St. 20, 2014–2015), the Baltic Sea (HELCOM 2007), and the Baltic Sea and Skagerrak (HVMFS 2012:18). The report is organized with an introduction (Chapter 1) and a description of each of the main oceans and seas of the Nordic countries (Chapter 2). Then come four sepa rate chapters for the selected ecosystems (Chapter 3–6), each including sub-chapters for each ecosystem service type. Finally, the last chapter gives a conclusion and points at some existing knowledge gaps (Chapter 7).
1.3
Types of ecosystem services
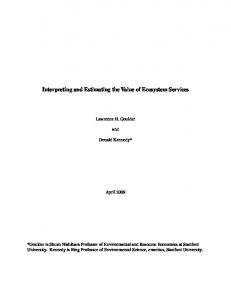
Our welfare and quality of life depends on a variety of environmental goods and ser vices – ecosystem services (Figure 1). These consist partly of a number of visible and well-known goods and services such as fish and shellfish, recreation and tourism, but also lesser-known services such as maintaining the stability of ecosystems, genetic re sources and atmospheric regulation. Most of these goods and services are public goods that are not currently traded on the market, and therefore they have no traditional mar ket value. This means that, currently, the cost of destroying such services does not ap pear on any accounting forms. As a result, these services are undervalued and put at risk to be impoverished. Ecosystem services are defined as the direct and indirect contribution from ecosys tems to human welfare (TEEB 2010). Ecosystem services are also referred to as natural goods, i.e. goods that humans are dependent on (e.g. NOU 2013). The different ways humans benefit from ecosystems have been divided into four main groups of ecosys tem services according to The Millennium Ecosystem Assessment (MEA 2005): 1) sup porting, such as soil formation, photosynthesis, and nutrient cycling, 2) provisioning, such as food, water, timber, and fiber; 3) regulating, that affect climate, floods, disease, wastes, and water quality; and 4) cultural services, that provide recreational, aesthetic, and spiritual benefits. The conceptual framework of ecosystem services and their con stituents of well-being are reproduced in Figure 1.
Ecosystem Services
21
Figure 1: The conceptual framework of ecosystem services and their linkages to the constituents of well-being, as presented by the Millennium Ecosystem Assessment (MEA 2005)
Source: MEA 2005, Figure A.
1.3.1
Supporting ecosystem services
Supporting ecosystem services are fundamental to virtually all other ecosystem services, and the safeguarding of these ecosystem services is crucial for future human welfare. The supporting ecosystem services include services such as maintenance of geochemical cy cles, primary production and maintenance of biodiversity, habitats and resilience. These supporting benefits are perhaps the most important of all features and ser vices in the ocean. They constitute the very basis of e.g. continuous fishery and recrea tion, which we usually associate with services from the ocean. In ecosystem accounting, these services are valued and appreciated indirectly through looking at what is the change in value of producing or cultural services if the basic supportive services some how are disturbed. Such values represent primarily the value of the supportive services in that they are the foundation for other services.
22
Ecosystem Services
Important supporting ecosystem services typically include habitat provision, nutrient cycling, primary productivity, and photosynthesis. Coastal ecosystems such as seagrass beds are important nursery areas for the young stages of fishes and invertebrates that support coastal communities and commercial and recreational fisheries. Maintaining the basic biostructures, i.e. the supportive services, such as maintaining biodiversity may also be said to have a value in itself and in an economists’ terms will be part of what is called non-use values. In addition to having a value in itself, biodiversity is a fundamental aspect that un derpins all ecosystem processes and should be valued in its own right (Cardinale et al. 2012, Mace et al. 2012, Naeem et al. 2012). Biodiversity also has an important role in the provision of ecosystem services and can be summarized as the supporting roles of biodiversity including the underpinning of ecosystems through structural, composi tional, and functional diversity; regulatory roles through the influence of biodiversity on the production, stability, and resilience of ecosystems; cultural roles from the nonma terial benefits people derive from the aesthetic, spiritual, and recreational elements of biodiversity; and provisioning roles from the direct and indirect supply of food, fresh water, fiber, etc. (from MEA 2005). Biodiversity is usually referred to as the composition of the number of species and individuals of each species in a given area. However, biological diversity also refers to the variety of life on other levels, such as functional groups and variation at the genetic level and may represent all kinds of variety, quantity, quality or distribution; with func tional diversity signifying the variability among ecological functional processes within an ecosystem. This aspect of biodiversity is particularly important for maintenance of the food web and resilience. Variation at the genetic level could mean any material of plant, animal, microbial, or other origin may contain functional units of heredity. The Intergovernmental Platform on Biodiversity and Ecosystem Services (IPBES), established in 2012, is dedicated to assessing the state of the planet’s biodiversity, its ecosystems and the essential services they provide to society. It provides a mechanism recognized by both scientific and policy communities to synthesize, review, assess and critically evaluate relevant information and knowledge. In Norway and the Baltic coun tries, biodiversity is acknowledged through the recent white paper and action plan on biodiversity (Meld. St. 14, 2015–2016) and the HELCOM Baltic Sea Action Plan (HEL COM 2007).
Ecosystem Services
23
1.3.2
Provisioning ecosystem services
Provisioning ecosystem services represent the best known and most visible benefits and services, such as food, fuel wood, energy resources, natural products, and orna mental resources. Other producing goods and services are so-called future use values (option value). These include genetic resources and resources for pharmaceutical, chemical and biotechnology industries. In the Nordic coastal zone, provisioning ser vices typically include sea food such as fish, mussels and crustaceans, and industrial raw material e.g. alginate extracted from kelp. Ocean energy supplies, such as wave and tidal energy, also represent major potential values.
1.3.3
Regulating ecosystem services
The regulatory services include services such as climatic and atmospheric regulation, reduction of eutrophication, regulation of harmful substances, biological control and retention of sediments. Climate change and associated changes in temperature can af fect almost any other ecosystem services. Therefore, the ocean’s ability to regulate cli mate, through its’ ability to bind the greenhouse gas CO2, is a very important feature. Regulating services also include shoreline stabilization, flood prevention, storm protec tion, climate regulation, nutrient regulation, detoxification of polluted waters, and waste disposal. Within the Nordic countries, shallow bays and inlets (also called coastal lagoons) typically improve water quality by capturing and filtering sediments and organic wastes in transit from inland regions to the ocean, whereas blue mussels and other bivalves are important for the sea’s ability to take up pollutants. Also, eelgrass and macroalgae, such as kelp, play an important role in both fixation of atmospheric carbon and its dep osition in deep water and absorbing the nutrients in the seawater.
1.3.4
Cultural ecosystem services
The traditions and cultures of many coastal societies are closely connected to the ma rine ecosystems on which they depend. Tourism is one example of an ecosystem ser vice with use value. Globally, coastal tourism is a fast-growing industry, and plays an important role in the local economy for coastal communities. Coastal and marine areas provide opportunities for activities such as boating, kayaking, diving, swimming, whale watching and recreational fishery. These activities also improve overall mental and physical health for the locals and tourists. Recreational values are high across all the Nordic countries, from the Barents Sea in the north to the
24
Ecosystem Services
Skagerrak and Baltic in the south. Whale watching, fjord cruising and coastal seabird watching have contributed large income to both local and national economy. The Norwegian Management Plan for the North Sea and Skagerrak states that ac cess to the sea and experiences related to boating and cottage life, swimming and fish ing are important for a large part of the population and the basis for the tourism indus try. Good experiences on the coast also have a close relationship with a clean, rich and productive marine environment (Meld. St. 37, 2012–2013). The white papers also pro vide numbers and estimates related to tourism and recreation in Norway (Meld. St. 37, 2012–2013, Meld. St. 37, 2008–2009). In Sweden, the national environmental objectives number 7 (Zero eutrophication), 10 (A Balanced Marine Environment, Flourishing Coastal Areas and Archipelagos) and 16 (A Rich Diversity of Plant and Animal Life) states that “Nutrient levels in soil and water must not be such that they adversely affect […] the possibility of varied use of land and water”; “[The coasts of] the North Sea and the Baltic Sea […] must be characterized by a high degree of biological diversity and a wealth of recreational, natural and cultural assets.”; “Biological diversity must be pre served and used sustainably for the benefit of present and future generations. […] Peo ple must have access to a good natural and cultural environment rich in biological di versity, as a basis for health”. Ecosystem services with non-use values are for instance cultural goods and ser vices, such as aesthetic and spiritual values, cultural heritage and identity, which are also extremely important to local communities along the Nordic coastal zone. These benefits have proven to make up a significant part of people’s willingness to pay for environmental goods and services.
1.4
Ecosystem valuation and ecosystem accounting
The ecosystem services approach has received considerable attention in international negotiations where the aim is to get agreements so that the earth is preserved in such a state that enables it to produce what people need in the future. This turns the per spective from appreciating biodiversity for its own sake, to incorporating human needs. The underlying idea is that biodiversity is preserved when assuring that nature’s pro duction capacity is maintained.
Ecosystem Services
25
1.4.1
Ecosystem valuation
The Economics of Ecosystems and Biodiversity (TEEB) was founded in 2007 by leaders of the G8 countries aiming to get a better understanding of the true economic value of the benefits we receive from nature (TEEB 2010). The 2010 report describes how eco system services have great importance for economy and well-fare. It also shows that if we do not react quickly, the current reduction of biodiversity and the related loss of ecosystem services will continue, and in some cases, accelerate. Ecosystem values can be estimated and expressed in both monetary and non-mon etary terms (UNEP-WCMC 2011). Economic valuation can be a useful method to meas ure the contribution of ecosystem services to our quality of life and welfare, and to im prove our understanding of what you win and lose by using the ecosystems differently. Even with the limitations that exist, this type of valuation is important to show some of the major economic values associated with such goods and services – and the heavy losses that occur when ecosystems deteriorate (TEEB 2010). However, not all values associated with, for instance biodiversity, can be valued in monetary terms (TEEB 2010). For example, nature has an intrinsic value that is inde pendent of the use or enjoyment people have of it. Among all the different ecosystem services, we are only able to appreciate a few of them in monetary terms. There is a fast growing literature on marine ecosystem valuation. For example, UNEP-WCMC (2011) describes the valuation methods and application suitable for marine and coastal eco system services. Beaudoin and Pendleton (2012) highlight areas of ocean and coastal management for which a better understanding of the economic value of marine eco system services could improve the critical marine resources management and thus im prove ocean governance. In line with requirements from EU marine initiatives and di rectives (MSFD), Koundouri et al. (2016) describe a tool for assessing the impacts on ecosystem and ecosystem services of offshore investments to support the require ments for sustainable management of the oceans and blue growth. The tool incorpo rates the technical and legal requirements, the environmental impact assessment for ecosystem change, the market and non-market valuation of change in marine ecosys tem services change and the social welfare change. Other relevant valuation studies including both use-value and non-use value related to marine ecosystem service valua tion can be found in Chen et al. (2014).
1.4.2
Ecosystem accounting
Ecosystem accounting is a coherent and integrated approach to the assessment of the environment through the measurement of ecosystems, and measurement of the flows of services from ecosystems into economic and other human activity (UN SEEA 2014).
26
Ecosystem Services
The approach goes beyond ecosystem analysis by linking the ecosystems to economic and other human activity. Ecosystem accounting as presented in the UN SEEA (2014) includes the contribution of ecosystems to standard measures of economic activity, such as gross domestic product (GDP) and national income as well as the assessment of ecosystem services that are commonly unpriced and not considered in national-level economic reporting and analysis (UN SEEA 2014). Ecosystem accounting assesses both expected ecosystem service flows and changes in ecosystem assets. Ecosystem assets are assessed in both physical and monetary terms. Mazza et al. (2013) evaluated the strengths and weaknesses of some of the most prominent international approaches to natural capital accounting in the light of the pol icy goals, conditions and institutions in the Nordic countries. The report reviews ap proaches that were developed for incorporation of biodiversity and ecosystems in na tional accounts.
Ecosystem Services
27
2. The oceans and seas of the Nordic countries
The oceans and seas of the Nordic countries are all part of the North-eastern Atlantic Ocean, and consist of the Barents Sea, Norwegian Sea, North Sea, Skagerrak (including Kattegat), Baltic Sea (including Bothnian Bay and Baltic Proper), Iceland Sea, Green land Sea, and the Arctic Ocean (Figure 2). The four focal ecosystems of this study are naturally not equally distributed among the Nordic countries, with kelp forests gener ally much more common in the more exposed and saline areas of the Norwegian Sea, North Sea and Skagerrak, whereas shallow bays and inlets are more frequently seen in the Baltic Sea. Blue mussels and sea grasses are found in all regions, given their envi ronmental requirements (more detailed descriptions of the distributions are given in the each of the ecosystem chapters).
Figure 2: Map of the Nordic countries and their surrounding oceans and countries
Source: ESRI.
30
Ecosystem Services
The coastal areas, which extend up to one nautical mile outside the baseline, house rich ecosystems, both at the bottom and in the water column above – the pelagic. Inputs of nutrients from land, the shallow areas that receive light from the sun, and the stirring of water layers in different seasons are conditions that make the coast highly produc tive compared to the deeper waters further out. The bloom of phytoplankton in the spring provides large quantities of food for small unicellular and multicellular organ isms, including ciliates and copepods. These in turn are eaten by predators such as zo oplankton, fish and jellyfish, but also by polychaetas, clams and other animals that live on the sea floor. Kelp and seaweed grow on hard substrate, forming marine forests that dominate the part of the seabed that receives sunlight. These forests provide food, breeding- and feeding places for a myriad of other species of algae, large and small crustaceans, snails and fish. Mollusks, crustaceans and polychaetas hide in the vegeta tion and are food for fish both inside and outside the kelp forest. Many fish species live their entire lives on the coast, while others come to the coast to eat or spawn. The great access to food forms the basis for life of rich populations of seabirds, seals and whales along the coast, and these populations are completely dependent on the coastal eco system in order to survive.
2.1
The North Sea and Skagerrak
The North Sea and Skagerrak region is one of Scandinavia’s most intensively exploited seas and is among the world’s busiest sailing areas. The use of the seas creates great values for the Norwegian and Swedish societies. The North Sea is particularly produc tive and supports extensive fishing, from small coastal fishing vessels to huge trawls, and at the same time Skagerrak is particularly important for small scale fisheries. Many different activities with several conflicting interests create challenges for the management. The main industrial activities in these waters are currently fisheries, ship ping and petroleum industry as well as tourism. The majority of the Norwegian oil and gas production takes place in the North Sea. Other industries include possible future offshore energy, marine bioprospecting and mineral exploration on the seabed (Meld. St. 37, 2012–2013, HVMFS 2012:19). Sea and coast has great importance for recreation, outdoor activities, and tourism in Scandinavia. The coastline is very attractive and widely used by Scandinavians and their tourists (Naturvårdsverket 2008). Coastal and marine environment is important for sport in that it provides adventure value, as it is a place to exercise activities, providing health effects, thus making it an important basis for local and national economic activity through
Ecosystem Services
31
the tourism industry. The total value added from the tourism industry in the counties bor dering the management area was NOK 25 billion in 2007 and SEK 18 billion in 2004 for Norway and Sweden, respectively (Meld. St. 37, 2012–2013, Falklind and Gustafsson 2006). In Norway, the core business in the seafood industry, i.e. fishing, hunting, farming, fish processing and wholesale level, resulted in a total contribution to gross domestic product of NOK 28 billion in 2010, a production value of 91.2 billion, employing 24,300 full-time equivalents (FTEs) (Meld. St. 37, 2012–2013). Marine organisms are believed to have properties that can be exploited to create the basis for various products and processes in a number of business areas. Marine bio prospecting is related to biodiversity (Naturvårdsverket 2008), and the North Sea and Skagerrak are considered to have good opportunities to compete internationally within this field. Other ecosystem services are for example marine degradation of harmful sub stances and organisms, maintaining the stability of the ecosystem and climate regulation. The fishery in the management plan area in the North Sea is exercised by Scandi navian and foreign fishing vessels, including EU vessels fishing on the allocated quotas in the Nordic countries’ economic zones as negotiated through the bilateral agree ments. In 2015, the proportion of Swedish catches in Skagerrak and Kattegat in relation to total Swedish catches was 15%, contributing to 46% of the total value of 805 million SEK (SwAM 2016). The proportion of catch value in the North Sea and Skagerrak in re lation to other Norwegian waters is on average 25%. For catches the figure is 23%.
2.2
The Norway Sea and Barents Sea
The Norwegian Sea has rich biodiversity and high biological production and there is a significant fishery throughout the year. In the Norwegian Sea, there are also significant petroleum deposits. The coastal areas are important transport routes. Also, the waters are important for tourism based on nature experiences and tourist fishing. Based on an overall assessment, environmental conditions in the Norwegian Sea are good (Meld. St. 37, 2008–2009). There are still significant challenges in the management of the Norwe gian Sea, especially related to the effects of climate change and ocean acidification, overexploitation of certain fish stocks, the risk of acute pollution, decline in seabird pop ulations and the need for conservation of coral areas. More on the importance of the Norway Sea to industries and society can be read in the Norwegian Management Plans (Meld. St. 37, 2008–2009, Meld. St. 8, 2005–2006, Meld. St. 20, 2014–2015).
32
Ecosystem Services
2.3
The Baltic Sea
The Baltic Sea is one of the world’s largest semi-enclosed bodies of brackish water. The catchment area is densely populated with intensive agriculture and industry. From an evolutionary perspective, the Baltic Sea is young, approximately 12,000 years and char acterized by relatively low species diversity. There is a gradient in species diversity and composition, following the south to north salinity gradient, with 20–40 times higher biomass of both flora and fauna in the Baltic proper compared to the Bothnian Bay (Jansson and Kautsky 1977, Kautsky 1988). The Baltic Sea provides many valuable services including transport, energy, food, mineral resources, recreational facilities and cultural heritage. Recreation, outdoor ac tivities and tourism in Scandinavian countries are greatly dependent on sea and coastal areas. Cruise tourism in the countries around the Baltic Sea give annual revenues of around EUR 443 million. Sales of leisure boats in Sweden were approximately EUR 265 million in 2006 (COWI 2007). In Finland, 28% of the population between the ages of 16 and 80 years took part in recreational fishing (FGFRI 2014). In Sweden, the correspond ing figure was 17%, with a related total expenditure of around EUR 670 M (SWaM 2012). The environmental status of the Baltic Sea is generally impaired. Eutrophication is a major concern in most areas of the Baltic Sea. A downside example is from the Swe dish island Öland, where algal blooms in 2005 caused losses in the tourism industry es timated at around EUR 27 million (Naturvårdsverket 2009). Despite significant reduc tions of the nutrient inputs over the past, the only coastal areas not affected are con fined to the Gulf of Bothnia (HELCOM 2010). Apart from eutrophication, pollution, in troduction of non-indigenous species and global sea warming can change the Baltic Sea ecosystem, potentially altering the distribution, biomass and abundance of species (Elmgren 1989, Gren et al. 2000, Rodhe and Winsor 2002, HELCOM 2003).
Ecosystem Services
33
3. Ecosystem services of kelp forests
3.1
Distribution and physical requirements
Figure 3: The five most common kelp species found in Nordic waters
Source: Illustration Per Arvid Åsen
Essentially there are five different species of kelp in the Nordic waters (Figure 3). These are Laminaria hyperborea, Laminaria digitata, Saccharina latissima, Alaria esculenta, and Saccorhiza polyschides. The species L. hyperborea and S. latissima are most important in terms of key habitat, spatial extent, biomass, and harvesting revenue, and are thus treated more thoroughly in this report than the three other kelp species. Kelp forests occur worldwide throughout temperate and polar coastal oceans (Fig ure 4). In the Nordic region kelp is found all along the Norwegian coast, as far west as Iceland and Greenland (except Saccorhiza polyschides) and east to the Swedish west coast (except Alaria esculenta and Saccorhiza polyschides). Based on studies on the dis tribution and regrowth of kelp forests (e.g. Norderhaug and Christie 2009), we have good knowledge about the habitat requirements of kelp. Generally we find kelp forests on shallow (down to about 25 m) hard bottom areas. L. hyperborea is found in relatively
wave-exposed areas (Bekkby et al. 2009); whereas S. latissima lives more sheltered (Bekkby and Moy 2011). The distribution of kelp forests in the coastal zones of the Barents Sea, Norwegian Sea, North Sea and Skagerrak have been mapped through the Norwegian Programme for mapping of marine nature types (Bekkby et al. 2013). Gundersen et al. predicted in 2011 the standing and potential distribution and biomass of L. hyperborea and S. latis sima for the whole coast of Norway. The standing distribution was 8,000 km2, whereas an additional area of 9,000 km2 were expected to regrow within some decades due to the effects of climatic changes on sea urchins recruitment (Box 1). Similar kelp mapping programs on the Swedish side of Skagerrak do not exist, but some inventories and mod elling studies show that there are extensive and well-grown kelp forests in some off shore banks between the coasts of Denmark and Sweden in this area (Naturvårdsverket 2010, 2012). Figure 4: Global distribution of kelp
Source: Maximilian Dörrbecker.
3.2
Threats and challenges
Smale et al. (2016) state that NE Atlantic kelp forest ecosystems are currently threat ened by a range of anthropogenic stressors that operate across multiple spatial scales (Smale et al. 2013, Mineur et al. 2015), including overfishing (Tegner and Dayton 2000, Ling et al. 2009, Moksnes et al. 2008, Korpinen et al. 2007, Östman et al. 2016), in creased temperature (Wernberg et al. 2011, 2013), storminess (Byrnes et al. 2011, Smale
36
Ecosystem Services
and Vance 2015), the spread of invasive species (Saunders and Metaxas 2008, Korpinen et al. 2007), elevated nutrient and sediment inputs (Gorgula and Connell 2004, Moy and Christie 2012), and turbidity (Pehlke and Bartsch 2008, Desmond et al. 2015). Anthro pogenic stressors can cause shifts from structurally diverse kelp forests to unstructured depauperate habitats characterized by mats of turf-forming algae and sea urchins (Ling et al. 2009, Moy and Christie 2012, Wernberg et al. 2013). Of all different stressors, the largest and most important threat to kelp forests in the Nordic countries has been the green sea urchin Strongylocentrotus droebachiensis which has turned large areas of kelp forests into barren grounds from the county of Møre and Romsdal and as far northeast as the Russian border within the last 45 years (Box 1). Also in Iceland the sea urchins have deforested extensive areas of kelp forests (Hjorleifsson et al. 1995). This phenomenon has been reported as an almost continuous overgrazed belt on inner and moderate wave exposed coasts. However, kelp forests are still dominating in the outer and more wave-exposed part of the coast of Norway (e.g. Norderhaug and Christie 2009). Further, due to increased nutrient concentrations, reduced water transparency (Moy et al. 2008), and most likely also increased temperatures (Syvertsen et al. 2009, Korpinen et al. 2007), S. latissima and other macroalgae in the Bothnian Bay and the Skagerrak-Kattegat region have in some areas been lost or strongly reduced (Dahlgren and Kautsky 2002, Moy et al. 2008) (Box 2, Figure 5). The macroalgae are instead re placed by less productive and supportive habitats, such as filamentous algae, which of ten end up covering beaches (Malm et al. 2004), with reduced benefits and increased costs for recreational businesses (Hasselström et al. in prep.).
Ecosystem Services
37
Box 1: Sea urchins turn viable kelp forests into desert-like barren grounds in the Norwegian Sea and Barents Sea Since the early 1970’s, more than 50% of kelp forests in the sheltered and moderately exposed areas from ~63 to 71°N have been grazed by green sea urchins, Strongylocentrotus droebachiensis, which have transformed the areas along the Norwegian coast into marine deserts, or so-called barren grounds (Sivertsen 1997) (Figure 5). The reason for this development is not fully understood, but might relate to both stochastic and cyclic events (Norderhaug and Christie 2009). However, the last decade we have observed a gradually northwards recovery of kelp (Norderhaug and Christie 2009, Rinde et al. 2014), partly explained by the negative effects from warming on sea urchin recruitment (Fagerli et al. 2013) and to some degree from increased predation by northward expanding Cancer pagurus and Car cinus maenas crabs (Fagerli et al. 2014, Christie et al. in prep.).
Figure 5: The kelp forests of the northern coasts of Norway have been kept back by green sea urchins for decades, but are now slowly recovering in a northward direction
Source: Hartvig Christie, NIVA.
38
Ecosystem Services
Box 2: Eutrophication, climate change and overfishing threatens the kelp forest in Skagerrak An important threat to S. latissima and other macroalgae in the Skagerrak and North Sea region is the competition and overgrowth of filamentous algae on less exposed hard bottom localities during sum mer. Moy et al. (2008) found that S. latissima had disappeared at about 80% and 40% of surveyed stations at the Skagerrak and west coast, respectively. Worst affected are areas with good conditions for filamentous algae, which are in protected areas with good light conditions (Bekkby and Moy 2011). Based on today’s knowledge, the loss of S. latissima is most likely related to eutrophication and climate change (Syvertsen et al. 2009). Increasing temperature and inputs of nutrients and particulate matter, together with overfishing of for instance the cod Gadus morhua are probable reasons why sugar kelp has disappeared and not yet returned (Moy et al. 2008, Syvertsen et al. 2009). A decline in large pred ators can lead to domino effects in the food chain that increases the effects of eutrophication (Mok snes et al. 2008, Korpinen et al. 2007, Östman et al. 2016).
Figure 6: Saccharina latissima kelp in the Skagerrak and North Sea becomes overgrown by filamentous algae in late summer, probably due to a combination of high temperatures, rich loads of nutrients and overfishing
Source:
Hartvig Christie.
Ecosystem Services
39
Figure 7: Map showing the five ecoregions of Norway and western coast of Sweden and the kelp situation in each of them today. The red zone in the north depicts the area where sea urchins have turned the kelp forest into desert-like barren grounds, the green zone in mid-Norway shows where vital kelp forest exist at present and the orange zone in the south is where macroalgae beds are threatened by eutrophication and warming and kelp forest are replaced by mats of turf-forming filamentous algae
40
Ecosystem Services
3.3 3.3.1
Supporting services Habitat and biodiversity
Already on his trip to the Strait of Magellan in 1834, Charles Darwin was astonished about the diversity of the great kelp forests of South America. Darwin writes in “The voyage of the Beagle”: I can only compare these great aquatic forests of the southern hemisphere with the terrestrial ones in the intertropical regions. Yet if in any country a for est was destroyed, I do not believe nearly so many species of animals would perish as would here, from the destruction of the kelp. Amidst the leaves of this plant numerous species of fish live, which nowhere else could find food or shelter; with their destruction the many cormorants and other fishing birds, the otters, seals, and porpoises, would soon per ish also; and lastly, the Fuegian savage, the miserable lord of this miserable land, would redouble his cannibal feast, decrease in numbers, and perhaps cease to exist. The three dimensional structure of the kelp forest provides habitat, nursery ground and food for myriad mobile pelagic and benthic organisms (Christie et al. 2003, Steneck et al. 2002). Typically, the stipe (the kelp stem) is grown with algae, mostly red algae, but also brown- and green algae (Figure 8). It has been found that more than 50 different epi phytic algae exist in one single kelp stipe. In addition to epiphytic algae, there are also large numbers of epiphytic fauna on the stipe. The most important groups are tuni cates, sponges and bryozoans, which can also cover large parts of the lamina (the kelp leaf). Recent studies have found a surprisingly rich fauna of mobile invertebrates. Such animal societies can consist of 2–300 different species and having densities of more than 100 000 individuals of snails, crustaceans, clams, polychaetas and other inverte brates per square meter (Christie et al. 2009). Within and above the kelp forest we find during summertime large densities of dif ferent stationary fish species, such as labridae (eng: wrasse; no: leppefisk; swe: läpp fiskar) and gobies (no: kutling; swe: smörbult). The two-spotted goby, for instance, be ing no more than 10 cm long, is considered as Norway’s most numerous fish during summertime and important in the transfer of energy from seaweed and up to larger fish. Other large fish stocks utilize coastal ecosystems as nurseries and feeding grounds and kelp forests are among the most important habitats for both commercial species (e.g. cod, pollock, pike, and perch) and red list species (e.g. the coastal cod, Steneck et al. 2002, Ottersen et al. 2010). These fish are in turn further predated by higher trophic species, such as coastal seals and several species of seabirds (Lorentsen et al. 2010).
Ecosystem Services
41
Figure 8: The kelp forest is an extremely diverse system due to its three dimensional structure with many different niches and refuges for small and large plants and animals
Source: Institute for Marine Research.
3.3.2
Primary production, food webs and nutrient cycling
Kelps, which are photosynthetic organisms, are hugely important as primary producers and kelp forests are regarded among the most productive systems on earth (e.g. Day ton 1985, Steneck et al. 2002, Smale et al. 2013). Published values from the Nordic wa ters show a yearly primary production between 1,200 and 5,000 g carbon per square meter of kelp forest, which corresponds to between 12 and 50 kg produced plant mate rial (biomass) per m2 per year (Ottersen et al. 2010, Kain 1971, Sjøtun et al. 2006, Gundersen et al. 2011). Since macroalgae grow fast and have very high production there is a steady pro duction of particulate organic material (POM) throughout the year. The flow of detritus between habitats is thus an important form of connectivity that affects regional productivity and the spatial organization of marine ecosystems (Krumhansl and
42
Ecosystem Services
Scheibling 2012). Detritus settles within kelp beds or forests and is exported to neigh boring or distant habitats, including sandy beaches, rocky intertidal shores, rocky and sedimentary subtidal areas, and the deep sea. Exported kelp detritus can provide a sig nificant resource subsidy, and enhance secondary production in these communities ranging from tens of meters to hundreds of kilometers from the source of production (Krumhansl and Scheibling 2012). Of yearly POM from kelp plants, about 10% are consumed by higher trophic spe cies, like crustaceans and other fauna (Norderhaug and Christie 2011), while the major ity of the dead kelp plant material accumulates within or outside the forest being sub ject to decomposition by microorganisms and bacteria in other food webs. An uncertain amount of the plant material is also thought to be buried in the ocean sediments (see chapter on carbon sequestration and Gundersen et al. 2011). Although phytoplankton contributes to a greater total volume, the kelp system is regarded among the most productive on the planet, with an annual primary production over ten times more per unit area than for phytoplankton. In Norway, it is primarily the two species L. hyperborea and S. latissima that contribute most to the production, whereas fucus and eelgrass also can be significant in the Baltic Sea.
3.3.3
Biological control
Through its three-dimensional structure, the kelp forest houses a myriad of species with overlapping functions at all trophic levels. These qualities imply high resilience to disturb ances and biological control against potential pests and invasive species. For instance, the kelp forest accommodates facilities for many of the predators of juvenile sea urchins, and thus reducing the possible destructive overgrazing of the kelp forest itself. Further, the kelp plant contains anti-grazing substances (polyphenols) which means that few species feed directly on the kelp plants. Alginates from kelp have been used in agriculture to encapsulate biocontrol agents and rhizobia as inoculants for leg umes (DeLucca 1990).
3.4 3.4.1
Provisioning services Resource utilization and bioprospecting
Historically, in the Nordic seas and in other parts of the world, large algae have been used in food production. Also today there is a growing market and interest for human foods based on algae and seaweed (Chapman et al. 2015). Traditionally, kelp and other
Ecosystem Services
43
macroalgae have also been collected and used as “kelp ash” in the manufacture of glass and soap and for pottery glazing, as well as for fertilizers (Smale et al. 2013). Since the early 20th Century, kelp has mainly been harvested for alginate extrac tion. The alginate are useful for its abilities in bulking, gelling, and stabilizing processes and are used in a wide range of industries, such as for the production of textiles, food, paper, cosmetics, and pharmaceuticals. Alginate derived from kelp is found in as di verse products as ice cream, shampoo, toothpaste, paint, yoghurt and pet food. In Norway, about 200,000 tons of L. hyperborea are harvested each year (Vea and Ask 2011), primarily for alginate production, with a first-hand value of NOK 30–35 mil lion and a further increase in value up to 1.5 bill after processing. However, since the further manufacturing of alginate products is not performed in Norway, this value cre ation is not benefiting the Norwegian society today. An increasing demand for non-fossil based energy has made kelp interesting as a potential source of biofuels. Kelp can grow very quickly (up to 50 cm per day), are rich in polysaccharides, do not compete with land-based crops for space, and do not require additional fertilizer or water (Smale et al. 2013, Wargacki et al. 2012). However, a recent analysis of the carbon footprint of the production of ethanol and methane from sea weeds indicated that production of biofuels from other sources (e.g. corn, wheat and sugar cane) is more efficient (Fry et al. 2012). Clearly, the magnitude of kelp production for biofuels would need to be substantial to have any bearing on the energy marked. Due to its high diversity of organisms, kelp forests have a significant potential when it comes to bioprospecting. There are good reasons to believe that marine organisms, such as bacteria, fungi, viruses, plants, shellfish and fish, possess features and charac teristics which can be utilized for different products and processes. The Nordic coun tries are considered to have excellent opportunities to compete internationally within this field. The potential for culturing kelps for biofuels, feed for aquaculture and livestock, al ginate processing, etc. have led to an increasing interest in large-scale harvesting and cultivation of kelp. According to Olafsen (2012), Norway is capable of cultivating 20 mil lion tons of kelp, which will give a yearly added value of 40 billion NOK.
3.4.2
Commercial and subsistence fishery
Since kelp forest are assumed to be crucial habitats for many economic important fish species, the value creation from fishery and other sea food in countries like Norway and Iceland is indisputable (Meld. St. 37, 2012–2013, HELCOM 2007). The supply of fish de pends on both the available habitat for spawning, hatching, nursing, and grazing, but also on the existence of habitats available for animals and plants that the fish feed on.
44
Ecosystem Services
Based on the well-known food chains from kelp, via fauna and several trophic levels of fish, these areas should theoretically give rise to a substantial annual production of fish, and in fact an estimated 1–2 million tons of cod are assumed to be dependent on the Nor wegian kelp forest, according to models by the Institute of Marine Research (Moy and Steen 2014). Also, commercial fisheries are ranked as the second largest marine eco nomic activity in the Baltic Sea Region (HELCOM 2014, Hasler et al. 2016). The three most important species is cod, Baltic herring (Clupea harengus) and sprat (Sprattus sprattus), which constitute 95% of the landings, but in addition about 20 other species are caught more locally (Hasler et al. 2016). Values that include both provisioning (food) and cultural (recreational fishing) ecosystem services have been estimated for the cod stock (Eggert and Olsson 2009, Carlsson et al. 2010), Baltic salmon (Kulmala et al. 2012), and fisheries and fish stocks in general (Lewis et al. 2013, Kosenius and Ollikainen 2015). However, the number of people in the fishery sector continues to decrease, partic ularly in the small-scale fishery, and also the average age of a commercial fisherman is continuously increasing (Naturvårdsverket 2008). Despite a relatively small scale, the processing industry creates jobs in sparsely populated areas while maintaining cultural heritages in coastal communities and is therefore of local importance. For an overview of marine food production and its added values for the Baltic countries, see Natur vårdsverket (2008), and for Norway, see Meld. St. 37 (2012–2013), Meld. St. 8 (2005– 2006) and Meld. St. 10 (2010–2011).
3.5 3.5.1
Regulating services Maintenance of resilience
A commonly used definition of ecological resilience is the extent to which ecosystems can absorb recurrent natural and human perturbations and continue to regenerate without slowly degrading or unexpectedly shifting to alternate states (Holling 1973). This service is essential for maintained ecosystem function (Naturvårdsverket 2008). Kelp forests are remarkably resilient to natural disturbances such as wave impacts, storm surges, and other extreme oceanographic events (Dayton 2003, Steneck et al. 2002) and this service is essential for the safeguarding of ecosystem functions. The re silience of the kelp ecosystem depends among others on the biodiversity which con tributes to increase the robustness, stability and the ability of the ecosystem to recover. If a species is disturbed, another can take over its function in response to the disturb ance. If an ecosystem’s resilience is weakened, for instance by over-fishing or eutroph
Ecosystem Services
45
ication, a trophic cascade might happen, where the ecosystem transitions from one dy namic equilibrium level to another – a so-called regime shift (Folke et al. 2004, Ling et al. 2009, Östman et al. 2016). According to Naturvårdsverket (2008), the ecosystem service of resilience can be considered as an insurance against catastrophic or irreversi ble changes and accompanying loss of ecosystem services.
3.5.2
Carbon storage and sequestration
Primary producers use solar energy to convert inorganic material to organic matter through photosynthesis. Among many other important functions, the kelp therefore affects the biochemical cycles and regulates the global climate by using carbon dioxide (CO2). The kelp plants act as reserves for CO2 as long as they are alive, whereas the car bon is released back to the system when the plant dies and are decomposed by micro organisms and bacteria. Because of the large areas along the Norwegian coast, the binding and release of carbon from the kelp forest will have great importance to the total carbon and greenhouse gas balance. Carbon can be stored in kelp forests due to increased areal extent and biomass, for instance through the ongoing regrowth of kelp observed in the north of Norway (Box 1), but also through the disposal of dead organic plant material in the sediments. The proportion of the dead kelp material that are bur ied on the sea floor and stored for the future is still an unanswered question. However, Gundersen et al. (2011) estimated a conservative and a moderate scenario for sedimen tation of kelp material with as much as 0.9 and 2.3 million tons deposited each year, respectively, assuming today’s production and taking into account different threat fac tors and probable changes (Box 3).
46
Ecosystem Services
Box 3: An investigation of CO2 uptake in marine ecosystems In their study, Gundersen et al. (2011) estimated the existing and potential future distribution of kelp and other ecosystems by evaluating different threat factors. The total existing area for L. hyperborea and S. latissima along the Norwegian coast was estimated to 8,000 km2 (80 mill tons). The total area loss due to sea urchins (Box 1) and fouling by filamentous algae (Box 2) was estimated as 2,000 km2 (20 mill tons) and 7,800 km2 (78 mill tons), respectively, and interpreted as a potential increase in area if the threat factors would disappear. If all kelp forest fully recovers, the biomass will increase from 80 to 178 mill tons. This means increased yearly production of 98 mill tons (123%) per year. Today’s stand ing biomass will bind up to 29 mill tons CO2. But if all kelp forest recovers during the next 20–40 years that will bind up to 65 mill tons CO2, i.e. a gain of 36 mill tons bound CO2. This will be a one-time happening when the sea floor regrows with kelp forest. Also, a conservative (3% sequestrated – light green line in the figure below) and a moderate (8% sequestrated – dark green line in the figure below) scenario for potential gain from sedimentation of kelp material showed that 0.9 and 2.3 mill tons will be deposited every year, respectively, assuming today’s production. These numbers will increase by 1.1 and 2.9 mill tons CO2 per year, respectively, if the kelp forests grows back. An intact kelp forest would have, through the last 40 years, stored about 150 mill tons CO2 more in the oceans (due to increased amounts of standing kelp forest and 8% accu mulation of yearly production).
Figure 9: Estimated sequestration of CO2 from Norwegian kelp forests, given two different regrowth scenarios, a moderate (8%) and a conservative (3%) one
Source: Gundersen et al. (2011).
Ecosystem Services
47
3.5.3
Eutrophication mitigation
Another important maintenance and regulation service of the kelp forest is nutrient re moval. Primary production by macroalgae is based on nutrients available in the water column, with nitrogen and phosphorus being the main elements required for active growth of photosynthetic organisms. But although primary production is a prerequisite for all production in the sea, nutrient input levels and consequential production can be too high, at least for societal and economic aspects of ecosystem services. Eutrophication is caused by excessive nutrient loads from waterborne sources and from atmospheric deposition (HELCOM 2013, PLC5) mostly caused by human actions, such as agriculture, waste water, industry, and aquaculture. Above certain thresholds the eutrophication will have detrimental effects to the ecosystem and cause increased frequency and magnitudes of algal blooms, increase of filamentous algal mats, reduced water transparency, hypoxic sea floors, habitat loss, and impaired recruitment success of commercial fish (Naturvårdsverket 2008). Eutrophication mitigation mediated by kelp forests reduces this threat and contrib utes to the improvement of other services, such as cultural services and provisioning services. A number of studies have looked at nutrient assimilation in the coastal zone as a recognized ecosystem function and service (Hasler et al. 2016). Primary and sec ondary symptoms of eutrophication have been demonstrated to influence the flow of cultural ecosystem services, such as the recreational use of coastal areas (Ahtiainen et al. 2014, Hyytiäinen et al. 2014). Further, eutrophication becomes obviously detri mental in areas important for tourism, recreation and residential development. But also anoxic bottoms contribute to the degradation of many supporting services (Natur vårdsverket 2008). Hasler et al. (2016) refer that the major part of the citizens around the Baltic Sea are concerned about the consequences of eutrophication and that they are willing to make considerable economic sacrifices for a healthier sea (Ahtiainen et al. 2014). These findings are supported by Hasselström et al. (2008) who concluded that blue green al gae blooms caused by eutrophication were considered to be the most important nui sance reducing aesthetic and recreational values in beaches and coastal areas across the Baltic Sea area (Hasler et al. 2016).
3.5.4
Water purification, filtering and removing of hazardous substances
Water purification and filtering are yet other maintenance and regulation services pro vided by kelp forests. Improved water quality (in terms of transparency) is believed to infer enormous benefits for the production of food and to all aspects of ecosystem di versity and function (Naturvårdsverket 2008).
48
Ecosystem Services
Many studies are also supporting integrated aquaculture practices that utilize sea weeds as biofilters within multitrophic farming operations (Neori et al. 2004, Troell et al. 2009). For instance, cultivation of kelps adjacent to salmon farms can generate sig nificant yields of algal biomass while simultaneously removing waste nitrogen (Sander son et al. 2012). However, the impacts of large-scale kelp cultivation in non-enriched systems are poorly known and may be detrimental (Smale et al. 2013). Bioremediation of polluted areas and effluents is becoming an important area of interest as novel environmentally sound solutions to pollution are being investigated and processes using tolerant macroalgal species that accumulate metals at high rates may offer an effective, inexpensive and environmentally friendly alternative (Yu et al. 1999, Baumann et al. 2009). Macroalgae is also frequently used as indicator organisms in environmental monitoring, particularly in relation to heavy metals.
3.5.5
Coastal defense
Coastal defense, such as erosion prevention, represents a critical ecosystem service provided by the kelp forest and will be increasingly important along many coastlines as the consequences of anthropogenic climate change, such as sea-level rise and in creased magnitude and frequency of storms (IPCC 2013), intensify. Kelp forests, such as the L. hyperborea, are found in highly exposed areas and have been found to reduce wave heights and contribute to wave breaking (Løvås and Tørum 2001), which again may provide protection to coastal societies and man-made con structions. Often kelp forests and seagrass meadows are closely located, with kelp for est in the outer, more exposed areas, and soft bottoms, with seagrass, in more shel tered bays inshore. Consequently, kelp forests may contribute to reducing the amount of hazardous waves on seagrass meadows, thus indirectly reducing the risk of soil ero sion at soft sandy bottoms. In a global perspective, more people use sandy beaches than any other type of sea shore (Klein et al. 2004). The beneficiaries of sediment retention and disturbance miti gation are households and industries dependent on the presence of extensive beaches and a stable substrate maintaining and allowing for coastal development (Natur vårdsverket 2008). Also in the Baltic Sea and Skagerrak region, sandy beaches are prime sites for human recreation and tourism activity (Naturvårdsverket 2008).
Ecosystem Services
49
3.6 3.6.1
Cultural services Recreational fishing
Compared to commercial fishermen who make a profit of around EUR 0.1 per kg fish caught; the net value of sports fisheries is four times as high per kg fish, calculated on the basis of willingness to pay (Toivonen et al. 2000, 2004). With an estimated one mil lion sport fishermen in Sweden (including freshwater fishing), the total willingness to pay for sport fisheries in 2006 was around EUR 265 million (Toivonen et al. 2000, 2004).
3.6.2
Tourism
Certain ecosystem services related to tourism can be directly associated with kelp forest, such as snorkeling, scuba diving, free diving, and kayaking, which involve peo ple actually enjoying watching a healthy kelp forest with a diversity of inhabitants (Hasler et al. 2016, Beaumont et al. 2008). However, there is also a strong indirect connection between kelp and marine recreation activities such as swimming, wind surfing, water skiing, picnicking, bathing, sunbathing, boating, wildlife watching, an gling, and visiting touristic or cultural sites, via for instance kelps’ role in eutrophica tion mitigation, since these activities will be experienced more positively in clean wa ter (SwAM 2012, Hasler et al. 2016). In the Baltic region, coastal tourism and recreation are currently (and still growing) the largest marine economic activity (Hasler et al. 2016). Also, coastal tourism is the most significant maritime employment sector in almost all EU Member States that have a coastline (ECOTEC 2006). The socioeconomic importance of kelp forests is especially high in coastal societies. The vast kelp forests along the west coasts of Norway support abundant wildlife, such as sea birds, seals, and otters, and the value of this biodiversity to local economies through “green” tourism is significant. Sea angling, scuba diving, and bird- and whale watching are among such tourist based enterprises. Commonly, marine and maritime cultural heritage are mostly connected to artworks and relicts such as paintings, photographs, documents, buildings, ships and shipwrecks, but their direct relations to kelp forest are not many. However, it is worth mentioning the Vega Archipelago which is a UNESCO World Heritage Site just south of the Arctic Circle in Norway. It is the name of a dozen islands where fishermen and farmers have been living since the stone age and where particularly the activity around gathering of down from eider ducks (Somateria mollissima, which are closely associated and depending on kelp forest) has been a major part of their livelihood (Skarpaas et al. 2014).
50
Ecosystem Services
4. Ecosystem services of eelgrass meadows
4.1
Distribution and physical requirements
Worldwide there are about 60 different species of seagrasses (Green and Short 2003) and eelgrass, Zostera marina, is the most abundant and important seagrass ecosystem in the Nordic countries. Eelgrass is widely distributed on the northern hemisphere and along the European coasts from the Mediterranean to the northern arctic waters of Norway, and from the coast of Iceland to the Baltic Sea (Figure 10). The biology of the eelgrass is shown in Box 4. Figure 10: Geographical distribution of Zostera marina
Source: IUCN (www.iucnredlist.org).
Eelgrass is the most studied seagrass species and this has driven an increased aware ness of important ecosystem services provided by the eelgrass biotope. Scientific knowledge of the eelgrass biotope is based on many scientific publications; for instance
Boström et al. (2003, 2014), Fredriksen et al. (2003, 2004, 2005, 2010), Green and Short (2003), and Hily et al. (2003). Especially Boström et al. (2014), which is based on work shops and expert meetings arranged by the Nordic Seagrass Network (a researcher net work funded by NordForsk, project no. 9260), provides up to date knowledge on distri bution, structure and function of eelgrass in the Nordic countries. Eelgrass, along with other seagrasses, commonly grows in shallow bays and is therefore specially threatened by human activities like constructions in the coastal zone and pollution. Worldwide seagrass abundance has declined over the past decades (Orth et al. 2006, Waycott et al. 2009).
Box 4: Eelgrass Zostera marina Eelgrass is a flowering plant with 20–150 cm long and 2–10 mm wide green leaves growing 3 to 7 leaves together in each shoot. Eelgrass may grow scattered or in dense meadows from the intertidal to ap proximately 10 m depth, depending on light conditions. The root system (rhizomes) is long, but grows shallow in the sediment. Flowers are small and greenish and male and female flowers are found on the same individual on long thin flowering shoots (Dawes 1998).
52
Ecosystem Services
Figure 11: Eelgrass meadow with flowering shoots
Source: (Photo:) Frithjof Moy.
Ecosystem Services
53
Eelgrass has a wide tolerance to the environment. It grows in salinity of 5–35 and the substratum may vary from clean sand to mud. Eelgrass is found in shallow coastal areas of low to moderate wave exposure. Optimum temperature range appears to be be tween 5 and 30 °C (Marsh et al. 1986). Zostera marina requires high light levels, and it seldom occurs deeper than 5 m deep, however some exceptions have been found down to 10–12 m in clear Atlantic waters. In brackish waters along the Atlantic coast, Zostera marina behaves as an annual plant, shedding its leaves in winter (Jacobs 1982).
4.2
Threats and challenges
Threats to eelgrass are to a large extent driven by human-mediated factors such as eutroph ication, habitat destruction and overfishing. But also factors such as disease (Labyrinthula sp., Bockelmann et al. 2011) and climate change may affect the eelgrass abundance. A global study by Waycott et al. (2009) states that accelerating loss of seagrasses across the globe is a major threat to coastal ecosystems, by loss of ecosystem services. A global assessment of 215 studies showed that seagrasses world-wide has been disappear ing at a rate of 110 km2 per year since 1980, and the rates of decline have been increasing. Boström et al. (2014) gives an overview of the status within the Nordic countries. Largescale losses have been recorded in Denmark since the 1900’s; case studies in west Sweden since the mid-1980’s and in Poland point to local losses of 60 to 100% (Baden et al. 2003, Boström et al. 2003). Baden et al. (2003) found that the areal extension of eelgrass had decreased 58% along the Swedish Skagerrak coast in only 10–15 years. Eutrophication and decreased water quality may explain the decline, as eelgrass meadows are to a large extent governed by light (Dennison 1987), nutrients (Duarte 1995, Krause-Jensen et al. 2008, Orth et al. 2010) and by salinity under brackish condi tions (Baden et al. 2010). Human activities like dredging, boat propellers, anchoring and construction in the coastal zone cause direct damage to the eelgrass meadows or the habitat. Overfishing may cause trophic cascades causing increased growth of filamentous algae that compete for light and nutrients with the eelgrass meadow (Moksnes et al. 2008, Eriksson et al. 2009), or induce a regime shift where the eelgrass disappear. Over fishing is a world-wide problem and is especially prominent in combination with eu trophication and climate change (Jackson 2008). Climate change induced factors such as heat waves, increased run-off from land, increased turbidity, and changed salinity may affect the abundance and distribution of eelgrass negatively (Short and Neckles 1999, Orth et al. 2006).
54
Ecosystem Services
The challenge is to stop or reduce these factors threatening the eelgrass ecosys tem. It is much easier to protect than to restore, and seagrasses are among the most expensive ecosystems to restore (Bayraktarov et al. 2016). Methods to reduce pollu tion, overfishing or climate change will not be dealt with here. Eriander et al. (2016) assessed four methods of eelgrass restoration on the north western coast of Sweden and found that planting of single shoots without sediment was recommended for shallow habitats and that use of seeds were recommended for deeper habitats. Transplanting cores with eelgrass and sediments has been the most commonly used method for eelgrass restoration (Fonseca 2011) and has been consid ered less stressful for the plants than the single shoot method in which single shoots are planted without sediment. However, the core method is more labor intensive and costlier (Fonseca et al. 1998). Transplanting shoots with ripe seeds is a less labor inten sive method, but the fate is more uncertain. Bioturbation by lugworms (Valdemarsen et al. 2011), predation from crabs (Infantes 2016) and transport of seeds by currents, cause loss of seeds and reduced restoration success. Van Katwijk et al. (2010) found in seeding experiments in the Wadden Sea a maxi mum germination of 45% and maximum seedling survival of 55%. A literature review in Orth et al. (2006) reports a maximum germination of 90%, and maximum seedling sur vival of 40% based on worldwide Zostera populations. However, Infantes et al. (2016) reported on average 98% seed loss in a restoration experiment at the Swedish west coast. Restoration is challenging and suitability of methods in a given area needs to be addressed before large-scale restoration is implemented.
4.3 4.3.1
Supporting services Habitat and biodiversity
Eelgrass meadows provide habitat for a wide range of species due to the three dimen sional structure it creates on shallow soft bottoms. Hemminga and Duarte (2000) found 10-fold as many animals within an eelgrass meadow as outside the meadow. Eelgrass provides suitable substratum for a rich epifauna and flora (Baden and Boström 2001, Fredriksen et al. 2005, Jephson et al. 2008, Gustafsson and Boström 2009) which in turn support diverse fish communities finding shelter and food within the eelgrass meadows (Pihl et al. 2006). Boström et al. (2014) found that a number of small crustacean mezograzers, mainly Gammarids and Idoteids varied highly (from 300 to > 16,000 individuals per m2) within Nordic regions (Atlantic, Skagerrak, Kattegat/Belt Sea, southern Baltic, Baltic proper,
Ecosystem Services
55
and north-east Baltic). Common gastropods include Rissoa membranacea, Lacuna vincta, Littorina littorea, Theodoxus fluviatilis, and Hydrobia ulvae. Common fish species in the eelgrass meadows (Figure 12) include pipefish, wrasse (mainly goldsinny wrasse Ctenolabrus rupestris), gobiids (black goby Gobius niger, two-spotted goby Gobiusculus flavescens and three-spined stickleback Gasterosteus aculeatus, but also including At lantic cod Gadus morhua, whiting Merlangius merlangus, polloch Pollachius virens, her ring Clupea harengus, eel Anguilla anguilla, sea trout Salmo trutta and different species of flounders (Rönnbäck et al. 2007, Stål et al. 2008). Figure 12: Fish fauna caught in beach seine in Skagerrak
Source: Photo: Øystein Paulsen.
In addition, the complex root systems facilitate the existence of diverse infaunal com munities belonging to the faunal groups Annelida, Nemertea, Echinodermata, Crusta cea, and Mollusca (Fredriksen et al. 2010). It is uncertain if eelgrass beds facilitate more infaunal species, but clearly it facilitates higher abundance of species (Boström and Bonsdorff 1997, 2000, Fredriksen et al. 2010). Within the Nordic countries, the shoot densities and shoot biomass may vary sig nificantly from meadow to meadow (72–3,948 shoots per m2, 0.024–0.834 g dry weight per shoot, 30–120 g DW per m2, Boström et al. 2014) and Boström et al. (2014) found significant differences in biomass between Nordic regions, with the highest eelgrass bi omasses found in the Kattegat/Belt Sea. This high variation obviously affects the eco system services provided by each single eelgrass meadow.
56
Ecosystem Services
4.3.2
Primary production, food webs and nutrient cycling
Seagrass meadows are considered the most productive of shallow, sedimentary envi ronments (Figure 13). Eelgrass has a high production building up both above- and be lowground biomass during growth season, i.e. during summer. Eelgrass has a continu ous production of new leaves every month in each shoot and a continuous production of new shoots with 3–7 leaves reflecting the environmental conditions (e.g. light, nutri ents, sediment quality, and pollution). Hansen et al. (2000) found a 5.5-fold increase in the eelgrass leaf biomass from April to August, and Jacobs (1979) estimated an annual net production of 1.6 kg dry weight per m2. Pedersen and Borum (1992) found that rel ative growth rate was 0.022 per day and eelgrass production was 5.6 g C per m2 per day with maximum rates of production during summer. This is in compliance with a compi lation by Duarte and Chiscano (1999) of eelgrass studies worldwide. Aboveground pro duction was 5.2 g C per m2 per day and belowground production 1.7 g C based on 29 and 18 studies, respectively. Not many species, other than a few birds such as mute swan, ducks, and geese, utilize this high primary production directly (Nienhuis and Groenendijk 1986). In addi tion, snails and sea urchins feed directly in the eelgrass. Based on stable carbon isotope and fatty acid analyses the food web in the eelgrass meadow is mainly based on epiphytes and sand microflora (Jaschinski et al. 2008). The contribution from eelgrass (Jaschinski et al. 2008) was found to be negligible, indicating that habitat is the main importance of eelgrass for secondary production. Gastropods and amphipods feed on the epiphytes growing on the leaves, and by that cleaning the leaves. The snail Lacuna vincta contained small amounts of eelgrass fatty acid indicat ing that it also may damage the leaves while eating the epiphytes (Jaschinski et al. 2008). Fredriksen et al. (2004) found that another gastropod Rissoa membranacea was probably able to deteriorate an eelgrass bed. After a year the meadow had recovered due to undamaged belowground root system. Plummer et al. (2013) found that increases in nearshore habitats such as eelgrass beds lead to greater biomass of many invertebrate, fish, and bird species that depend on those habitats for refuge or food. They also illustrated by applying food web model ing, how marginal changes in foundational nearshore species such as eelgrass give rise to changes in ecosystem service values.
Ecosystem Services
57
Figure 13: Dense eelgrass meadow far north in Balsfjord at 69°N
Source: Photo: Frithjof Moy.
There are many attempts to calculate monetary value of ecological functions. Waycott et al. (2009) estimated that seagrass meadows worldwide cycle nutrients equal to USD 1.9 trillion per year. Submersed rooted macrophytes, like eelgrass, link the nutrients in sediments with the overlying water. Flindt et al. (1999) compared nutrient dynamic in bare bottom sediment with eelgrass covered sediment, and the most pronounced dif ference between the two systems were the nitrate profiles. In the bare bottom system, the constant level of nitrate down to 10mm depth indicates the depth of the oxic zone, whereas within the eelgrass bed, the penetration in the sediment reached down to 72mm depth. Also the pool of nitrate in the vegetated sediment was four to eight times higher than in the bare bottom system. In addition, the ammonia profiles showed much faster depletion of ammonia in the water column in the vegetated system than in the bare sediment system. Also high ammonia pool in the sediment of the bare bottom system, most likely reflects the oxygen limitation of the nitrification. With phosphorus, the bare bottom sediment showed values of 100–200 mg PO43--P per m2 higher than the eelgrass system.
58
Ecosystem Services
4.3.3
Biological control
By high primary production, nutrient cycling and providing a three dimensional struc ture, eelgrass in many ways provide biological control. Orth et al. (1984) reviewed stud ies relating predator-prey relationships to different features of the seagrass system and summarized that the abundance of many species, both epifauna and infauna, is posi tively correlated with two distinct aspects of eelgrass morphology: 1) the root-rhizome mat, and 2) the plant canopy. Harrison (1982) showed that growth of a microalgae (Platymonas sp.) and many marine bacteria were inhibited by water-soluble extracts of eelgrass leaves, and by that altering the activity of microorganisms directly and indi rectly affecting amphipod grazers. Allen and Williams (2003) found that eelgrass controlled the growth and repro duction of an invasive mussel through food limitation. On the other hand, Boström et al. (2014) summarized studies in Skagerrak and the southern Baltic showing that loss of eelgrass and reduction of crustacean mesograzer were linked and partly explained by the overfishing of cod and subsequent dominance of intermediate fish predators and macroalgae (Baden et al. 2003, 2010, Bobsien 2006, Jephson et al. 2008, Moksnes et al. 2008).
4.4 4.4.1
Provisioning services Resource utilization and bioprospecting
Eelgrass is not used as food source due to its high amount of cellulose, which most an imals including humans, cannot digest. But eelgrass eco-systems have a wide variety of ecological functions in which living tissues and detritus may be a food source for many marine animals. Today, harvest of eelgrass is of no value. However it has for centuries, perhaps back to the age of the Vikings, been used as building material for roof covering (see Figure 15), filling and isolation material, for cattle feed and soil amendment. Traditionally, eel grass flushed on shore was collected, rinsed and dried before use and even exported (Jensen 2012). No medicament is known from eelgrass but since intact leaves decay very slowly and are widely selected and used as roof materials, it may be a good resource for screening natural antibiotics and some studies have shown effective compounds with nematicidal and antibacterial activity from eelgrass extracts (Harrison 1982, Choi et al. 2009, Liu et al. 2010, Newmaster et al. 2011, Wang et al. 2012).
Ecosystem Services
59
Parallel to medical potential, marine macrophytes are rich in a diversified plethora of lipids (Maciel et al. 2016) and the great potential of these lipids as bioactive com pounds has been demonstrated, particularly in what concerns their putative use as antiinflammatory, anti-proliferative, anti-microbial, and anti-oxidative. The eelgrass is rich in C18 fatty acids: α-linolenic acid (omega-3, ALA), linoleic acid (omega-6, LA) and stea ric acid (SLA). Omega-3 fatty acids are important for normal metabolism. Omega-6 is a group of pro-inflammatory and anti-inflammatory fatty acids, and stearic acid is mainly used in the production of detergents, soaps, and cosmetics.
4.4.2
Commercial and subsistence fishery
No commercial or subsistence fishery today is conducted in eelgrass meadows, but eel grass meadows are key habitats for 0-group cod (Wennhage and Pihl 2002) and by that, may be essential for commercial fisheries. Eel has been an economically valuable spe cies and highly dependent on eelgrass beds where the fishery traditionally was per formed with fykes, pound net or other traps, but its stocks are dwindling and the market has closed (Cole and Moksnes 2016). Figure 14: Juvenile cod captured in an eelgrass meadow with a beach seine
Source: Photo: Ø.Paulsen.
60
Ecosystem Services
4.5 4.5.1
Regulating services Maintenance of resilience
Manage for resilience is done by increasing buffering capacity (Gunderson 2000) and it is better to protect the eelgrass, than to restore due to many negative feedback mech anisms that make restoration difficult, expensive and by no means guaranteed to suc ceed. Feedback mechanisms include sediment resuspension that maintains the turbid state (Duarte 1995, Munkes 2005, Carstensen et al. 2013), occurrences of anoxia (Pulido and Borum 2010), unsuitable sediments (Krause-Jensen et al. 2011), and physical dis turbance by drifting macroalgae and seed burial by polychaetas that also may hinder eelgrass recolonization (Valdemarsen et al. 2010, 2011). Moreover, lack of apex predators and thus top-down control on epiphytes and fila mentous macroalgae could be an additional burden on eelgrass meadows, as demon strated along the Swedish west coast (Moksnes et al. 2008). In the Nordic countries eel grass loss related to food web changes (overfishing and reduction of mesograzers) and subsequent macroalgal blooms have shown a region-specific pattern, with both over fishing and nutrient pollution as equally important stressors in Skagerrak, while over fishing appears to be of minor importance for the formation of macroalgal stress at both ends of the gradient, i.e. Atlantic Norway and the northern Baltic Sea (Moksnes et al. 2008, Baden et al. 2010, Boström et al. 2014). Manage for resilience also includes genetic diversity, as high genotypic diversity may provide resilience in the face of climatic extremes (Ehlers et al. 2008). There is also another lesson to be learned: small patches can exist on the edge of collapse for many years before they suddenly disappear due to reasons (eutrophication) many years be fore (van Katwijk et al. 2010). For conservation it is important to recognize that eutroph ication may cause seagrass population to collapse and its eventual extinction, even years after nutrient levels are stabilized, or even decreased.
4.5.2
Carbon storage and sequestration
Seagrass meadows have high ability to produce, trap and store organic compounds, making them important sinks for carbon. But as there are no known studies of carbon sequestration rates or the carbon content of live eelgrass or eelgrass sediment in Nordic countries, we rely on estimates from other areas (Cole and Moksnes 2016). Duarte et al. (2010) has calculated the global net community production of seagrass meadows considering a low global seagrass area of 300,000 km2 and a high estimate of 600,000 km2 to respectively 20–50 Tg C per year and 40–100 Tg C per year. A global loss
Ecosystem Services
61
of 29% of the seagrass area represents therefore a major loss of natural carbon sinks in the biosphere (Duarte et al. 2010). By using the best available estimates of carbon burial rates in seagrass meadows, Kennedy et al. (2010) calculated that between 41 and 66 g C per m2 per year originates from seagrass production. In addition, they estimated that total carbon burial in seagrass meadows was 48–112 Tg per year when including global average for alloch thonous carbon trapped in seagrass meadows. This shows that seagrass meadows are natural hot spots for carbon sequestration.
4.5.3
Eutrophication mitigation
Due to nutrient cycling and storage, eelgrass by enhancing denitrification, minimizes the efflux of ammonia and phosphate effluxes to the water column, cleans the water and mitigates eutrophication, and possibly reduces growth of opportunistic macroal gae and phytoplankton. In a Swedish valuation scenario, Cole and Moksnes (2016) calculated that the value of nitrogen storage derived from a hectare of eelgrass to be approximately SEK 5,600 (USD 680) annually, based on a nominal removal of 466 kg of nitrogen by the eelgrass and the cost to the society of removing an equivalent amount.
4.5.4
Water purification, filtering and removing of hazardous substances
Eelgrass absorbs nutrients from the water column for their growth and reproduction (see Chapter 4.3.2 for references). Uptake of nutrients by eelgrass and other submerged aquatic vegetation (SAVs) can help to prevent nuisance algae blooms and can improve water clarity. The presence of eelgrass therefore helps mitigate the impact of excessive nutrient input to the estuary from human activities. Eelgrass may play an important role in biogeochemical cycling of heavy metals and several works have studied uptake and translocation of heavy metals, among Lyngby and Brix (1982, 1989) and Ferrat et al. (2012). The plant tissue of eelgrass significantly accumulates high levels of heavy metals when growing on heavy metal-impacted sites. In Puget Sound (USA) eelgrass above/below ground biomass is estimated to 10/5 million kg, respectively. Total ac cumulation of metals was estimated to be 300/30 kg copper, 2/280 kg lead, and 800/0.4 kg zinc respectively in above/below ground biomass. Three to 10 times calcu lated aboveground value may be cycled or stored in one year due to growth and shed of old leaves during the growth season.
62
Ecosystem Services
4.5.5
Coastal defense
The eelgrass leaf canopy and the network of rhizomes and roots fix and stabilize the sediment and reduce the resuspension of the sediment by currents and waves (Borum et al. 2004). Sediments vegetated by eelgrass and other seagrasses are less likely to be mobilized by waves and currents, so seagrasses reduce the erosion of the coastline much in the same way as beachgrass stop drift of sand dunes. The restoration of sea grass meadows has also been pointed out as one potential tool for preventing deterio ration of the service (Naturvårdsverket 2008). Accumulation of eelgrass leaves on the beaches represents another way in protection of the shoreline (Borum et al. 2004). However, there are still many uncertainties in the characterization and quantifica tion of the protection offered by seagrasses, which demands greater attention from science if it is to be applied as a real adaptation option (Ondiviela et al. 2014).
4.6 4.6.1
Cultural services Recreational fishing
Ecosystem services provided by the eelgrass biotope, like high biodiversity, shelter and feeding ground for many species implies that the eelgrass meadows are popular fishing sites for recreational fishing (Jackson et al. 2015). This is confirmed through numerous fishing field guides, especially for sea trout, but also for many other fish species.
4.6.2
Tourism
Eelgrass meadows play a role in tourism by cleaning the water (eutrophication mitiga tion and coastal defense) and boosting the biodiversity on sandy beaches and create good sites for bathing and recreational fishing. Beaumont et al. (2008) state that a significant component of leisure and recreation in the UK, like bird watching, depend upon coastal marine biodiversity. With a loss of marine biodiversity and decline in eelgrass beds, the value of this sector will decrease.
Ecosystem Services
63
Little information is currently available on the cultural benefits of marine biodiver sity, although this is believed to be indicative of a lack of documented research, as op posed to a lack of value (Beaumont et al. 2008). Especially few data is obtained con cerning eelgrass, except for a report by Jensen (2012). In 2012 the “Tang-Triumviratet” at Læsø Island got the prestige Europa Nostra prize for “Tangbanken” and the rescue plan to preserve the last eelgrass roofed buildings (Figure 15). By that, the project brings history and use of eelgrass to life. Figure 15: Eelgrass used to cover the roof of an old house at Læsø Island in Denmark
Source: Photo: Peter Wath.
64
Ecosystem Services
5. Ecosystem services of blue mussel beds
5.1
Distribution and physical requirements
Blue mussels are bivalves at the size of up to 10 cm in length. Wild blue mussels (Mytilus edulis) can be found from the Bay of Biscay in the south, to the Barents Sea in the north, including the coasts of Iceland and at the western Atlantic (Figure 16). These shells are especially common in the Nordic region and are one of our most common marine spe cies. In Skagerrak and Kattegat there are numerous other species of filter feeders, but in the Baltic Sea the blue mussel (Mytilus trossulus) is the only species with this function (Naturvårdsverket 2008). Here, it occurs as far north as Kvarken, and is the most com mon species in the Baltic Sea and constitutes as much as 70% of the coastal biomass (Naturvårdsverket 2008). Figure 16: Global distribution of Mytilus spp
Source: Gaitán-Espitia et al. 2016.
Blue mussels live in the intertidal zone in clusters attached to rocks and other hard sub strates by use of their strong byssal threads. As much as 12,000 individuals can be found in one square meter. These invertebrates are very well adapted to the harsh environ ment in the intertidal zone, which can be extremely hot during summer and biting cold during winter. The shells can thus withstand a life under and above the sea surface (Fig ure 17), and in both fresh and salt water, but the optimal is a steady, high, salinity and temperatures around 16–18 °C (Bergström et al. 2015). The size and growth of the mus sels are highly variable and depends on a complex pattern of interactions between the bivalve and a diverse range of environmental factors and functions (see Suchanek 1985 for a review). Figure 17: Clusters of blue mussels Mytilus edulis above the sea surface at low tide
Sourc: Photo: Hans Hillewaert.
Blue mussels are preyed from above from seabirds, like the eider duck (Somateria mollissima), but also from below. For instance by starfish which can suck hole in the shell and slowly eat the mussel from its inside. This explains why mussels are squeezed together in a thin belt within the tidal zone. In the Baltic Sea, where there is no tidal zone and starfish and other marine predators are mainly absent due to the low salinity, blue mussels are most abundant in the depth interval from 3–15 m (e.g. Westerbom et
66
Ecosystem Services
al. 2002, Vuorinen et al. 2002, Lappalainen et al. 2005), but can occur considerably deeper if suitable hard substrate is present (Kautsky 1982, Vuorinen et al. 2002). Apart from sea birds such as eiders, also flounder (Platichtys flesus) and roach (Rutilus rutilus) feed extensively on blue mussels (Lappalainen et al. 2005, Westerbom et al. 2002). Mussels are filter feeders and feed on phytoplankton (algae), zooplankton, bacteria and remains of dead plants and animals floating in the water. One single shell can filter many liters of sea water each hour.
5.2
Threats and challenges
Historically, there have been few threats to blue mussels, being tolerant competitors against most species. However, the recent introduction of the Pacific oyster is about to cause a major threat to blue mussels banks for instance in the Wadden Sea, and all along the Skagerrak coast and most likely also further north, within the next few years (Rinde et al. 2016). The Pacific oyster can form reefs with more than 1,000 individuals per square meter (Bodvin et al. 2014) and there are signs that this species are even more tolerant to freezing than our own mollusks, including the blue mussel. Analyses con ducted by NIVA and IMR show that around 30% of previously recorded blue mussels are in areas that also have high probability of Pacific oysters occurrence (Bodvin et al. 2014). If mussel banks are overgrown by Pacific oysters, the blue mussel habitats, including many of their inherent species, will be lost. However, when it comes to services of blue mussels, many of these are also provided by oysters, which is also a filter feeder. One important difference is the cultural services related to swimming and beach life, where blue mussels have much larger values, since oysters can be extremely unpleasant to walk on and even dangerous due to the sharp edges of the shells. As demonstrated for other marine invertebrates that create their shell from cal cium carbonate (CaCO3), shellfish are highly sensitive to acidification. Studies have shown that increasing acidification leads to reduced growth rate and reduced size of adult farmed animals (Gazeau et al. 2007). Also, low pH may disrupt fertilization and larval development of blue mussels (Talmage and Gobler 2009).
Ecosystem Services
67
5.3 5.3.1
Supporting services Habitat and biodiversity
The blue mussel is one of our most common marine species and an important habitat builder. Although not of the same magnitude as the kelp (Chapter 3) and for instance charales (Chapter 6), blue mussels increase biodiversity by providing substrate for algae and refuge for small animals (Pettersson 2006). Assemblages of blue mussels change the local environment and create unique habitats. The study of Norling (2009) investi gated the role of blue mussels in supporting highly diverse associated communities. The red algae species’ richness was shown to correlate with mussel patch size and bio mass. Structural properties of blue mussels provide substrate for attachment, shelter and increased habitat complexity, which was found to enhance species diversity, espe cially in soft sediment systems. Further, the mussels’ filtration of plankton and particulate organic material from the pelagic system improves the light climate for benthic algae and increase production of other benthic organisms (Norling 2009). Changing the system from a turbid, plank ton-dominated one to a highly diverse and productive benthic system implies that blue mussels are important for sustaining biodiversity and ecosystem functioning of subtidal habitats, especially in the Baltic coastal zone. There are also a number of secondary effects of mussel farming (Chapter 5.4.1) that are expected to benefit the biodiversity around the mussel plants. The plants are in themselves physical structures in the water column, which can act as a substrate for epibenthic organisms and hiding for fish in a well-oxygenated environment. Such arti ficial reefs, can lead to a local increase in biodiversity and the facilitation of path-ways in the form of “stepping stones” (e.g. Petersen and Malm 2006).
5.3.2
Primary production, food webs and nutrient cycling
Worldwide, bivalves constitute a functionally important component of benthic assem blages (Gutierrez et al. 2003, Suchanek 1985). Constituting 70% of the coastal biomass in the Baltic, blue mussels contribute greatly to ecosystem structure and function (Kautsky 1982). The filter feeding bivalves function as ecosystem engineers providing, among other, structural complexity and enhanced habitats by connecting the bottom substrate with the pelagic environment by filtering their food from the surrounding wa ter (Koivisto and Westerbom 2010, Markert et al. 2010). Suspension feeding mussels have the potential to filter considerable quantities of particulate matter from the water column (Cranford et al. 2011). This filtering has the potential to remove large amounts
68
Ecosystem Services
of plankton and suspended particles thus affecting the plankton community (Maar et al. 2007, Newell 2004). Also other biological activities of the mussels, such as biodeposition are affecting pos itively to the abundance, biomass and functioning of the associated plant and animals in an ecosystem (Norling 2009). Mussel biodeposits are rich in organic nutrients (Kaspar et al. 1985) and show relatively high decay rates compared to decomposing phytoplankton or macroalgae (Giles and Pilditch 2006). The ecological importance of biodeposit miner alization is the availability of regenerated nutrients for primary producers (Prins et al. 1998), thus the contribution of bivalves in nutrient cycling of coastal ecosystems. Further, blue mussels are important as prey for a range of different animal groups such as echinoderms, crabs, fish and sea birds.
5.3.3
Biological control
As many of the other blue mussels’ ecosystem services, also its influence on biological control can be attributed to their filtering abilities. By filtering phytoplankton, including toxic algae, filter feeders like blue mussels can inhibit or even prevent harmful blooms. Algal blooms make the water more turbid and reduce the amount of light to plants, algae or corals that live at the bottom, but this effect can be strongly reduced by the short- (acute) and long-time (preventive) effects of filtering blue mussels. Biological control is essential for many other ecosystem services including habitat maintenance, recreation, food provisioning and scenery. The biological control carried out by filter feeders is closely interlinked with mitigation of eutrophication as well as with the con trol of hazardous substances.
5.4 5.4.1
Provisioning services Resource utilization and bioprospecting
The Nordic countries have a long tradition of exploiting the sea, and bivalves are not an exception. In food provision, it is mainly the European flat oyster (Ostrea edulis) which has played a role, whereas blue mussel, horse mussel (Modiolus modiolus) and other mussels have been important as bait for food. The mussels are a good source of iron, selenium and vitamin B12. They have small but healthy fats, with a large proportion of omega-3 fatty acids.
Ecosystem Services
69
Denmark has a large fishing for mussels in the Limfjord; where up to 100,000 tons are scraped up each year (Chapter 5.4.2). However, at the global level, shellfish farming is developing rapidly, with China as the leading nation. Mussel production in Europe is between 300,000 and 400,000 tons a year. In Europe, Spain has the largest production of 200 000 tons. Figures from Gregersen (2007) show that about 1,300 tons were har vested in Norway along the Skagerrak coast in 2005, and similarly between 1,000 and 1,500 tons on the Bohuslän coast in Sweden. Denmark produces some 20,000–30,000 tons of mussels each year in the Skagerrak and is a large producer of processed mussels. The Scandinavian countries are assumed to be far below production capacity, and for instance Norway are said to be able to increase to 100 000 tons within a few years. In the 80’s, many mussel farmers failed due to insufficient professional commitment, poor control of algal toxins and the lack of contact with the marked. In recent years, how ever, these issues have become far better and many companies have much higher profes sionality in their businesses today. This is not the least through the technique of so-called controlled upwelling when nutrient-rich deep-water are directed up towards the brighter part of the water column, profiting the algae and thereafter the mussels. Mussels are farmed for various purposes (Figure 18). Mussels from the Skagerrak and Kattegat are mostly sold for consumption, but investigations are in progress to ascertain whether mussels can be used to filter out nutrients, e.g. at sewage works (Naturvårdsver ket 2009). However, the sedimentation of organic material from faeces below a mussel farm will also in many cases lead to bottom water hypoxia (Stadmark and Conley 2011).
70
Ecosystem Services
Figure 18: Blue mussel farmed in a row of “stockings”
Source: Photo: John Bonardelli, IMR.
Ecosystem Services
71
Trials with mussel-based fodder have so far primarily been made in the poultry industry, with satisfactory results (Naturvårdsverket 2008). Thus mussels could in the future become an important source of organic fodder for the production of organic egg and chicken. Simi larly, in the aquaculture industry, fodder based on mussels might in the future replace un sustainable use of fodder based on wild caught fish (Naturvårdsverket 2008). For more than a decade organic farmers on the island of Orust have used mussel scraps as fertilizer, with promising results except for an unpleasant smell from the fields. However, composting is thought to solve this problem (Naturvårdsverket 2008). Blue mussels are also being explored for possible benefits through marine bio prospecting and researchers have for instance developed a kind of glue, which can stop bleeding wounds in less than 60 seconds, without leaving any visible scars. The glue can for instance be used in dentistry, electronics and construction. Compared to the farming of carnivorous fish, the farming of shellfish is considered an environmentally friendly form of marine aquaculture. Also, with the energy pyramid in mind, the harvesting of bivalves is energy efficient. In fact, the production of 1 kg mussels requires 5–10 kg phytoplankton, compared to the 1,000 kg of phytoplankton required in the production of 1 kg cod. But there are also some possible negative effects from mussel cultivation, primarily related to sedimentation below the mussel farm. These effects are for instance in creased mineralization and denitrification rates, increased oxygen demand and changes in sediment chemical composition. However, the total sedimentation is as sumed to be lower on the basin level.
5.4.2
Commercial and subsistence fishery
Commercial fishing of blue mussels is not as big industry as the aquaculture. However, fishermen in the Limfjord in Denmark have for several decades harvested blue mussels for food production and up to 100 000 tons are scraped up from the sea floor each year. There are also mussel harvest companies in Norway, e.g. Arctic Shellfish AS, but these do not constitute more than one percent of the Danish industry.
72
Ecosystem Services
5.5 5.5.1
Regulating services Maintenance of resilience
Since ecological resilience is described as the extent to which ecosystems can absorb perturbations and continue to regenerate (Holling 1973), this service relies on the com plexity of the food web, the number of species inhabiting the ecosystem, and the growth and regeneration of the key habitat species. Being an important habitat builder for many other species of algae and fauna (Chapter 5.3.1) the blue mussel beds have relatively high biodiversity and thus the ability to recover after disturbances. Perhaps more important, the blue mussels have been described to be extremely tolerant and can withstand wide gradients in temperatures, salinities and draining (Suchanek 1985). On the other hand, they are less able to withstand ice scouring, and the scraping off of mussels during harsh winters can cause colonization of spores of fast-growing algae, which can set the mussel colony many years back.
5.5.2
Carbon storage and sequestration
Blue mussels bind CO2 when building their shells and this carbon is stored in the shell until the animal dies and are decomposed and released back to the ecosystem. The role of blue mussels in carbon storage is thus supposed to be connected to the amount of carbon stored in blue mussel banks at any time. The amount of carbon released from the decom posed mussel that is sequestrated for the future, however, is believed to be minimal. In the Lysefjord at the west coast of Norway, researchers claim to have found the key to producing more food while binding carbon. The great opportunities lie in sus tainable food production through cultivation of mussels and a positive CO2 effect of this when more biological material sinks to the bottom and stored for long periods in bot tom sediment. The test facility in Lysefjord takes up 2,000 tons of CO2 in one season. The number depends on the amount of carbon that goes out of the fjord system in the form of harvested mussels or stored carbon into the sediments. However, there is great uncertainty about whether this method has a long term effect and if CO2 is actually be ing reduced in the atmosphere.
Ecosystem Services
73
5.5.3
Eutrophication mitigation
As phytoplankton feeders, mussels play a key role in the ecosystem, particularly in the light of ongoing eutrophication. Worldwide, the economic value of natural mitigation of eutrophication is estimated to be enormous (Costanza et al. 1997). Mitigation of eutroph ication, or the removal of excess nitrogen (N) and phosphorus (P) from the sea, occurs through the uptake of nutrients. Mussels can then help to counteract eutrophication by being harvested and used as food, animal feed and fertilizer. Mussels can even be farmed as a way of treating waste water, although they cannot then be used as food (5.4.1). Large amounts of blue mussels (and other mussels) for instance in Öresund has been described as being of crucial importance to water treatment and water quality in the Baltic Sea and Skagerrak. Considerations around the large and important mussel beds (900 000 tons of mussels at 73 km2, which survived well, and even were strength ened on bridge piers) were hotly debated in the construction of the Öresund link. Stud ies in both Sweden (Lysekil and Kalmar) and Denmark (Limfjord) have looked at the opportunities to relieve or replace waste water treatment through the cultivation of mussels, and even using payment mechanism between the polluter (the local waste water plant) and the mussel farmer (Zanders et al. 2009). A pilot study from 2009 (Petersen et al. 2010) reported that from 8 000 tons of cul tured blue mussels we could expect removal of up to 80 tons of nitrogen and 5 tons of phosphorus including a significant effect on water clarity (Secchi depth), the concen tration of chlorophyll and the number of days with anoxia (Petersen et al. 2013). When Danish researchers realized that the Baltic Sea suffered the worst oxygen loss of 100 years, they put out 90 km of mussel lines into the fjord close to a fish farm and after a year they harvested the mussels and saw that the concentration of algae had decreased and water clarity was improved (Petersen et al. 2014). In Skive Fjord, an 18 ha mussel farm improved water clarity of an area 10 times the size. Gren et al. (2009) estimated the value of mussel farming for reducing nutrient con tents in the Baltic Sea according to the HELCOM Baltic Sea Action Plan. They found that marginal cleaning costs of nutrients by mussel farming can be lower than other abatement measures. The inclusion of mussel farming could decrease total cost of ni trogen and phosphorus reduction by approximately 5%.
5.5.4
Water purification, filtering and removing of hazardous substances
Perhaps the most important service of the blue mussel, in addition to reduce eutrophi cation, is its ability to take up and thereby remove organic pollutants and toxic sub stances. Consumed or bioturbated, hazardous substances constitute a risk to ecosys tem health and function, while decreasing the value of ecosystem services like food fit
74
Ecosystem Services
for consumption and enjoyment of recreation. Several toxic substances can be found in algae and exposure to these algal toxins can cause illness among humans and animals (Naturvårdsverket 2008). Through their filter feeding habits, blue mussels can reduce the amount of phytoplankton and cyanobacteria in the water column and thus contrib ute to water purification, filtering and removing of hazardous substances. Mussels can store relatively large amounts of toxins without themselves being affected. Being longlived, this storage helps preventing the toxic substance from ending up in far more sen sitive organisms. In a study performed by IMR, up to 70–80% of the algal chlorophyll was retained by mussels in tests where mussels where tanked in flowing water. The same reduction is reported for chlorophyll in water that passed over large natural mussel banks in Øre sund in Sweden. The blue mussel banks caused a mixing of the outflowing water, which contributed to the whole water column that came into contact with the shells on the bottom. The water of the Øresund is unusually clear because of the filtering in the mus sel banks (Robinson and Brink 2006).
5.5.5
Coastal defense
Ecosystem engineering is the modification of the abiotic environment due to biological activity, which is an important mechanism in shaping ecosystems. Mussel beds can in fluence tidal flow and wave action within estuaries, and modify patterns of sediment deposition, consolidation, and stabilization. In the Netherlands, mussels are being in vestigated for their abilities as ecosystem engineers and show promising possibilities for a sustainable coastal protection (de Vriend and van Koningsveld 2012).
5.6 5.6.1
Cultural services Recreational fishing
Many people find both pleasure and recreation in picking their own mussels along the beaches or from a boat. Although, not so much about economy, this activity is more about the enjoyment of gathering your own food, maybe even right outside your own cabin door. Blue mussels can be used in many different sea food dishes, but also as bait for fishing.
Ecosystem Services
75
5.6.2
Tourism
The tourism industry benefits from all ecosystems supporting attractive wildlife such as marine mammals and birds, but also habitats that in themselves attract e.g. divers and recreational boaters. Blue mussel beds can be a beautiful sight for divers, but also for snorkelers and swimmers without any equipment, since they are found in shallow wa ters all the way up to the sea shore, and even above it at low tides (Figure 19). Figure 19: Blue mussel at the sea shore in Nordland county of Norway
Source: Photo: Hege Gundersen.
In a societal perspective, blue mussels and other bivalves are extremely important in cleaning the water for phytoplankton, including toxic algae, thus helping maintain wa ter fit for swimming and beaching. Especially, in regions of importance for tourism and recreation, and where property prices are related to proximity and condition of the sea, mitigation of eutrophication may be particularly important. In Limfjorden in Denmark, where blue mussel harvesting have occurred for severeal decades (Chapter 5.4.2) one can find Mussel City, as the residents of Løgstør call their town (Box 5).
76
Ecosystem Services
Box 5: Løgstør – the town of mussels In the town of Løgstør in Limfjorden in Denmark, one can experience mussels in many different ways, and find a lot of delicious mussel banquets at the city’s gastronomes. The city’s mussels are also the basis for jewelry, art, festival and much more.
Figure 20: Løgstør is known as “the town of mussels” owing to its location right by the sea where the tasty delicacy is found
Source: www.visitnordjylland.com
Ecosystem Services
77
6. Ecosystem services of shallow bays and inlets
6.1
Distribution and physical requirements
Shallow and wave sheltered bays and inlets with soft sediments are among the most productive ecosystems in the northern Baltic Sea. These areas host a rich community of vegetation, consisting of submerged rooted plants and charophytes with reed and sedges close to the shore (Appelgren and Mattila 2005, Eriksson et al. 2004), and asso ciated macroinvertebrate fauna (Hansen et al. 2012, 2008). The isolated shallow bays warm early in spring and constitute important recruitment habitats for many species of coastal fish, by functioning as spawning and nursery areas (Härmä et al. 2008, Karås 1996a, 1996b, Karås and Hudd 1993, Lappalainen et al. 2008, Snickars et al. 2009, 2010, Sundblad et al. 2009, 2014). These bays and inlets provide a number of ecosystem services, especially in relation to supporting services such as biodiversity, habitat and food web dynamics (HELCOM 2009). They also perform important regulating services, e.g. by storing carbon and nu trients in biomass and sediments, and filtering runoff from land (e.g. Kautsky and Kautsky 1991). Also more direct societal benefits and values for human well-being are generated. For instance, both commercial and recreational fisheries are dependent on these areas, as availability to these types of habitats has been shown to limit the sizes of coastal fish populations (Sundblad et al. 2014). Bays and inlets of the northern Baltic Sea are also being intensely used for recreational boating, since the wind and wave sheltered conditions provide suitable places for jetties and small marinas, which, how ever, simultaneously constitute a threat to the continued delivery of ecosystem services (Bishop and Chapman 2004, Eriksson et al. 2004, Sandström et al. 2005, Sundblad and Bergström 2014). This chapter focuses on shallow (