Hindawi International Journal of Aerospace Engineering Volume 2017, Article ID 1793212, 7 pages https://doi.org/10.1155/2017/1793212
Research Article Edge Detection in UAV Remote Sensing Images Using the Method Integrating Zernike Moments with Clustering Algorithms Liang Huang,1 Xueqin Yu,2 and Xiaoqing Zuo1 1
Faculty of Land Resource Engineering, Kunming University of Science and Technology, Kunming 650093, China Kunming Surveying and Mapping Institute, Kunming 650051, China
2
Correspondence should be addressed to Liang Huang;
[email protected] Received 18 September 2016; Revised 5 January 2017; Accepted 18 January 2017; Published 15 February 2017 Academic Editor: Paul Williams Copyright © 2017 Liang Huang et al. This is an open access article distributed under the Creative Commons Attribution License, which permits unrestricted use, distribution, and reproduction in any medium, provided the original work is properly cited. Due to the unmanned aerial vehicle remote sensing images (UAVRSI) within rich texture details of ground objects and obvious phenomenon, the same objects with different spectra, it is difficult to effectively acquire the edge information using traditional edge detection operator. To solve this problem, an edge detection method of UAVRSI by combining Zernike moments with clustering algorithms is proposed in this study. To begin with, two typical clustering algorithms, namely, fuzzy 𝑐-means (FCM) and 𝐾-means algorithms, are used to cluster the original remote sensing images so as to form homogeneous regions in ground objects. Then, Zernike moments are applied to carry out edge detection on the remote sensing images clustered. Finally, visual comparison and sensitivity methods are adopted to evaluate the accuracy of the edge information detected. Afterwards, two groups of experimental data are selected to verify the proposed method. Results show that the proposed method effectively improves the accuracy of edge information extracted from remote sensing images.
1. Introduction Edges, an important geometrical feature of remote sensing images, can be used in various processing concerns of remote sensing images, such as registration [1], segmentation [2], classification [3], change detection [4], and fusion [5]. Edge detection is an essential technology for obtaining the edges of remote sensing images. Therefore, it has gradually become the basis for processing remote sensing images [6]. At present, many researches have been carried out to explore the edge detection in remote sensing images. The existing edge detection methods for remote sensing images can be divided into three classes. (1) Edge detection is based on traditional edge detection operators. Traditional edge detection operators include Canny operator, Sobel operator, Susan operator, LOG operator, Laplace operator, and Prewitt operator. These are employed to perform edge detection of remote sensing images. For instance, Vishwakarma and Katiyar (2011) conducted a comparative analysis into the detected
edges of remote sensing images, respectively, using Canny operator, Sobel operator, and Prewitt operator [7]. (2) Edge detection is based on specific mathematics theories. These methods are applied to perform edge detection in remote sensing images using mathematics theories, such as wavelet transform, mathematical morphology, neural network, fuzzy theory, genetic algorithm, and entropy theory. For example, Kaur and Garg (2011) carried out the edge detection of remote sensing images using mathematical morphology [8]; X. Guan and Z. Guan (2001) extracted different kinds of the edge information from remote sensing images through wavelet transform [9]; Xu et al. (2008) presented a method for detecting the edges of remote sensing images using a cellular neural network (CNN) [10]; Jubai et al. (2006) realized edge detection of remote sensing images by combining fuzzy theory with genetic algorithm [11]; Kiani and Sahebi (2015) performed edge detection of remote sensing images using Shannon entropy [6]. (3) Edge detection is based on integration methods. In order to make full use of the advantages of
2 different algorithms, these methods are used to carry out edge detection by integrating multiple algorithms. For instance, Xi and Zhang (2012) extracted the edge information of remote sensing images using Canny operator through Hough Transform [12]; Huang et al. (2015) put forward an edge detection method of remote sensing images by combining pulse coupled neural networks (PCNN) and LOG operator [13]; Huang et al. (2013) proposed an edge detection method of remote sensing images by combining 2D-OTSU with Canny operator [14]. However, UAVRSI are characterized by abundant texture details, big data, and obvious phenomenon, the same object with different spectra, so their edges are difficult to be detected. Owing to noises interference and texture details in ground objects, detecting the edges of UAVRSI by the first class and the second class methods can result in a large number of pseudoedges and unreasonable profiles. In order to solve the following problems, such as lots of mixed noise, complex texture details of ground objects and long computation time, the filtering algorithms, clustering algorithms, region segmentation algorithms, and intelligent optimization algorithms can be used in edge detection of UAVRSI. Then, edge information can be detected by integrating these algorithms into the edge detection operators, and the accuracy and efficiency of the detected result can be effectively improved. Therefore, the edge detection methods integrated multiple algorithms which have become the main idea for studying the edge detection of UAVRSI. To reduce the influence of the texture details in ground objects on the edge detection of UAVRSI, a spatial clustering algorithm is used to achieve the homogenous regions by clustering the remote sensing images. On this basis, Zernike moments are used to perform edge detection in clustered remote sensing images. The rest of the study is organized as follows: Section 2 briefly introduces two kinds of clustering algorithms: fuzzy 𝑐-means (FCM) and 𝐾-means, while the proposed edge detection method is described in Section 3; Section 4 depicts data sets; Section 5 analyzes the experimental results; conclusions and discussion are presented in Section 6.
2. Clustering Algorithms Clustering refers to segmenting a data set into different categories according to a specific criterion (e.g., distance criterion) so as to maximize the similarity of the data objects of same category and difference among the data objects of different categories. In this research, two extensively applied clustering algorithms, namely, FCM and 𝐾-means, are mainly adopted. 2.1. FCM Clustering. FCM clustering is an algorithm to determine the category of each data point based on membership degree. Suppose that there is a data set 𝑋 = {𝑥1 , 𝑥2 , . . . , 𝑥𝑛 }, its fuzzy 𝑐 division can be represented by a fuzzy matrix 𝑈 = [𝑢𝑖𝑗 ]. The element 𝑢𝑖𝑗 in the matrix 𝑈 donates the membership degree of the 𝑗th (𝑗 = 1, 2, . . . , 𝑛) data point that belongs to
International Journal of Aerospace Engineering the 𝑖th category (𝑖 = 1, 2, . . . , 𝑐). 𝑢𝑖𝑗 satisfies the following condition: 𝑐
∑𝑢𝑖𝑗 = 1,
∀𝑗,
𝑖=1
(1)
𝑛
∑ 𝑢𝑖𝑗 > 0,
∀𝑖, 𝑗𝑢𝑖𝑗 ∈ [0, 1] , ∀𝑖.
𝑗=1
In this research, the clustering is performed by the minimum of the quadratic sum of weighted errors in a category [15]; that is, 𝑛
𝑐
(min) 𝐽𝑚 (𝑈, 𝑉) = ∑ ∑𝑢𝑖𝑗𝑚 𝑑𝑖𝑗2 (𝑥𝑗 , V𝑖 ) , 𝑗=1 𝑖=1
(2)
where V is the clustering center; 𝑚 indicates the weighted index number, while 𝑑𝑖𝑗 (𝑥𝑗 , V𝑖 ) = ‖V𝑖 − 𝑥𝑗 ‖. 2.2. 𝐾-Means Clustering. 𝐾-means is one of the typical clustering methods used in image division. Since this algorithm shows a high computational efficiency, it has been widely applied in image segmentation and classification. By using k as the parameter, 𝐾-means algorithm divides 𝑛 objects into 𝑘 categories so as to make objects in the same category show a high similarity while those in different categories present a small similarity. The specific process for carrying out the 𝐾-means algorithm is shown as follows: to begin with, 𝑘 objects are selected randomly to initially denote the average value or center of a category; for the rest objects, they are classified into the closest category according to their distance to the centers of various categories; then, the average value of each category is calculated again. This process is repeated constantly until the criterion function converges. In general, square errors are used as the criterions, as defined as follows [16]: 𝑘
2 𝐸 = ∑ ∑ 𝑝 − 𝑚𝑖 ,
(3)
𝑖=1 𝑝∈𝐶𝑖
where 𝐸 denotes the sum of the square errors of all objects in the data set; 𝑝 represents a point in the space, while 𝑚𝑖 is the average value of the category 𝐶𝑖 . This objective function is used to make the generated categories compact and independent as much as possible with Euclidean distance. Of course, other distance measures can also be employed [16].
3. The Proposed Edge Detection Method 3.1. Idea of the Proposed Method. Because of a large number of internal texture details and lots of mixed noise in UAVRSI, many traditional edge detection operators are sensitive to noise, such as Robert operator, Prewitt operator, and Laplacian operator; these result in low detection accuracy of UAVRSI. However, in practical application, the edges of UAVRSI are required to reach the subpixel level. The Zernike moments are obtained by integral operation, and it is insensitive to noise, so noise has little impact on the
International Journal of Aerospace Engineering
3 z
UAV remote sensing images
l
Grey conversion
𝜑
k x
K-means clustering
FCM clustering
Edge detection based on
h
y
Figure 2: Step model for ideal edge.
Zernike moments
Precise evaluation
Figure 1: Flowchart of proposed method.
edges detected by Zernike moments in UAVRSI. At the same time, the location of edge detected by Zernike moments can reach subpixel, and it can overcome the limitation of physical resolution; thus it decreases the calculation cost for reaching the required accuracy [17, 18]. In view of this, the research of subpixel edge detection method based on Zernike moments for UAVRSI has important practical significance. However, with the continuous improvement of the spatial resolution of UAVRSI, the spectral difference of a ground object becomes greater that leads to a large number of pseudocontours edges detected in a ground object [14]. The edge detection method based on Zernike moments uses subpixel edge location; in this method, if the spectral heterogeneity in the same ground objects is enhanced, the more nonground object contour edges will be detected. These will have great impact on information extraction and change detection in UAVRSI. In order to solve the problem, a specific algorithm is used to obtain homogeneous regions and heterogeneity minimum in the same ground object. So the edge detection error by the internal texture details of the ground object can reduce and the accuracy of edge detection can improve. Clustering algorithm is an effective method to obtain homogeneous regions. Therefore, FCM and 𝐾-means clustering algorithm are used to the original UAVRSI clustering in this paper; the certain homogeneous regions in the same ground object are obtained after clustering processing; and then the edge detection method based on Zernike moments is used to detect the edge information for UAVRSI. The specific operation is shown in Figure 1. 3.2. Principles of Edge Detection Based on Zernike Moments. Edge detection based on Zernike moments was proposed by
Ghosal and Mehrotra in 1993 [19]. This operator is performed by adopting an ideal step edge model, as illustrated in Figure 2 [19]. To realize the edge detection based on Zernike moments, four parameters of the pixel point in remote sensing images obtained using unmanned aerial vehicle are required. They include background gray ℎ, target gray 𝑘 + ℎ (where 𝑘 means gray level difference), the angle 𝜑 between the normal of edges, and the coordinate axis x and the distance 𝑙 from the pixel center to the edge [19]. For the high spatial resolution UAVRSI 𝑓(𝑥, 𝑦), its Zernike moments of order 𝑛 with repetition 𝑚 are defined as follows [18–20]: 𝑀𝑛𝑚 =
𝑛+1 ∗ 𝑉𝑛𝑚 (𝜌, 𝜃) 𝑓 (𝑥, 𝑦) 𝑑𝑥 𝑑𝑦, ∬ 𝜋 𝑥2 +𝑦2 ≤1
(4)
where (𝑛 + 1)/𝜋 is the regularization factor; 𝜌 shows the length of the vector from the origin to the pixel (𝑥, 𝑦); 𝜃 denotes the angle between the vector 𝜌 and the direction of the coordinate 𝑥; ∗ stands for the complex conjugate, while ((−1)𝑘 (𝑛 − 𝑘)!𝜌𝑛−2𝑘 /𝑘!((𝑛 + |𝑚|)/2 − 𝑉𝑛𝑚 (𝜌, 𝜃) = ∑(𝑛−|𝑚|)/2 𝑘=0 ̂ 𝑘)!((𝑛 − |𝑚|)/2 − 𝑘)!)𝑒𝑗𝑚𝜃 and 𝑗̂ = √−1, separately. After the edges are clockwise rotated at an angle of 𝜑𝑧 , the Zernike moments before and after the rotation show the following relationship: ̂
= 𝑀𝑛𝑚 𝑒−𝑗𝑚𝜑𝑧 . 𝑀𝑛𝑚
(5)
If the edges are rotated at an angle of −𝜑, the edges is parallel to the 𝑦 axis; thus ∬
𝑥2 +𝑦2 ≤1
𝑓 (𝑥, 𝑦) 𝑦 𝑑𝑥 𝑑𝑦 = 0,
(6)
where 𝑓 (𝑥, 𝑦) is the edge function acquired after the UAVRSI is rotated. When using Zernike moments to carry out edge detection in UAVRSI, it generally needs to use three Zernike moments of different orders with different repetitions, namely, 𝑀00 , 𝑀11 , and 𝑀20 . Their corresponding integral kernel functions
4
International Journal of Aerospace Engineering
(a) Data 1
(b) Data 2
Figure 3: Image of Anning area.
are 𝑉00 = 1, 𝑉11 = 𝑥+𝑗𝑦, and 𝑉20 = 2𝑥2 +2𝑦2 −1, respectively. Based on formulas (4) and (5), the corresponding relationship between the Zernike moments of UAVRSI before and after the rotation is written as 𝑀00
𝑀20
(7) ℎ=
= 𝑀20 .
According to formula (5), the imaginary part in the Zernike moments of the order one for one time in the rotated UAVRSI equals zero: when the edge is parallel to the 𝑦-axis, the imaginary part is equal to zero. We obtain ] = sin 𝜑 Re [𝑀11 ] − cos 𝜑 Im [𝑀11 ] = 0, Im [𝑀11
(8)
where Im[𝑀11 ] is the imaginary part of the rotated UAVRSI; Im[𝑀11 ] and Re[𝑀11 ] represent the imaginary part and the real part of the original UAVRSI, separately. According to formula (8), we obtain
𝜑 = tan−1 (
Im [𝑀11 ] ). Re [𝑀11 ]
(9)
Based on Figure 2, the following formulas can be acquired = ℎ𝜋 + 𝑀00
𝑘𝜋 − 𝑘 sin−1 (𝑙) − 𝑘𝑙√1 − 𝑙2 , 2
= 𝑀11
,
3
(10)
3/2
𝑀20
=
2𝑘𝑙 (1 − 𝑙2 ) 3
.
𝑀20 , 𝑀11 3𝑀11
3/2
2 (1 − 𝑙2 )
,
(11)
𝑀00 − (𝑘𝜋/2) + 𝑘 sin−1 (𝑙) + 𝑘𝑙2 √1 − 𝑙2 . 𝜋
After four parameters are determined, the formula for subpixel edge detection can be deduced from Figure 2: cos (𝜑) 𝑥 𝑥𝑘 ], [ ] = [ ] + 𝑙[ 𝑦 𝑦𝑘 sin (𝜑)
(12)
where (𝑥𝑘 , 𝑦𝑘 ) is the subpixel coordinate of the edge of the UAVRSI, while (𝑥, 𝑦) denotes the coordinate of the origin in Figure 2.
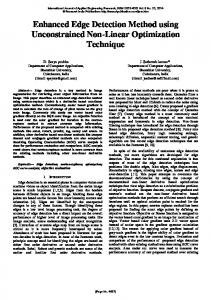
4. Description of the Data Sets To validate the effectiveness of the proposed method, two UAVRSI are selected as the experimental data sets. These two images are obtained in Anning of Yunnan province, China. The spatial resolution of these images is 0.1 m; these images show three wavebands, namely, red, green, and blue. The size of Data 1 is 1299 × 1066 pixels; data set 1 mainly covers buildings, woodland, bare land, roadway, and farmland, as demonstrated in Figure 3(a), while data set 2 primarily contains buildings, huts, farmland, and vegetation, as shown in Figure 3(b), and the size of Data 2 is 1415 × 1173 pixels.
5. Experiments and Results
3/2
2𝑘 (1 − 𝑙2 )
𝑙= 𝑘=
= 𝑀00 ,
𝑀11 = 𝑀11 𝑒𝑗𝜑 ,
On this basis, another three parameters are acquired
To verify the feasibility and effectiveness of the method, two groups of contrast experiments are performed. The first group is used to compare and analyze the results obtained using Zernike moments and the proposed method separately, while the results, respectively, acquired using Canny operator and
International Journal of Aerospace Engineering
(a) Zernike moments combined
5
(b) Zernike moments combined with 𝐾means clustering
(c) Zernike moments with FCM clustering
Figure 4: The results of first experiment for Data 1.
(a) Zernike moments combined
(b) Zernike moments combined with 𝐾means clustering
(c) Zernike moments with FCM clustering
Figure 5: The results of first experiment for Data 2.
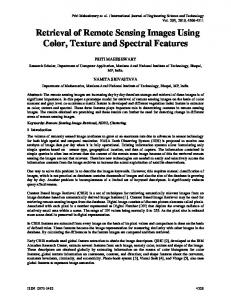
the proposed method are analyzed in the second group. In order to evaluate the experimental results, visual comparison and sensitivity [21] are adopted to simultaneously validate the accuracy of the proposed method. In the experiment 1, Zernike moments and the proposed method are, respectively, applied to carry out edge detection on the two groups of data presented in Figure 3, while Canny operator and the proposed method are adopted to detect the edges of the two groups of data shown in Figure 3, separately. Figures 4(a), 4(b), and 4(c) display the results, respectively, obtained by Zernike moments, Zernike moments combined with 𝐾-means clustering, and Zernike moments combined with FCM clustering (these results are from data set 1), while the results acquired using Zernike moments, Zernike moments combined with 𝐾-means clustering, and Zernike moments combined with FCM clustering from data set 2 are illustrated in Figures 5(a), 5(b), and 5(c). In addition, Figures 6(a) and 7(a), respectively, demonstrate the results using Canny operator from data sets 1 and 2. It can be found from Figures 4 and 5 that most information in UAVRSI is detected as edge points using Zernike moments; these cause the failure of recognizing the contour edges of ground objects. In contrast, the results obtained using the Zernike moments combined with 𝐾-means clustering and Zernike moments combined with FCM clustering are obviously superior to those obtained merely using Zernike
moments. These indicate that the proposed method can well detect ground objects with apparent shape features, while it shows poor performance in detecting vegetation, woodland, and farmland. Meanwhile, by comparing the parts circled in red in the right of Figures 5(b) and 5(c), it is known that the method combining Zernike moments with 𝐾-means clustering shows some missed edges in comparison with the Zernike moments combined with FCM clustering. This is because a large quantity of details is lost in the clustering using 𝐾-means, so many edge details are lost in edge detection. Therefore, the proposed method presents a high requirement for the clustering results: the clustering results directly influence the accuracy of the results obtained in edge detection. Table 1 also indicates that the results acquired using Zernike moments show a largest sensitivity, indicating that most edge points are detected using this method. Meanwhile, Figure 4(a) shows that largest amounts of pseudoedges are detected. Based on the sensitivity of the method integrating Zernike moments with 𝐾-means clustering and Figure 4(b), this method fails to detect a large number of edges with the lowest sensitivity. According to the sensitivity and Figure 4, the method combining Zernike moments with FCM clustering shows superior to others. It can be found from Figure 7 that using Canny operator can detect a large number of pseudocontour edges, which can be effectively solved by the proposed method. However, for
6
International Journal of Aerospace Engineering Table 1: Results of sensitivity.
Methods Data 1 Data 2
Zernike 0.041648 0.030556
(a) Canny operator
Zernike + 𝐾-means 0.023812 0.030104
Zernike + FCM 0.037703 0.035075
(b) Zernike moments combined with 𝐾means clustering
Canny 0.135656 0.091604
(c) Zernike moments combined with FCM clustering
Figure 6: The results of second experiment for Data 1.
(a) Canny operator
(b) Zernike moments combined with 𝐾means clustering
(c) Zernike moments combined with FCM clustering
Figure 7: The results of second experiment for Data 2.
the images in which most ground objects show fuzzy shape features, the proposed method presents little advantage in comparison with the Canny operator. This is because Canny operator is not a method for subpixel edge detection; it is more sensitive than Zernike moments and the proposed method.
6. Conclusion and Discussion To improve the accuracy of edge detection in UAVRSI, subpixel edge location algorithm is introduced into the edge detection of UAVRSI. On this basis, the edge detection of UAVRSI by combining Zernike moments and clustering algorithms is realized in this paper. Compared with the edge detection based on Zernike moments, the proposed method which is proved can significantly improve the accuracy of the detected results by comparing two groups of contrast experiments. Meanwhile, compared with Canny operator, the method in this research reduces the influence of the details of ground objects on the edge detection to some extent and
the detected pseudoedges of ground objects are obviously less than those using Canny operator based edge detection. Because of complex surface features, great spectral differences between the ground objects and the noise, the edge detection of UAVRSI is difficult. In order to solve these problems, a specific algorithm needs to deal with UAVRSI to obtain homogeneous regions in the same ground object, and then a specific edge detection operator is used for edge detection. The clustering algorithm is an effective method to generate homogeneous regions. In this paper, two kinds of classical clustering algorithms, FCM and 𝐾-means, were selected, and the results were satisfactory. In addition to the clustering algorithm, threshold segmentation and region segmentation are effective ways to obtain homogeneous regions; the combination of the two methods and edge detection method based on Zernike moments needs to be further verified. However, the proposed method also has the following problems: (1) The homogeneous regions are obtained by clustering algorithm, but part of edge information is lost in
International Journal of Aerospace Engineering this process. Thus the accuracy of edge detection is reduced. (2) In this paper, the traditional clustering methods are used to obtained homogeneous regions. It is difficult to select the cluster center using traditional clustering methods, and the different cluster centers will generate different results; this results in the uncertainty of the results. In order to realize the intelligent selection of cluster centers, clustering method combined with intelligent optimization algorithm is a good choice. (3) The proposed method is more effective for edge information extraction of the building (structure) and the road. However, it is not good enough for the edge detection of vegetation, trees, crops, and other objects, so this needs further study.
Competing Interests The authors declare that there is no conflict of interests regarding the publication of this paper.
Acknowledgments This research work was supported by the Talent Cultivation Foundation of Kunming University of Science and Technology (no. KKSY201521040) and the Science Research Foundation of Yunnan Educational Committee (no. 2016ZZX051).
References [1] S. Cao, J. Jiang, G. Zhang, and Y. Yuan, “An edge-based scale- and affine-invariant algorithm for remote sensing image registration,” International Journal of Remote Sensing, vol. 34, no. 7, pp. 2301–2326, 2013. [2] Y. Hu, J. Chen, D. Pan, and Z. Hao, “Edge-guided image object detection in multiscale segmentation for high-resolution remotely sensed imagery,” IEEE Transactions on Geoscience and Remote Sensing, vol. 54, no. 8, pp. 4702–4711, 2016. [3] X. Huang, L. Zhang, and P. Li, “Classification of very high spatial resolution imagery based on the fusion of edge and multispectral information,” Photogrammetric Engineering & Remote Sensing, vol. 74, no. 12, pp. 1585–1596, 2008. [4] S. Klonus, D. Tomowski, M. Ehlers, P. Reinartz, and U. Michel, “Combined edge segment texture analysis for the detection of damaged buildings in crisis areas,” IEEE Journal of Selected Topics in Applied Earth Observations and Remote Sensing, vol. 5, no. 4, pp. 1118–1128, 2012. [5] J. X. Wang, X. Y. Qi, and X. W. Li, “Edge and local energy NSCT based remote sensing image fusion,” Journal of the Graduate School of the Chinese Academy of Sciences, vol. 26, no. 5, pp. 657– 662, 2009. [6] A. Kiani and M. R. Sahebi, “Edge detection based on the Shannon Entropy by piecewise thresholding on remote sensing images,” IET Computer Vision, vol. 9, no. 5, pp. 758–768, 2015. [7] H. Vishwakarma and S. Katiyar, “Comparative study of edge detection algorithms on the remote sensing images using matlab,” International Journal of Advances in Engineering Research (IJAER), vol. 2, no. 6, 2011.
7 [8] B. Kaur and A. Garg, “Mathematical morphological edge detection for remote sensing images,” in Proceedings of the 3rd International Conference on Electronics Computer Technology (ICECT ’11), vol. 6, pp. 324–327, April 2011. [9] X. Guan and Z. Guan, “Edge detection of high resolution remote sensing imagery using wavelet,” in Proceedings of the International Conferences on Info-Tech and Info-Net (ICII ’01), vol. 301, pp. 302–307, IEEE, Beijing, China, November 2001. [10] G.-B. Xu, G.-Y. Zhao, L. Yin, Y.-X. Yin, and Y.-L. Shen, “A CNNbased edge detection algorithm for remote sensing image,” in Proceedings of the Chinese Control and Decision Conference 2008 (CCDC ’08), pp. 2558–2561, July 2008. [11] A. Jubai, B. Jing, and J. Yang, “Combining fuzzy theory and a genetic algorithm for satellite image edge detection,” International Journal of Remote Sensing, vol. 27, no. 14, pp. 3013–3024, 2006. [12] J. Xi and J.-Z. Zhang, “Edge detection from remote sensing images based on Canny operator and Hough transform,” Advances in Intelligent and Soft Computing, vol. 141, pp. 807–814, 2012. [13] K. F. Huang, X. Q. Yu, and L. Huang, “Edge detection method for remote sensing image based on PCNN and LOG operator,” Journal of Guizhou University, vol. 32, no. 5, pp. 29–32, 2015. [14] L. Huang, Y. Fang, X. Zuo, X. Yu, and S. Lu, “Edge information detection of remote sensing image based on two-dimensional Otsu algorithm,” Journal of Information and Computational Science, vol. 10, no. 16, pp. 5381–5390, 2013. [15] N. S. Mishra, S. Ghosh, and A. Ghosh, “Fuzzy clustering algorithms incorporating local information for change detection in remotely sensed images,” Applied Soft Computing, vol. 12, no. 8, pp. 2683–2692, 2012. [16] X. P. Feng and T. F. Zhang, “Comparison of four clustering methods,” Microcomputer & Its Applications, vol. 29, no. 16, pp. 1–3, 2010. [17] S. Xu, J. Liu, Y. Wang, and M. Hu, “Sub-pixel edge detection of color image based on principal axis analysis and EDISONZernike moment,” Yi Qi Yi Biao Xue Bao/Chinese Journal of Scientific Instrument, vol. 29, no. 11, pp. 2272–2277, 2008. [18] X. H. Ding, S. X. Deng, Y. Y. Yang, and Q. C. Zhao, “Subpixel edge detection based on spatial moments and Zernike moments,” Journal of Applied Sciences, vol. 22, no. 2, pp. 191–194, 2004. [19] S. Ghosal and R. Mehrotra, “Orthogonal moment operators for subpixel edge detection,” Pattern Recognition, vol. 26, no. 2, pp. 295–306, 1993. [20] J.-W. Cui and J.-B. Tan, “Algorithm for edge subpixel location based on Zernike moment,” Guangxue Jishu/Optical Technique, vol. 31, no. 5, pp. 779–785, 2005. [21] R. Medina-Carnicer, R. Mu˜noz-Salinas, A. Carmona-Poyato, and F. J. Madrid-Cuevas, “A novel histogram transformation to improve the performance of thresholding methods in edge detection,” Pattern Recognition Letters, vol. 32, no. 5, pp. 676– 693, 2011.
International Journal of
Rotating Machinery
Engineering Journal of
Hindawi Publishing Corporation http://www.hindawi.com
Volume 2014
The Scientific World Journal Hindawi Publishing Corporation http://www.hindawi.com
Volume 2014
International Journal of
Distributed Sensor Networks
Journal of
Sensors Hindawi Publishing Corporation http://www.hindawi.com
Volume 2014
Hindawi Publishing Corporation http://www.hindawi.com
Volume 2014
Hindawi Publishing Corporation http://www.hindawi.com
Volume 2014
Journal of
Control Science and Engineering
Advances in
Civil Engineering Hindawi Publishing Corporation http://www.hindawi.com
Hindawi Publishing Corporation http://www.hindawi.com
Volume 2014
Volume 2014
Submit your manuscripts at https://www.hindawi.com Journal of
Journal of
Electrical and Computer Engineering
Robotics Hindawi Publishing Corporation http://www.hindawi.com
Hindawi Publishing Corporation http://www.hindawi.com
Volume 2014
Volume 2014
VLSI Design Advances in OptoElectronics
International Journal of
Navigation and Observation Hindawi Publishing Corporation http://www.hindawi.com
Volume 2014
Hindawi Publishing Corporation http://www.hindawi.com
Hindawi Publishing Corporation http://www.hindawi.com
Chemical Engineering Hindawi Publishing Corporation http://www.hindawi.com
Volume 2014
Volume 2014
Active and Passive Electronic Components
Antennas and Propagation Hindawi Publishing Corporation http://www.hindawi.com
Aerospace Engineering
Hindawi Publishing Corporation http://www.hindawi.com
Volume 2014
Hindawi Publishing Corporation http://www.hindawi.com
Volume 2014
Volume 2014
International Journal of
International Journal of
International Journal of
Modelling & Simulation in Engineering
Volume 2014
Hindawi Publishing Corporation http://www.hindawi.com
Volume 2014
Shock and Vibration Hindawi Publishing Corporation http://www.hindawi.com
Volume 2014
Advances in
Acoustics and Vibration Hindawi Publishing Corporation http://www.hindawi.com
Volume 2014