segmentation of the original image is performed, and then selective images are analyzed. At the fifth stage, those subranges of first level decomposition from the ...
Radar Remote Sensing Images Segmentation Using Fractal Dimension Field V.K. Ivanov, R.E. Paschenko, O.M. Stadnyk, S.Ye. Yatsevich Institute for Radiophysics and Electronics, 12 Acad. Proskura Street, Kharkov 61085, Ukraine Abstract — A new method for image segmentation that makes it possible to divide the image into clusters having different fractal dimension is proposed. Tree-like structure of the algorithm proposed is easy for program implementation and allows making the process of radar images analyzing almost unsupervised. Results of the method testing on real radar images are presented. Index Terms — Remote sensing, radar imaging, image segmentation, fractals.
I. INTRODUCTION Analyzing experimental data collected from satellite, airborne, and ground-based radar sensors requires developing advanced visual, spectral and texture techniques, most of which are aimed at images segmentation for the subsequent classification [1]. Real radar images are complex, and their mathematical description requires a large number of independent parameters. From other side, it has been shown that geometrical features of some images can be described using fractal theory [2]-[3], in which only a few parameters are required to specify the structure observed. Fractal analysis of images of rough natural surfaces is based on the empirically observed and theoretically proven fact that under certain circumstances the intensity distribution across the image of a rough surface is also fractal, with a fractal dimension (FD) related to that of the mapped surface [4]-[5]. Currently in remote sensing fractal theory is the most popular mathematical model used for relating natural structures to abstract geometries [6]. First, fractal theory has been proposed as a mean for the sea-scattered signal analysis [7], later a mathematical demonstration was given that the signal scattered from a sea fractal surface maintains the main fractal characteristics of the sea surface [8]-[10]. Though the fractal dimension has been widely used in texture segmentation, a number of researchers have argued that a single FD may not fully represent textures [11]-[15]. This goal of the paper is to demonstrate the potential of concept of fractal dimension field (FDF) in radar images segmentation. Creation of FDF of the image and its histogram analysis, prior to the derivation of grey-level co-occurrence texture features from airborne sensor images, can increase image classification accuracy [16][18].
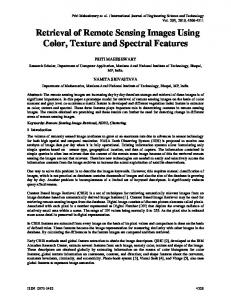
II. ALGORITHM OF IMAGE SEGMENTATION In the proposed approach, the image is considered as union of areas with the same fractal dimension, the value of which lies in the range 2 ≤ d ≤ 3 and can be fractional. Process of the image segmentation using fractal dimensions field can be divided into six stages. At the first stage, the image is "scanned" by the window having the size a × a pixels with the step s (if s = 1 the window will be "gliding", if s > 1 it will be "jumping"). After each step numerical value of the fractal dimension in the window should be calculated and put into the matrix Di, j , which is called Fractal Dimensions Field. At the second stage, minimum and maximum values and d max are calculated, and a range d min ∆D = d max − d min of fractal dimension variations in FDF is determined. At the third stage, the whole range of fractal dimension variations ∆D is split into K subranges of first level decomposition ( ∆D1 , ∆D 2 ,... ∆D K ). After this values of fractal dimension are rounded off to one decimal, and the length of subranges of first level becomes equal to 0.1 . For example, for d min = 2 and d max = 3 maximum number of intervals will be K = 10 . At the fourth stage, for each of subranges of first level decomposition, selective images that correspond to chosen ranges ∆D1 , ∆D 2 ,... ∆D K are obtained. Thus, preliminary segmentation of the original image is performed, and then selective images are analyzed. At the fifth stage, those subranges of first level decomposition from the set ∆D1 , ∆D 2 ,... ∆D K , which contain more clusters of fractal dimension, are selected. Initial values of fractal dimension in FDF are rounded off to two decimals. Then each i-th of subranges of first level is split into ten subranges of second level decomposition ∆Di1 , ∆Di2 ,... ∆Di10 , and the length of subranges of second level becomes equal to 0.01 . At the sixth stage, for each of subranges of second level decomposition, selective images that correspond to chosen ranges ∆D11 , ∆D12 ,... ∆D1K are obtained, and further segmentation of the original image is performed. In Fig. 1, the sequence of three level of decomposition building is shown.
Dmin
FDF
Dmax ∆Dk-1–∆Dk=0.1
∆D1
∆D2
...
...
∆Dk
...
... ∆Dkk-1–∆Dkk=0.01
∆D21
∆D22
...
...
In Fig. 3, the corresponding fractal dimensions field which was build using “jumping” ( s = 4 ) window of size 8 × 8 is shown. Fractal dimension was calculated through standard box counting procedure with the accuracy to within 0.0001. The whole range of FD variation was split into five subranges represented in Fig. 1b by different gray levels.
∆D2k
...
... ∆Dkkk-1–∆Dkkk=0.001
∆D221
∆D222
...
...
.
...
.
...
∆D22k
.
...
Fig. 1. The sequence of three levels of decomposition building.
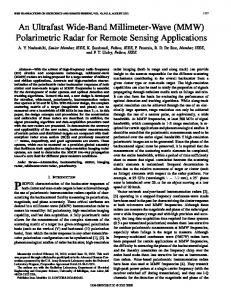
Fifth and sixth stages of the image segmentation can be iterated depending on the accuracy of fractal dimensions determination (rounding off) and needed degree of detailed elaboration (resolution). As example for future fractal analysis, consider the original radar image (of size 500 × 500 ) of the sea-earth border (Fig. 2), obtained in UHF band during experiments carried out at multifrequency radar complex MARS developed at the Institute for Radiophysics and Electronics (Kharkov, Ukraine). One can see a land on the right side of the image and a sea on the left side. Neither preprocessing nor image enhancement was performed and direct visual analysis does not allow to reveal features of the sea surface, which appears to be homogeneous.
Fig. 2.
The original radar image.
Fig. 3.
FDF of the original image.
Immediate analysis of the FDF shows that sea surface has some peculiarities (differences in gray levels) that cannot be seen in the radar image, but more detailed information is desired. III. RESULTS AND DISCUSSION To test the performance of the proposed method let us consider the segmentation of the image in Fig. 1. First, we build FDF using “gliding” window of size 8 × 8 and box counting algorithm for FD calculating. Then find that d min = 2.188 , d max = 2.995 and the range of fractal dimension variations ∆D = 0.807 . Hence, FDF processing should be performed in range from d min = 2.2 up to d max = 3.0 and ∆D = 0.8 . At the third stage, the whole range ∆D is split into K = 8 subranges of first level decomposition ( ∆D1 = 2.2 ÷ 2.3 , ∆D 2 = 2.3 ÷ 2.4 , ∆D3 = 2.4 ÷ 2.5 , ∆D 4 = 2.5 ÷ 2.6 , ∆D5 = 2.6 ÷ 2.7 , ∆D6 = 2.7 ÷ 2.8 , ∆D7 = 2.8 ÷ 2.9 , ∆D8 = 2.9 ÷ 3.0 ) and values of FD are rounded off to one decimal. At the fourth stage, for each first level subrange, selective images are obtained (some of them are shown in Fig. 4). Selective images are copies of original image on which areas corresponding to chosen range (or subrange) of FD are marked with white color.
(a)
(b)
(a)
(b)
(c)
(d)
(c)
(d)
Fig. 4. Selective images for some subranges of the first level. (a) ∆D5 = 2.6 ÷ 2.7 , (b) ∆D6 = 2.7 ÷ 2.8 , (c) ∆D7 = 2.8 ÷ 2.9 , (d) ∆D8 = 2.9 ÷ 3.0
Fig. 5. Selective images for some subranges of second level. (a) ∆D81 = 2.90 ÷ 2.91 , (b) ∆D86 = 2.95 ÷ 2.96 , (c) ∆D88 = 2.97 ÷ 2.98 , (d) ∆D89 = 2.98 ÷ 2.99
Thus, preliminary segmentation of the original image that corresponds chosen subrange of fractal dimension. The sea-earth border is clearly eliminated in Fig. 4(a); some areas of earth are localized in Fig. 4(b). In Fig. 4(c) and Fig. 4(d), one can easily separate surfaces of the sea and earth. It is seen how the first level decomposition allows one to perform preliminary image segmentation. At the fifth stage, first we select from ∆D1 , ∆D 2 , ∆D3 , ∆D 4 , ∆D5 , ∆D 6 , ∆D 7 , ∆D8 subranges for sequential segmentation. As can be seen from Fig. 4, large amounts of clusters are contained in subranges ∆D 7 and ∆D8 , which correspond to earth and sea surfaces, respectively. Thus, to perform more detailed study of sea surface presented at the original image we have to choose subrange ∆D8 = 2.9 ÷ 3.0 . Then values of fractal dimension in FDF are rounded off to two decimals, and subrange under study ∆D8 is split into ten subranges of second level decomposition: ∆D81 = 2.90 ÷ 2.91 , 82 810 , …, ∆D = 2.91 ÷ 2.92 ∆D = 2.99 ÷ 3.00 At the sixth stage, for each of subranges of second level ∆D81 , ∆D82 , …, ∆D810 selective images are build. Some of them are presented in Fig. 5, where one can see characteristic features of the sea and earth for ∆D81 and ∆D86 . At selective images in Fig. 5(c) and Fig. 5(d), corresponding to subranges ∆D88 and ∆D89 , the rise and fall of the waves with different wavelengths on the sea can also be clearly revealed.
Thus, the image segmentation corresponding to second level decomposition may be used for sea surface monitoring. For sequential more detailed segmentation at the next stage we again select the subrange, but now from the set ∆D81 , ∆D82 , …, ∆D810 . As can be seen from Fig. 5 (or can be evaluated through standard subroutine) most of clusters are contained in the subrange ∆D88 = 2.97 ÷ 2.98 . This subrange corresponds to rough sea and is chosen for sequential analysis. Now values of fractal dimension in FDF are rounded off to three decimals, and chosen eight subrange of second level decomposition ∆D88 is split into ten subranges of third level decomposition: ∆D881 = 2.970 ÷ 2.971 , ∆D882 = 2.971 ÷ 2.972 , …, ∆D8810 = 2.979 ÷ 2.980 . Then selective images are building for each from ten subranges of third level ∆D881 , ∆D882 , …, ∆D8810 . For shortness sake only four from these images ( ∆D881 , ∆D885 , ∆D888 , ∆D8810 ) are presented in Fig. 6. Analysis of selective images of third level decomposition Fig. 6(a) - Fig. 6(d) shows that we succeeded to reveal on the sea surface some wave structures, which are hidden on selective images of first level and are combined in large clusters. Correspondently, for this reason they cannot be analyzed in detail on selective images of second level.
The process of segmentation can be continued depending on needed level of resolution and the range of fractal dimension calculation, but usually for practice, it is enough to build only four levels.
Fig. 6.
(a)
(b)
(c)
(d)
Selective images for some subranges of third level.
(a) ∆D881 = 2.970 ÷ 2.971 , (b) ∆D885 = 2.974 ÷ 2.975 , (c) ∆D888 = 2.977 ÷ 2.978 , (d) ∆D8810 = 2.979 ÷ 2.980 . On selective images of fourth level decomposition (not shown here) fine structure of some waves on the sea surface can be studied. Thus, tree-like structure of the proposed method for gray-scale digital image segmentation is easy for program implementation and allows us unsupervised analysis and classification of radar remote sensing images. V. CONCLUSION The basis of the proposed fractal analysis of images is formed by building FD field. However, FDF building alone does not allow one to automate most of real image processing. The new method for unsupervised image segmentation based multilevel decomposition of the whole FD range of obtained FDF and sequential building of selective images is developed. The method can be used for natural surfaces monitoring and selecting observation areas. In the future, it would be interesting to test the proposed approach on other texture and polarimetric features.
REFERENCES [1] T. Toutin, “Geometric processing of remote sensing images: models, algorithms and methods,” International Journal of Remote Sensing, vol. 25, no. 10, pp. 1893-1924, 2004. [2] B.B. Mandelbrot, The Fractal Geometry of Nature. New York: Freeman, 1983. [3] K. Falconer, Fractal geometry: mathematical foundations and applications, New York: J. Wiley & Sons, 2003. [4] P. Pentland, “Fractal-based description of natural scenes,” IEEE Trans. Pattern Anal. Mach. Intell., vol. 6, no. 6, pp. 661-674, June 1984. [5] P. Kube and A. P. Pentland, “On the imaging of fractal surfaces,” IEEE Trans. Pattern Anal. Mach. Intell., vol. 10, no. 5, pp. 704–707, Sep. 1988. [6] J. Keller, R. Crownover, S. Chen, “Texture description and segmentation through fractal geometry,” Computer Vision Graphics and Image Processing, vol. 45, no. 2, pp. 150160, February 1989. [7] Y. Agnon and M. Stiassnie, “Remote sensing of the roughness of a fractal sea surface,” J. Geophys. Res, vol. 96, no. C7, pp. 12773-12779, July 1991. [8] J. Chen, T. K. L. Lo, H. Leung, and J. Litva, “The use of fractals for modeling EM waves scattering from rough sea surface,” IEEE Trans. Geosci. Remote Sensing, vol. 34, pp. 966-972, July 1996. [9] F. Berizzi, E. D. Mese, G. Pinelli, and G. Andreoli, “Onedimensional fractal model of sea surface,” in Inst. Elect. Eng. Proc. Radar, Sonar, Navigat., vol. 146, pp. 55-66, Feb. 1999. [10] F. Berizzi, E. Dalle-Mese, “Fractal Analysis of the Signal Scattered from the Sea Surface,” IEEE Trans. Antennas Propagat., vol. 47, no. 2, pp. 324-338, Feb. 1999. [11] B. B. Chaudhuri, N. Sarkar, P. Kundu, “An improved fractal geometry based texture segmentation technique,” Proc. IEE Part E, vol. 140, no. 5, pp. 223-241, 1993. [12] B. B. Chaudhuri, N. Sarkar, “Texture segmentation using fractal dimension,” IEEE Trans. on Pattern Anal. and Machine Intell., vol. 17, no. 1, pp. 72-77, Jan. 1995. [13] N. Sarkar and B. B. Chaudhuri, “Multifractal and generalized dimensions of gray-tone digital images,” Signal Process., vol. 42, pp. 181–190, Mar. 1995. [14] P. Martinez, D. Schertzer, and K. K. Pham, “Texture modelization by multifractal processes for SAR image segmentation,” in Proc. Radar, 1997, pp. 135–139. [15] R. Fazel-Rezai and W. Kinsner, “Texture analysis and segmentation of images using fractals,” in Proc. IEEE Canadian Conf. Electrical Computer Engineering, May 9– 12, 1999, pp. 786–791. [16] V. K. Ivanov, R. E. Paschenko, O. M. Stadnyk, S. Ye. Yatsevich, “Fractal analysis of forestry images,” Uspekhi sovremennoi radioelektroniki, no. 12, pp. 55-62, Dec. 2005. (in Russian) [17] R. E. Paschenko, Ed., Fractal Analysis of Processes, Structures and Signals, Kharkov: EcoPerspectiva, 2006. 348 p. (in Russian) [18] V. K. Ivanov, R. E. Paschenko, O. M. Stadnyk, S. Ye. Yatsevich, “Damaged forests: detection using airborne SAR images,” Int. Workshop on Microwaves, Radar and Remote Sensing (MRRS-2005) Dig. (Kiev, Ukraine), pp. 115-120, September 2005.