EMPEDOCLES. HERACLITUS. KANT. SCHELER. PARMENIDES. PLATO. NIETZSCHE. Figure 8. Exploratory pivoting along philosophers' influences from ...
EdgeMaps: Visualizing Explicit and Implicit Relations Marian D¨ork, Sheelagh Carpendale, and Carey Williamson University of Calgary, Canada ABSTRACT In this work, we introduce EdgeMaps as a new method for integrating the visualization of explicit and implicit data relations. Explicit relations are specific connections between entities already present in a given dataset, while implicit relations are derived from multidimensional data based on shared properties and similarity measures. Many datasets include both types of relations, which are often difficult to represent together in information visualizations. Node-link diagrams typically focus on explicit data connections, while not incorporating implicit similarities between entities. Multi-dimensional scaling considers similarities between items, however, explicit links between nodes are not displayed. In contrast, EdgeMaps visualize both implicit and explicit relations by combining and complementing spatialization and graph drawing techniques. As a case study for this approach we chose a dataset of philosophers, their interests, influences, and birthdates. By introducing the limitation of activating only one node at a time, interesting visual patterns emerge that resemble the aesthetics of fireworks and waves. We argue that the interactive exploration of these patterns may allow the viewer to grasp the structure of a graph better than complex node-link visualizations. Keywords: Information visualization, explicit and implicit relations, graph drawing, dimensionality reduction.
1. INTRODUCTION An important goal of information visualization is to expose different types of relationships within abstract data. Through interaction, the viewer can be enabled to find and understand connections between bits of information. Relations can be explicitly present in a dataset as links that specifically connect information items or implicitly by inferring relations based on similarity of attributes. For both types of relationships—explicit and implicit— several visualization techniques have been proposed and refined over the recent years. Two of the most popular techniques for visualizing relations are node-link diagrams (NLD) and multidimensional scaling (MDS). On the one hand, NLD techniques are usually applied to explicit relations or connections that are visualized as edges between nodes representing, for example, online communities, computer networks, or linked web pages. On the other hand, MDS is typically used for implicit relations between documents or other types of multidimensional data. MDS spatializes attribute similarities between items by placing similar items in close proximity to each other and less similar items further apart. While NLD and MDS techniques are widely used, they both have significant limitations with regard to readability and interpretability of the resulting visualization. Layout algorithms for NLD visualizations are typically optimized for reducing edge crossings, with the side effect that node positions are not utilized as a meaningful visual variable. Furthermore, as the number of edges increases, it becomes hard to distinguish directionality, if present, and identify high-degree nodes. The resulting visualization of an MDS algorithm, on the other hand, lacks a guiding structure to put elements into context with each other, besides using position. It is often difficult to understand the meaning of the positional proximity of elements. We argue that the limitations of both techniques could be attributed to the fact that they are constrained to either explicit or implicit relations, yet, many datasets feature both types of relationships. In this paper, we explore how both explicit and implicit relations can be visualized as EdgeMaps ∗ , integrated views that combine graph drawing and spatialization. EdgeMaps integrate NLD and MDS techniques utilizing both visual linkage and proximity for the representation of complex—explicit and implicit—relations between items. The intent behind this approach is to make effective use of visual variables that have been underutilized in NLD and MDS techniques. ∗
Interactive demo available: http://mariandoerk.de/edgemaps/demo/
1
50 19
40 19
30
19
19
20
10
19
19
00
90 18
80
60
18
18
18
18
20
50
SARTRE
18
00
40
00
20
17
17
-2
17
00
00 10 00 13 00 16 00
ABOUT
-4
00
-6
-5
00
! TIME LINE
KIERKEGAARD
BEAUVOIR FOUCAULT DEWEY
KANT
BUTLER KITARO
MERLEAU-PONTY
HERACLITUS
HEGEL
SPINOZA HARTMANNBRADLEY HABERMAS MCTAGGART
MACHIAVELLI
BOOKCHIN STIRNER ENGELS
CANTERBURY
MARX
LOTZE OAKESHOTT KORSCH GRAMSCI
DIETZGEN STEINERMCDOWELL LAKATOSSCHELLING DESCARTES DELEUZE POPPER
DERRIDA !I"EK TAYLOR
DANTO
LUKáCS CROCE
HEIDEGGER BADIOU
LéVI-STRAUSS
ARISTOTLE ADORNO
BRANDOM
Georg Wilhelm Friedrich Hegel (IPA: [ˈgeɔʁk ˈvɪlhɛlm ˈfʁiːdʁɪç ˈheːg#l]) (August 27, 1770 – November 14, 1831) was a German philosopher, and with Johann Gottlieb Fichte and Friedrich Wilhelm Joseph Schelling, one of the creators of German idealism. Hegel influenced writers of widely varying positions, including both his admirers (Bauer, Feuerbach, Marx, Bradley, Dewey, Sartre, Küng, Kojève, !i"ek), and his detractors (Schelling, Kierkegaard, Schopenhauer, Nietzsche, Peirce, Russell). Hegel...
LACAN
LEGEND SIGNIFICANCE 1
degree of influence
54
B
A
C
19
40 19
30
20
19
19
10
00 19
90
50 R
E TL BU
LS W
TO PU CA O IM TT VA Y RTM RI A O ROO TTDA BL ARI S GEUR IAM D L IL W LT AU UC E FO UZ LE
DE
RA
US
M
CA
TY ON
IR - P VOAU AULE BEER T HO NC
M
A S BL NA VI E Lé RTR SA N O OR AD
IN
S
M
US
RA ST
R
54
B
W
E AU
INFLUENCE A
A R EIN NJ GEST EG N ID GE HEITT
NH
SIGNIFICANCE 1
BE
R
RER BEEL H BU SC
NE EI ST
E NI
IR
PE HO
NT
E ON H RD SC GO TZ
SP
SC
S
O AT
KA
A OZ IN SP CAL
PA
PL
P HE
ESS CILDES DEONITU PEMCL EMAR RA
Friedrich Wilhelm Nietzsche (October 15, 1844 – August 25, 1900) (German pronunciation: [ˈfʁiːdʁɪç ˈvɪlh!lm ˈniːtʃ!]) was a nineteenth-century German philosopher and classical philologist. He wrote critical texts on religion, morality, contemporary culture, philosophy, and science, using a distinctive German language style and displaying a fondness for metaphor and aphorism. Nietzsche's influence remains substantial within and beyond philosophy, notably in existentialism and postmodernism....
LEGEND
degree of influence
18
18
80
70
60
18
18
50 18
40
20 18
18
00 18
60 17
30 17
20
00
30
17
17
16
00
00
00
14
16
12
0 10
00
-4 00
ABOUT -3
-5 00
-6 00
! INTEREST MAP
19
INFLUENCE
A influenced B, and B influenced C
C
A influenced B, and B influenced C
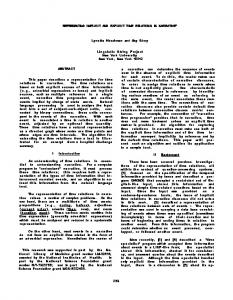
Figure 1. Visualizing influence relations between philosophers using an interest map (top) and a timeline (bottom).
As a case study for this paper, we have chosen a dataset of philosophers from the Freebase† data community. While there are many biographical records associated with philosophers, a particular interesting aspect of this dataset is the existence of influence connections between philosophers, which are a type of explicit relationship. On the other hand, birthdates, interests, and professions can be seen as attributes that indicate implicit relations †
http://www.freebase.org
2
between philosophers. We chose these dimensions as they provide a compelling use case for the visualization of explicit and implicit relationships. For example, visualizing influences between philosophers as edges may indicate which philosophers had more impact, yet, it is not possible with these links alone to see the extent of the impact a philosopher had across time and interests. However, positioning philosophers based on birthdates or interests can make the extent of influence much clearer (see Figure 1). The remainder of the paper is structured as follows. First, we will provide a brief overview of prior work on visualizing complex, multidimensional data (Section 2). Then we formulate our main design goals (Section 3) and describe the dataset we use to exemplify the techniques introduced by this work (Section 4). Based on the design goals and the example dataset, we introduce EdgeMaps as a method for visualizing both explicit and implicit relations (Section 5). We discuss novel ways for exploring complex data relations (Section 6) and critically assess limitations and open questions of this work (Section 7), before we conclude this paper.
2. RELATED WORK As visualizing relationships is at the heart of information visualization (infovis), our work builds upon many previous contributions in the field of infovis, in particular with regard to the use of visual variables, graph drawing methods, and casual visualization. While not part of his visual information-seeking mantra (“Overview first, zoom and filter, then details-ondemand”), Shneiderman notes the challenge of being able to explore relationships between information items.1 He stresses the importance of interaction for relating data entries, however, equally if not more important are the appropriate visual representations of different types of relations. To think about representing relationships visually it is worth considering the visual variables that are at our disposal. In Semiology of Graphics, Bertin distinguishes between eight visual variables: size, value, texture, colour, orientation, shape, and the two dimensions for the position on the plane.2 MDS renderings use planar position as the primary visual variable, while NLDs typically rearrange position in order to minimize edge crossings. Stone makes the case that colour can make visualizations more effective and beautiful when used well.3 She shows how colour can be used for labelling and quantifying data. It would be interesting to explore the use of colour for conveying similarity between items as a degree of association or disassociation in Bertin’s terms. There has been extensive research on drawing and interacting with NLDs,4 often with the goal of minimizing edge crossings, which is one of several geometrical and graph-theoretical metrics for graph aesthetics.5 Recent additions to this research include EdgeLens, a technique for interactively exploring overlapping edges,6 and Edge Bundles, a method for combining edges with similar paths.7 While these contributions significantly improve the readability of large NLDs, we argue that we should de-emphasize the role of edges and acknowledge more the contextual attributes of nodes. In an early work on computer network visualizations, visualization of edge attributes (e. g., flow, capacity, utilization) was seen as more important than the actual network topology.8 As part of a social network visualization it was shown how the visual representation of number of friends, gender, and community structure enriches the NLD and allows for interactive filtering.9 While conventional NLD techniques focus almost entirely on explicit relations, MDS can be seen as a complementary approach focussing on proximity as a visual representation of implicit relations or similarity. MDS has been used for document visualizations with the goal to visually convey thematic patterns and relationships of text collections.10 While the idea of spatializing document collections based on their similarities or differences is promising, the resulting galaxies and themescapes still appear abstract and difficult to interpret. An approach to making MDS more interactive focused on steering the algorithm, but did not look at using interactivity to make the MDS view more meaningful and accessible.11 Besides linkage and similarity, another important type of relation is based on the temporal dimension and references between temporally structured items. Considering that time is generally seen as a linear dimension, the challenge is to visualize relations and references between items that are mapped onto a linear axis. Arc diagrams show cross-references along a linear axis by adding visual semicircles to linear visualizations of documents, music pieces, and DNA sequences.12 Further exploring the possibilities of such arcs, arcs have also been used to visualize email threads.13 It was shown how the combination of arcs displayed above and below the main axis improved readability. 3
Several infovis contributions have looked at enriching and combining techniques for visualizing different types of relations. For example, a visual document hierarchy was accompanied with arcs representing cross-references between different sections.14 Furthermore, NLDs were made more readable by assigning nodes into multiple regions and allowing for interactive edge filtering.15 Another approach suggests the three-dimensional juxtaposition of different visualizations on panes and linking corresponding nodes using edges between the panes.16 All these techniques underline that there is a need for integrating explicit and implicit relations and enabling their interactive exploration, however, there is a tendency to emphasize one over another.
3. DESIGN GOALS The motivation behind this work is the multitude of datasets that feature both explicit and implicit relations and preliminary research on complementing the visualization of one type of relation with aspects of the other. For this work, we understand explicit relations as data relations that specifically connect data entities and are already present in the dataset. As implicit relations we see data relations that are not defined in the dataset and need to be inferred based on similarities between data entries. Explicit linkage between items has been the mainstay of graph drawing research. On the other hand, there are numerous implicit similarities based on different kinds of parameters and dimensions that can be used for data spatialization. With this work we are exploring the space of integrating the visualization of both explicit and implicit data relations in order to reveal previously unseen patterns. In particular, we aim at supporting people in viewing complex datasets and exploring relationships between information entries in a pleasing and engaging way. This translates into the following design goals: • Integrate multiple relationships. Explicit and implicit relations should be visually represented as linkage and layout in ways that mutually support each other. • Show invisible data patterns. By integrating explicit and implicit data connections, the visualization should provide novel, interesting patterns that were not visible before. • Support serendipitous exploration. The visualizations should allow viewers to find unexpected insights and easily follow their interests. The interactivity necessary should be effortless without requiring training. • Display additional information. The interface should provide detail-on-demand operations allowing the viewer to learn more about particular data entries and go back to the data source. • Provide aesthetic visuals. The colours, shapes, and transitions used by the visualization should satisfy both utility and visual appeal, making the interaction pleasant and evoking curiosity.
4. DATASET AND DIMENSIONS We parsed data on philosophers from the Freebase website using their HTTP-based API. Freebase offers structured information about many entities. In the case of philosophers, Freebase provides data about interests, professions, birthdates, influence connections, and other relations from Wikipedia. For the purpose of this paper, we have constrained the dataset to philosophers that influenced at least one other philosopher, resulting in 142 philosophers. For each philosopher we store the name, birthdate, description, an image, interests, and professions. Furthermore, we store the directed influence links between philosophers, which we consider as explicit relations. In contrast, we will use interests and professions for computing similarities between philosophers as implicit relations. The birthdates can also be regarded as another type of implicit relation as it implicitly links philosophers of similar epochs. For storing these records, we used a MySQL database that is easily accessible from the server-side part of this visualization, which was written in PHP. Using these attributes, several interesting dimensions can be inferred and explored. For example, we can calculate the degree of influence as a measure of significance using the sum of outgoing influence. In other words, the more philosophers a particular philosopher has inspired and influenced, the more significant this philosopher is. Based on birthdates, philosophers can be grouped into similar epochs. Likewise, using the interests and professions, philosophers can be grouped by their “trade”. Combining birthdates and interests/professions with 4
the influence connections, one can look at the impact of a philosopher across time and trade. So, for example, as Nietzsche was considered influential by many subsequent philosophers, his impact is one of great temporal extent (see Figure 1, bottom). Similarly, considering all the philosophers that were influenced by Hegel, his impact extended over a wide range of interests and professions (see Figure 1, top). These relations, however, are not easily accessible by just looking at tables or reference pages on websites such as Freebase or Wikipedia.
5. VISUALIZING EXPLICIT AND IMPLICIT RELATIONS To develop a way of representing both explicit and implicit relations, we introduce EdgeMaps as a visualization method that integrates spatialization and graph drawing techniques. EdgeMaps encode explicit relations as curved edges and implicit relations as node position. Other visual variables are used to double-encode these data relations and introduce additional information such as directionality and distinctness.
5.1 Implicit Relations as Layout To represent the implicit relations, we designed two general layouts: an interest map and a timeline (see Figure 2). While both visualization layouts represent philosophers as nodes and influences as links, as we will describe in more detail later, the layouts differ in the way the positions on the plane are utilized. The interest map represents the similarity of philosophers based on their philosophical interests and professional occupations. The timeline uses birthdates as an ordering criteria to arrange philosophers along a temporal axis.
Interest Map
Timeline
Figure 2. Layouts for philosopher visualizations based on common interests and professions (left) and on birthdates (right).
Interest map. The node positions for the interest map were computed using the MDS function of R‡ , a statistical software environment. Before that, interests and professions data had to be transformed into a vector model for which the Euclidian distances could be used by the MDS algorithm. The result is a pair of x,y coordinates for each philosopher, with each coordinate value between -1 and 1. Depending on the size of the window, these coordinates are then scaled to the actual display resolution. However, the aspect ratio of the MDS output is not modified based on the window, since the proximity of the resulting plane configuration is generated on the basis of similarity. Stretching the layout would confound the representation of similarities, which are mapped to positions on the plane using their Euclidian distances. As there may be philosophers with identical attributes, the MDS algorithm could return items with the same positions, posing an occlusion problem. Considering that MDS is an approximation after all, the current layout method positions overlapping nodes slightly apart so that they are still close but not occluding each other. Timeline. The timeline maps birth year to position on the plane. Initial trials with a simple time axis failed, because there were dense clusters of philosophers in some epochs and very sparse or empty periods during other times. For the 142 philosophers, we decided to neglect exact temporal distances and focussed on temporal sequences of philosophers instead. This still allows for relative temporal comparisons of ‘earlier’ and ‘later’ philosophers and, at the same time, accommodate all philosophers along the axis. The result of this ‘stringing’ of nodes along the axis has the effect that certain periods take up much more display space than others. A time legend displayed on top of the time view is designed to convey this temporal folding. ‡
http://www.r-project.org/
5
5.2 Explicit Relations as Curved Edges The layouts for topical and temporal similarities—interest map and timeline—represent only the implicit relations between philosophers. In order to represent influences between philosophers as explicit relationships, edges are drawn between the nodes. If all influence edges were to be shown for all philosophers, there would be far too many edges to be actually readable, let alone interpretable. However, by activating only one philosopher at a time, it is possible to read individual edges and differentiate between two types of influence: • Incoming influence. The philosopher is inspired by previous philosophers and builds upon their work. • Outgoing influence. The philosopher has affected other philosophers who built upon his/her work.
A
B
C
Figure 3. With node B being selected, there are two types of edges: incoming (left) and outgoing (right).
To visually differentiate between these two types of edges, we used the following visual parameters: curvature, directionality, shape, value, and colour (see Figure 3). Curvature. Edges are curved depending on their distance between the connected nodes. In the interest map this curvature is smaller than in the timeline view. Incoming edges are curved downward and outgoing edges are curved upward. The idea is that incoming influence stands for the foundation upon which a philosopher builds their work. For the outgoing influence, the edge is curved upward, as a visual depiction of outreach beyond previous work. Taken together, both types of edges form a wave-like shape when nodes are arranged in a sequential order. Directionality. Incoming and outgoing edges differ also with regard to how directionality is represented. As we assume that only one philosopher is activated at a time, it is evident that this philosopher’s node will have multiple incoming and outgoing edges, while all other philosophers will have at most two associated edges. This means to represent edge directionality, there is much less clutter around the unselected philosophers that are associated with the active philosopher. Therefore the incoming edges have arrow-like cuttings at their source nodes, whereas the outgoing edges coming from the active philosopher have arrows at the destination nodes. This way the edge endings at active philosophers are simple and thin allowing for many discernible edges. Shape. An additional way to visually differentiate the edges is by their shapes. Incoming edges are drawn significantly thicker than the outgoing edges. While there is no inherent reason why incoming edges should be thicker than outgoing edges, giving them these two distinct shapes allows for easy distinction with multiple edges displayed at the same time. Opacity. To balance out the different visual weights resulting from thick and thin edges, the opacity of the incoming edges is decreased. Using opacity instead of adjusting brightness for the incoming edges also reduces the occlusion of other elements due to incoming edges. Colour. Since the nodes representing philosophers have different colours, the outgoing influence edges take on the colour of the active philosopher, and the incoming edges share the colour with the originating node. The mapping of position to colour is discussed in the following section.
5.3 Encoding Redundancy with Size and Colour Besides showing influence connections for the active philosopher, the significance of a philosopher should be immediately visible without any interaction. For this, we define significance as the relative degree of outgoing influence, since a more significant philosopher arguably had more influence on their philosopher peers and successors. To visually represent this measure, we encoded significance as the size of each philosopher’s node. While we experimented with different types of glyphs, we decided that simple circles with varying sizes were the most appropriate, with which additional clutter could be avoided. 6
Furthermore, we decided to use colour to double-encode similarity based on philosophers’ interests and professions. Since the output of the MDS algorithm provides a spatialization of this relationship, we used it in combination with the HSV (hue, saturation, value) colour space as the basis for the colour calculation (see Figure 4, left). We decided to map broad interest regions to hue and the distance to the centre to saturation, while keeping the brightness constant. The idea behind this encoding is that the further out a philosopher is located, the more distinct this philosopher is from all other philosophers. Translating this notion of distinctness to a colour space, it would seem intuitive that the more distinct items would be more saturated and the more common items would be less saturated. However, keeping the value constant means that either the nodes in the centre would be too bright or the nodes on the periphery too dark. Therefore, we took the distance-to-centre measure into account for the value resulting in well-visible, grey-like nodes in the centre and more colourful nodes towards the outside. 40
30
50 19
19
19
20
10 19
19
00
90
19
18
60
80 18
SARTRE
18
50
20 18
18
40
00 18
00
20
17
17
17
-4 00 -2 00 90 0 13 00 16 00
-6 00 -5 00
! TIME LINE
90°
PETTY
BEAUVOIR
hue
ARENDT FOUCAULT CAMUS
saturation
BARTHES
SMITH
MERLEAU-PONTY
SPINOZA
180°
MARX MOSCA
COHEN CASTORIADIS BERLIN MCCABE DIETZGEN
RAWLS BALIBAR GRAMSCI KORSCH
DERRIDA !I"EK ALTHUSSER CROCE LUKáCS LYOTARD BADIOU
LéVI-STRAUSS
CHOMSKY
LEGEND SIGNIFICANCE degree of influence
1
B
270° C
HEGEL
BOOKCHIN STIRNER
0°
47
KANT
HABERMAS WEIL
1
54
B
INFLUENCE A
A influenced B, and B influenced C
C
RANCIèRE
BENJAMIN
LAKATOS
PUTNAM
ADORNO
Karl Heinrich Marx (May 5, 1818–March 14, 1883) was a German philosopher, political economist, historian, sociologist, humanist, political theorist, and revolutionary credited as the founder of communism. Marx summarized his approach to history and politics in the opening line of the first chapter of The Communist Manifesto (1848): “The history of all hitherto existing society is the history of class struggles.” Marx argued that capitalism, like previous socioeconomic systems, will produce...
was influenced by C
Figure 4. Colours are derived from MDS positions using distance from the centre for saturation and the angle around the centre for the hue (left). Incoming edges are coloured according to the source node and outgoing edges have the colour of the active node (right).
Based on this approach, every node receives a distinct colour, which is also used for the outgoing influence edges associated with this node. As shown in Figure 4 right, the active philosopher’s outgoing edges have the colour of this philosopher and the incoming edges have the respective colours of their philosophers. This further helps to distinguish the edge types and associate edges with their corresponding source nodes.
5.4 Yarn Balls vs. Fireworks and Waves After having discussed the representation of implicit and explicit relations individually, we will discuss in the following how these representations come together in novel formations. While exploring several design options, we examined the possibility of activating multiple philosophers at the same time. The result is an example of the “yarn ball” effect for complex NLDs, conveying neither overview nor structure (see Figure 5, left). In contrast, displaying only the edges associated with one individual node opens up novel possibilities (see Figure 5, middle and right) for graph visualization and interaction. As discussed before, this way it becomes possible to actually distinguish between edge types and directions. Furthermore, considering that the node size reflects the number of outgoing edges, one could argue that differing node sizes may be a more effective way to convey general overviews over a dataset. Instead of displaying many edges that make it even harder with increasing number of nodes and edges, it seems to be more effective to use colour, position, and size for nodes to provide context and overview (see Figure 4, left and Figure 6, top left). An interesting structure emerges when selecting a philosopher in the interest map with incoming and outgoing edges rendered in patterns of fireworks (see Figure 5). Less significant philosophers (e.g., Lacan) result in more 7
! TIME LINE
! TIME LINE
SARTRE
SARTRE
STRAUSS
KIERKEGAARD
STRAUSS
KIERKEGAARD
AQUINAS
AQUINAS PETTY
SCOTUS
WEININGER
BEAUVOIR
HUME
WEININGER
FOUCAULT
MAIMON
MAIMON
KANT
MERLEAU-PONTY
BRADLEY
SPINOZA
SPIR
HUSSERL LYOTARD
HEIDEGGER
NIETZSCHE
HEIDEGGER
BERKELEY
STRAWSON
BADIOU
PUTNAM
WITTGENSTEIN
WITTGENSTEIN LéVI-STRAUSS
CHOMSKY
WHITEHEAD
0
00
19 1
CHOMSKY
19
18
18 90
80
ADORNO
18 60
18 20
18 00
17 70
0
RANCIèRE
17 30
MACH
ADORNO
17 2
0
WHITEHEAD
17 0
16 30
16 00
13 00
BAUMGARTEN CROCE
LUKáCS
PUTNAM
ARISTOTLE RANCIèRE
00 20 0
-5
BUBER
PASCAL
-4
00
00
DESCARTES
DELEUZE POPPER
ALTHUSSER
RYLE DEMOCRITUS
ANAXIMANDER
-6
DESCARTES
DELEUZE POPPER LAKATOS
BERKELEY HUSSERL RORTY LYOTARD STRAWSON
HEIDEGGER
LéVI-STRAUSS
SCHELLING CARNAP
DERRIDA
BAUMGARTEN CROCE BACHELARD
BADIOU
VATTIMO
BERGSON
DAVIDSON
SCHELLING CARNAP
EMPEDOCLES
LOCKE
SELLARS AYER
SELLARS DAVIDSON
PLATO
NIETZSCHE
SPIR
RENOUVIER RICOEUR
GUATTARI
AYERBERGSON
DERRIDA BUBER
LUKáCS
MALEBRANCHE
HAYEK RAWLS
BENJAMIN
LOCKE
HEGEL
SCHOPENHAUER
MARX
MALEBRANCHE
RENOUVIER
PARMENIDES
ALTHUSSER
ENGELS
CANTERBURY
SCHOPENHAUER
FOOT HAYEK
RICOEUR BLANCHOT
18 50
BALIBAR GUATTARI KORSCH GRAMSCI
18 40
BERLIN
LéVINAS RAWLS
! INTEREST MAP
SPINOZA
MISES HAREREINHOLD GORDON
MACH
SCHILLER
ADORNO
40
HOBBES
MARX
BRADLEY
BARTHES
SOCRATES
OCKHAM REINHOLD GORDON STIRNER ENGELS HARE SCHELER
KANT
MERLEAU-PONTY
HEGEL
HEGEL
30
WEIL MISES
BARTHES
19
HERACLITUS SMITH CAPUTO
19
CAMUS
20
MILL
HUME
ARENDT FOUCAULT
ARENDT
19
BEAUVOIR
SCHILLER
LACAN
LEGEND
LEGEND
Jacques-Marie-Émile Lacan (French pronounced [!ak lak!"]) (April 13, 1901 – September 9, 1981) was a GADAMER
Aristotle Karl Heinrich (Greek: Marx ()*+,-,./01, (May 5, 1818–March Aristotél2s)14, 1883) was a
GADAMER
SIGNIFICANCE René Immanuel (384 German Descartes BCWilhelm –philosopher, Kant 322 BC) (IPA: (French Nietzsche was [!'manu"l political pronunciation: a Greek (October economist, kant]; philosopher, 15, 22[$&ne April 1844 historian, deka$t]), 1724 – a August student – of French psychoanalyst and psychiatrist who made prominent Figure 5. Displaying influence edges in the interest Friedrich map for five philosophers 25, (31 12 Plato sociologist, 1900) March February and(German 1596 teacher humanist, 1804) – 11 pronunciation: of was February Alexander political an 18th-century 1650), theorist, the [#f$i%d$!ç Great. also and German known Herevolutionary wrote philosopher as on Renatus many (left) and one philosopher at a time (middle contributions to psychoanalysis, philosophy, and literary #v!lh&lm Cartesius from subjects, credited the#ni%t'&]) Prussian (Latinized as including thewas founder city physics, aform), nineteenth-century of of Königsberg was communism. metaphysics, a French (now philosopher, German poetry, Kaliningrad, theater, theory. He gave yearly seminars, in Paris, from 1953 until philosopher mathematician, Russia). music, Marx summarized logic, Heand isrhetoric, regarded scientist, classical hispolitics, approach and as philologist. one writer government, oftothe who history Hemost wrote spent and ethics, influential critical most politics ofresemble his in the and right). With a single activated philosopher, influence edges arguably the shape of fireworks. Less influential 1981, most influencing France's intellectuals in the 1960s texts adult thinkers biology opening on lifereligion, and in ofline the modern zoology. ofDutch morality, theEurope first Republic. chapter contemporary andHe ofofthe has Thelate been culture, Communist Enlightenment. dubbedManifesto the and the 1970s, especially the post-structuralist philosophy, "Father Kant Together (1848): of“The Modern with andahistory Plato science, new Philosophy," widespread and of all using Socrates hitherto aand distinctive perspective (Plato's existing much ofteacher), German society subsequent in philosophy islanguage INFLUENCE B created philosophers. His interdisciplinary work is Freudian, philosophers have sparser edge patterns (middle) than more influential ones (right). style Western which Aristotle the and history influenced philosophy displaying is one of class of philosophy the a is struggles.” fondness a most response important through for Marx to metaphor his the argued founding writings, 21st and that Century. figures which aphorism. in He INFLUENCE B featuring the unconscious, the castration complex, the
SIGNIFICANCE
1
degree of influence
1
degree of influence
47
47
A
A
C
LEIBNIZ
C
LEIBNIZ
B influenced A, and B was influenced by published C to Nietzsche's continue also Western capitalism, philosophy. be influence like studied important previous remains He closely was works socioeconomic substantial the to of this first epistemology, day. to create systems, within In particular, aand aswill beyond well as
B influenced A, and B was influenced by C
ego;...
philosophy, his works comprehensive produce... Meditations relevant notably on to system religion, First in existentialism Philosophy of law, Western andcontinues... and philosophy,... history.... postmodernism....
! INTEREST MAP
19
40 19
30
20 19
10
19
00 19
90 18
80 18
18
18
60
50
40
18
18
20
00 18
70 17
30 17
20 17
00 17
16
16
30
00
00 13
0
00
20
-4
00 -5
00
R
-6
D
RE Iè NC RA U DIO BA I AR TTIDA UA R G ER
S
SE
US
B
C
Y
N
N
SO
SO
LS
W
T SK L M U O CA CH U AM FOTN E PU UZ LE DE RD TA O LY
RA
RAEW HAR ST
VID
R EU CO RS RI LLA
DA
E
DT
EN
R
T ER R ON I P AY VO U AU EA BE RL
SE
M
RE RT SA O
AR
ER
RN
AM
S
O AD PER P PO
AD
UKS RYAE SHTA
G
I
W
R
ID EN HE TG T
S
C Ká
Y
RD
E IN AP RN GG TE CA E S
LU
E
CH
D
EA
E ES G IS IN M EINER W B
N
EH
IT
CE
O
BU
CR
H N W SORL RG E BE SS
X
R UE
AA
G
S
A NH
S TZ
EY
O
DL
RD
HU
S
EL
H
R
KE
IE
PE
AR
AE NI
O
BR
G
IR
AC
NG
M
SP
UV
R NOE KI
E M
RE
NT
HO ING SC ELL L H E SC G
HE
KA
R LELD HON HIL SCIN O REAIM M
EY EL
RK
N TE AR G E UM M BAHU
TE
AR
Z E BE NI CH IB AN LE BR
E E AL K M C ZA LO NO I
SC
SP
DE
S NA
UI AQ
B influenced A, and B was influenced by C
TH
INFLUENCE
47
A
AL
SS AU
ER
G
1
degree of influence
HE RT
TR -S VI
EG
EL
O
RN
ID
G
SIGNIFICANCE
BA
Lé
O
N CA LA
AD
HE
HE
Jacques-Marie-Émile Lacan (French pronounced [!ak lak!"]) (April 13, 1901 – September 9, 1981) was a French psychoanalyst and psychiatrist who made prominent contributions to psychoanalysis, philosophy, and literary theory. He gave yearly seminars, in Paris, from 1953 until 1981, most influencing France's intellectuals in the 1960s and the 1970s, especially the post-structuralist philosophers. His interdisciplinary work is Freudian, featuring the unconscious, the castration complex, the ego;...
LEGEND
Figure 6. In the timeline view, influence edges result in a wave-like form indicating the propagation of philosophical ideas over many time periods. The more significant a philosopher is the larger and possibly wider is the resulting wave (below).
LEGEND
modest fireworks than the most influential philosophers, such as Kant. Besides the number of Kant edges, the Immanuel (IPA: [!'manu"l kant];spatial 22 April 1724 – 12 February 1804) was an 18th-century German philosopher from the Prussian city of Königsberg (now Kaliningrad, extent of edges conveys the topical scope of a philosopher’s incoming and outgoing influences. Russia). He is regarded as one of the most influential
SIGNIFICANCE degree of influence
1
47
thinkers of modern Europe and of the late Enlightenment.
Kant created a new widespread perspective in philosophy In the temporal layout, the influence edges lead to distinct wave-like patterns (see Figure 6). The resulting which influenced philosophy through the 21st Century. He INFLUENCE B published important works of epistemology, as well as edge layout is particularly interesting as the waveform can also be seen as a representation ofalso the constant works relevant to religion, law, andcritique history.... and evolution of philosophical ideas. While in the interest map the spatial extent of edges stands for topical scope, in the timeline the extent of edges represents the temporal scope of influence. A
C
B influenced A, and B was influenced by C
5.5 Visual Presentation In addition to the conceptual representation of multiple types of data relationships, it is important to consider how the visual presentation can combine these with the display of additional information, such as the names of philosophers, their biographical backgrounds, and visualization-related legends. To reduce visual clutter, only the names of those philosophers that are currently active or associated with the active philosopher are displayed. The nodes for the remaining philosophers are dimmed and do not have a label.
8
Imma 12 Fe from t Russi thinke Kant c which also p works
W
H IT
A
YT SKL MAU M UOCA E OHTNUZ FC PULE RD A DEOT LY LS ON W S RA RAEW N AR O H ST S D VI UR Y DA OAERS NT CL O RI L SEER OUIR-P AY UEVA AL BEER M DT EN AR TRE R NO SAORER A D PP ER PO AM S AD S G EAKU IN TYR HSA ERTE AP G S RNEGEN CAEIDTG
R
CS Ká R LU S GE E IN IS NR M EBIE BWU D CE A O HE N CR TE OL HI GESR W RS ES N HE HBURDOESYC O LZ G AEDT I BNR H RD AC LS MPIRREX AA R S NAG EIEGR EM UKV UE O
This allows the viewer to focus on the current selection, but it also alleviates a label-occlusion problem that still occurs when many edges of associated nodes are displayed (see Figure 5, right). In the case of overlapping labels, it is possible to hover with the mouse over the corresponding nodes to make hidden labels visible. To ensure aesthetic proportions between circles and labels, the font size is set relative to the size of the circles. Furthermore, only the surname of the philosopher is used, which is typically unique and sufficiently known. To learn more about an individual philosopher, a detailed view is displayed in the lower right portion of the window (see Figure 7, left). The beginning of the corresponding Wikipedia article is displayed and accompanied with a visual depiction (e.g., photo, painting, sculpture) of the philosopher. Clicking anywhere on the detail window opens the corresponding entry on Wikipedia. The border of this background display uses the colour of the corresponding philosopher. Immanuel Kant (IPA: [!'manu"l kant]; 22 April 1724 – 12 February 1804) was an 18th-century German philosopher from the Prussian city of Königsberg (now Kaliningrad, Russia). He is regarded as one of the most influential thinkers of modern Europe and of the late Enlightenment. Kant created a new widespread perspective in philosophy which influenced philosophy through the 21st Century. He also published important works of epistemology, as well as works relevant to religion, law, and history....
Figure 7. Detailed information for currently activated philosopher (left). Legend for node sizes and edge types (right).
Legends are displayed to summarize the different mappings that are used. For example, for the size of circles and types of edges, a legend for both layouts is always displayed in the lower left of the screen (see Figure 7, right). The two circle sizes displayed actually correspond to the smallest and largest nodes in the visualization, giving a sense for the extent of significance between philosophers. In the timeline view, years indicate the temporal distribution along the time axis. The legends are drawn in shades of light grey to avoid distracting from the information visualization.
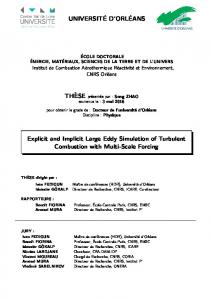
6. EXPLORING COMPLEX RELATIONSHIPS Allowing only one philosopher to be selected at a time can be seen as a limitation, but as suggested before it opens up interesting possibilities for visualizing different patterns and relationships. Furthermore, having only one philosopher selected at a time has interesting implications for the interaction with NLDs and MDS-based visualizations. Selecting a philosopher draws the incoming and outgoing edges, highlights the respective nodes, and displays their names. As these linked nodes are revealed, the viewer is more likely to follow the displayed edges and activate one of the linked philosophers. In a sense, exploring philosophers along their influence edges becomes a pivoting exploration from one philosopher to the next. It would be interesting to examine whether the structure of networks is easier to comprehend by actively pivoting through it or by looking at a global overview with possibly many overlapping edges. Consider starting out with the interest map layout and selecting, for example, the node of Beauvoir, which is one of the smaller circles in the periphery of the visualization (see Figure 8, top). After having selected this philosopher it is now possible to follow one of the philosophers that was influenced by her. In this case one could select Deleuze (bottom right) and afterwards a philosopher with a larger and more saturated node, in this case Nietzsche (bottom left). The path of exploration depends somewhat on serendipity, intuition, and interest, all of which are affected by the overall node layout, the edges, and the colourings. To change the layout, a button in the upper left corner triggers the transition between the interest map and the timeline. As the colours are based on interest similarity it is possible to rediscover nodes from the interest map in the timeline view. The transition between the views is animated to allow the viewer to follow nodes between the views.
9
SARTRE
KIERKEGAARD
BEAUVOIR
BEAUVOIR
KANT
CAMUS
HEGEL
MARX ! TIME LINE SARTRE
DESCARTES
DELEUZE
SARTRE
HUSSERL HEIDEGGER
NIETZSCHE
STRAUSS
Simone de Beauvoir (pronounced [sim!n d" bo#vwa$ French) (January 9, 1908 – April 14, 1986) was a Fre author and philosopher. She wrote novels, monograp philosophy, politics, and social issues, essays, biographies, and an autobiography in several volume now best known for her metaphysical novels, includin Came to Stay and The Mandarins, and for her 1949 The Second Sex, a detailed analysis of women's opp and a foundational tract of contemporary...
LEGEND SIGNIFICANCE
1 47
degree of influence
BEAUVOIR
B
FOUCAULT
C
was influenced by C
INFLUENCE
A
1 47
BEAUVOIR
B
FOUCAULT
C
B influenced A, and B was influenced by C
CAMUS
HERACLITUS CAPUTO
MERLEAU-PONTY
KANT
MERLEAU-PONTY
KANT
MAIMON
SPINOZA
SPINOZA
HEGEL
GORDON SCHELER
LéVINAS
SCHOPENHAUER SPIR
RAWLS GUATTARI
BENJAMIN
BLANCHOT
BLANCHOT
GUATTARI
BERGSON
PARMENIDES DERRIDA
PLATO BUBER
NIETZSCHE
EMPEDOCLES
DELEUZE
DELEUZE
RORTY
HEIDEGGER
NIETZSCHE BADIOU
WITTGENSTEIN
LéVI-STRAUSS
PASCAL VATTIMO ADORNO
WHITEHEAD
Figure 8. Exploratory pivoting along philosophers’ influences from Beauvoir over Deleuze to Nietzsche. Friedrich Wilhelm Nietzsche (October 15, 1844 – August 25, 1900) (German pronunciation: [!f"i#d"$ç !v$lh%lm !ni#t&%]) was a nineteenth-century German SIGNIFICANCE philosopher and classical philologist. He wrote critical 1 degree of influence texts on religion, morality, contemporary culture, 47 philosophy, and science, using a distinctive German language style and displaying a fondness for metaphor and aphorism. INFLUENCE A Nietzsche's B influenceCremains substantial within and beyond notably B influenced A, and Bphilosophy, was influenced by C in existentialism and postmodernism....
LEGEND
7. CURRENT LIMITATIONS AND FUTURE WORK
1 47
B
was influenced by C
C
Gilles Deleuze (French pronunciation: [!il d"løz]), (1 January 1925 – 4 November 1995) was a French ph of the late 20th century. From the early 1960s until h death, Deleuze wrote many influential works on philo literature, film, and fine art. His most popular books w the two volumes of Capitalism and Schizophrenia: Anti-Oedipus (1972) and A Thousand Plateaus (1980 co-written with Félix Guattari. His books Difference a Repetition (1968) and The Logic of Sense...
The presented design and implementation of EdgeMaps are first steps towards integrating explicit and implicit data relationships. While the idea of integrating NLD and MDS visualizations is promising, there are several limitations associated with our particular design and the general approach.
We have argued that displaying edges for only one node, i. e., philosopher, at a time allows for novel interaction and visualization methods and solves some of the edge congestion problems of larger NLDs. However, it would be interesting to see how techniques addressing edge congestion such as EdgeLens6 and Edge Bundles7 could be integrated with the idea of combining a layout representing implicit relations with edges for explicit relations. The differentiation between incoming and outgoing edges led to novel visual patterns in the time and interest views; it would be interesting to consider other partitioning of edges and nodes to expose different data patterns. While we used the MDS algorithm in the R environment, it would be beneficial to explore its parameters and, for example, consider planes with arbitrary rectangular shapes besides squares. The difficulty to interpret the meaning of position and proximity may be alleviated with the display of edges, yet, it needs further exploration to find other techniques that make the output of MDS algorithms more accessible and meaningful. One of the ideas that came up during this work is to label regions in the MDS plane based on representative keywords that 10
are more common among nodes that are positioned closer to each other. Besides the aim of making the MDS layout more comprehensible, it could be useful to create a flexible MDS algorithm allowing the viewer to change how items are positioned. The great challenge for this would be to make this algorithm interactive. Another open question that needs further exploration is the management of large numbers of overlapping nodes. In the timeline view, it would be possible to position the nodes vertically, for example, ordered by significance, i. e., size. The interest map currently places smaller nodes around larger nodes with the same position. In order to support large numbers of overlapping nodes, it would be possible to indicate the spatial togetherness using visual bubbles such as the one shown by the bubble sets technique.17
8. CONCLUSION With the design and realization of EdgeMaps we have explored the visualization of explicit and implicit relations on an example dataset of philosophers. The interactive visualization tool that we have designed and developed represents implicit relations (time and interests) as the underlying layouts for node-link diagrams in which nodes stand for philosophers and edges for explicit influence connections between them. By constraining the selection to one philosopher at a time, it is possible to visually distinguish between incoming and outgoing edges particularly by their curvatures. Restricting selections to one philosopher at a time and visually distinguishing influence edges led to novel visual patterns that resembled the aesthetics of fireworks and waves. In contrast to the notorious yarn ball effect of some graph visualizations, we have suggested that an interactive pivotal exploration along edges between nodes may better allow viewers to grasp network structure than complex overviews.
ACKNOWLEDGEMENTS We thank our colleagues in the iLab at the University of Calgary for valuable advice and assistance, in particular, Uta Hinrichs for her feedback on drafts of this paper. We are also grateful to the referees for their constructive feedback and suggestions. Funding was provided by SMART Technologies, NSERC, iCORE, and NECTAR.
REFERENCES [1] Shneiderman, B., “The eyes have it: A task by data type taxonomy for information visualizations,” in [Proceedings of the IEEE Symposium on Visual Languages], 336–343 (1996). [2] Bertin, J., [Semiology of Graphics: Diagrams, Networks, Maps ], University of Wisconsin Press (1983). [3] Stone, M. C., [A Field Guide to Digital Color ], ch. 12 Color in Information Display, 277–300, AK Peters (2003). [4] Herman, I., Melan¸con, G., and Marshall, M., “Graph visualization and navigation in information visualization: A survey,” TVCG: Transactions on Visualization and Computer Graphics 6(1), 24–43 (2000). [5] Purchase, H. C., “Metrics for graph drawing aesthetics,” Journal of Visual Languages & Computing 13, 501–516 (October 2002). [6] Wong, N., Carpendale, S., and Greenberg, S., “EdgeLens: An interactive method for managing edge congestion in graphs,” in [InfoVis 2003: Symposium on Information Visualization], 51–58, IEEE Computer Society (2003). [7] Holten, D., “Hierarchical edge bundles: Visualization of adjacency relations in hierarchical data,” TVCG: Transactions on Visualization and Computer Graphics 12(5), 741–748 (2006). [8] Becker, R., Eick, S., et al., “Visualizing network data,” TVCG: Transactions on Visualization and Computer Graphics 1(1), 16–21 (1995). [9] Heer, J. and danah boyd, “Vizster: Visualizing online social networks,” in [InfoVis 2005: Symposium on Information Visualization], 32–39, IEEE Computer Society (2005). [10] Wise, J. A., Thomas, J. J., Pennock, K., Lantrip, D., Pottier, M., Schur, A., and Crow, V., “Visualizing the non-visual: Spatial analysis and interaction with information from text documents,” in [InfoVis 1995: Symposium on Information Visualization], 51–58, IEEE Computer Society (1995). [11] Williams, M. and Munzner, T., “Steerable, progressive multidimensional scaling,” in [InfoVis 2004: Symposium on Information Visualization], 57–64, IEEE Computer Society (2004).
11
[12] Wattenberg, M., Res, I., and Cambridge, M., “Arc diagrams: visualizing structure in strings,” in [InfoVis 2002: Symposium on Information Visualization], 110–116, IEEE Computer Society (2002). [13] Kerr, B., “Thread Arcs: An email thread visualization,” in [InfoVis 2003: Symposium on Information Visualization], 211–218, IEEE Computer Society (2003). [14] Neumann, P., Schlechtweg, S., and Carpendale, S., “ArcTrees: visualizing relations in hierarchical data,” in [Eurographics-IEEE VGTC Symposium on Visualization], 53–60 (2005). [15] Shneiderman, B. and Aris, A., “Network visualization by semantic substrates,” TVCG: Transactions on Visualization and Computer Graphics 12, 733–740 (Sep/Oct 2006). [16] Collins, C. and Carpendale, S., “VisLink: Revealing relationships amongst visualizations,” TVCG: Transactions on Visualization and Computer Graphics 13, 1192–1199 (Nov/Dec 2007). [17] Collins, C., Penn, G., and Carpendale, S., “Bubble sets: Revealing set relations with isocontours over existing visualizations,” TVCG: Transactions on Visualization and Computer Graphics 15(6), 1009–1016 (2009).
12