Convolutional Neural Network (CNN) and Recurrent Neural. Network (RNN) to extract spatiotemporal features for emotion recognition from the EEG signals.
(IJACSA) International Journal of Advanced Computer Science and Applications, Vol. 9, No. 8, 2018
EEG-Based Emotion Recognition using 3D Convolutional Neural Networks Elham S.Salama, Reda A.El-Khoribi, Mahmoud E.Shoman, Mohamed A.Wahby Shalaby Information Technology Department Faculty of Computers and Information, Cairo University Cairo, Egypt
Abstract—Emotion recognition is a crucial problem in Human-Computer Interaction (HCI). Various techniques were applied to enhance the robustness of the emotion recognition systems using electroencephalogram (EEG) signals especially the problem of spatiotemporal features learning. In this paper, a novel EEG-based emotion recognition approach is proposed. In this approach, the use of the 3-Dimensional Convolutional Neural Networks (3D-CNN) is investigated using a multi-channel EEG data for emotion recognition. A data augmentation phase is developed to enhance the performance of the proposed 3D-CNN approach. And, a 3D data representation is formulated from the multi-channel EEG signals, which is used as data input for the proposed 3D-CNN model. Extensive experimental works are conducted using the DEAP (Dataset of Emotion Analysis using the EEG and Physiological and Video Signals) data. It is found that the proposed method is able to achieve recognition accuracies 87.44% and 88.49% for valence and arousal classes respectively, which is outperforming the state of the art methods.
human emotions are not isolating. However, most existing emotion recognition methods based on the EEG signals model only either spatial or temporal dependency. In this paper, a new emotion recognition method is proposed to extract spatiotemporal features from the EEG signals in one end-toend model.
Keywords—Electroencephalogram; emotion recognition; deep learning; 3D convolutional neural networks; data augmentation; single-label classification; multi-label classification
The 3D-CNN proves its ability to capture the correlation between dimensional emotions (i.e. valence and arousal). This ability helps in converting the dimensional emotions into discrete emotions (i.e. happy, sad, etc.) and to save processing time needed for processing each dimensional label separately.
I.
INTRODUCTION
Human emotions are important in communication with others and decision making. Recognizing emotion is important in intelligent Human-Computer Interaction (HCI) applications such as virtual reality, video games, and educational systems. In the medical domain, the detected emotions of patients could be used as an indicator of certain functional disorders, such as major depression. Human emotions are extracted from the facial expressions as the main source of emotions [1]. However, it is known that some people could hide their real emotions using misleading facial expressions [2]. Hence, researchers adhere to use other sources of information that are reliable and not susceptible to fraud. One of these sources is the electroencephalogram (EEG) signals which are the recording of the electric field of the human brain. The EEG signals are able to be used as a source of emotions since human responses are linked to the cortical activities. Ekman [3] found that emotion recognition needs to work under keeping expression in long duration. In other words, emotionrelated signals contain contextual temporal dependencies. Hence, taking into consideration the relation in time between the EEG signal segments can model the bundling behavior of human emotions. In addition, the spatial relationship between multiple electrodes positions can prove that the behaviors of
The main contributions of the proposed work are summarized as follows: The proposed work introduces a new approach which utilizes the 3D-CNN for extracting the spatiotemporal features in the EEG signals. To the best of our knowledge, employing the 3D-CNN has not yet been investigated for the EEG-based emotion recognition. The 3D-CNN captures the correlation between different channels positions by taking the data from different channels as input.
The proposed 3D-CNN for the EEG-based emotion recognition has a significant potential to detect emotions from spatiotemporal information. The rest of this paper is organized as follows: The previous and the most related research works are presented in Section II. Section III explains the proposed approach in details. The results are shown in Section IV. The proposed work is concluded in Section V. II. RELATED WORKS In well-documented works, the ability of the EEG signals for recognizing emotions was extensively explored [4], [5]. Verma and Tiwary [6] reported the use of the EEG signals for emotion recognition using the power spectral density as features and the Support Vector Machines (SVM) and the kNearest Neighbors (KNN) as classifiers. Yoon and Chung [7] introduced a new emotion recognition method using the EEG signals. They extracted features using the Fast Fourier Transform (FFT) analysis from the EEG segments and used the Pearson correlation coefficient for feature selection. A probabilistic classifier based on Baye’s theorem is proposed.
329 | P a g e www.ijacsa.thesai.org
(IJACSA) International Journal of Advanced Computer Science and Applications, Vol. 9, No. 8, 2018
In addition, a supervised learning using a perceptron convergence algorithm is introduced. Naser and Saha [8] used the Dual-Tree Complex Wavelet Packet Transform (DT-CWPT) to extract meaningful emotion features from the EEG signal elicited during watching music videos. For feature elimination, Singular Value Decomposition (SVD), QR factorization with column pivoting (QRcp), and F-ratio are employed. The classification step is performed using SVM. Atkinson and Campos [9] introduced a novel feature-based emotion recognition model in which statistical features were extracted from the EEG segments such as median, standard deviation, and kurtosis coefficient. In addition to statistical features, band power (BP) for different frequencies, Hjorth parameters (HP), and fractal dimension (FD) for each channel are also extracted. This new model combined mutual information from feature selection methods and kernel classifiers. In order to reduce information redundancy, the minimum-Redundancy-Maximum-Relevance (mRMR) is employed. This method obtained the best set of features by selecting the features that are mutually different and have a high correlation. SVM classified the input data into low/high valence or low/high arousal.
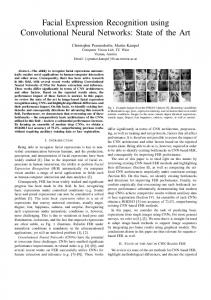
III. PROPOSED SYSTEM Normally, the automatic emotion recognition process can be carried out using one or more of different modalities: face, speech, body gestures, and the EEG signals. Using the EEG signals, researches focus on solving the problem of correlation in time between emotions. By nature, emotions last for short or long period of time, not just a moment. Thus, the relation between emotion segments in time is highly effective for improving recognition accuracy. Motivated by the recent success of the deep learning approaches [16], [17], the 3DCNN approach is proposed to model the spatiotemporal information from the EEG signals. To reach this objective, data augmentation phase is first applied to increase the number of available EEG samples. Then, the 3D representation of inputs is created from the EEG segments. And finally, the proposed system of the 3D-CNN model is built. The procedure of the proposed system is illustrated in Fig. 1.
Li et al. [10] proposed a new deep learning hierarchy of Convolutional Neural Network (CNN) and Recurrent Neural Network (RNN) to extract spatiotemporal features for emotion recognition from the EEG signals. The CNN is used for extracting the spatial features and its output is used as inputs to the RNN to extract the temporal features. In addition, Chen et al. [11] used four physiological signals including the EEG signals for emotion recognition using Hidden Markov Model (HMM) as a classifier. For feature selection, they utilized multimodal feature sets and Davies-Bouldin index (DBI) methods. Koelstra et al. [12] extracted 216 EEG features from 5 different frequency bands. These features are theta (4-8 Hz), slow alpha (8-10 Hz), alpha (8-12 Hz), beta (12-30 Hz), and gamma (30+ Hz), spectral power for 32 electrodes, and the difference between the spectral powers of all the symmetrical pairs of electrodes. For feature elimination, Fisher’s linear discriminant was used and the Gaussian naive Baye’s is used for the classification. Rozgic et al. [13] addressed emotion recognition based on the EEG signals and three classifiers: Neural Network (NN), NN voting, and SVM. They extracted the same extracted features in Koelstra et al. [12] from the EEG signals. Alhagry et al. [14] extracted temporal features using RNN and the EEG signals. Their RNN consists of fully connected two LSTM layers, a dropout layer, and a dense layer. Zhang et al. [15] presented a deep learning framework called spatiotemporal recurrent neural network (STRNN) in order to combine the learning of spatiotemporal features for emotion recognition using the SJTU Emotion EEG Dataset (SEED). However the accuracies obtained by the above researches are reasonably high, further improvement concerning emotion recognition is still needed.
Fig. 1. The Flowchart of the Proposed System.
A. Data Augmentation To evaluate the proposed system, the DEAP (Dataset of Emotion Analysis using EEG and Physiological and Video Signals) [12] data is used. It is a benchmark dataset for emotion analysis using the EEG, physiological and video signals. Thirty-two participants were watching 40 videos each with one-minute duration. The facial expressions and the EEG signals were recorded for each participant. The EEG signals were recorded from 32 different channels. Most of the publicly available EEG datasets have fewer amounts of data per participant. For the DEAP data, there are a limited number of samples; only 40 experiments are recorded per participant which may affect the performance of any machine learning system to generalize unseen samples. Data augmentation aims to increase the number of samples by adding some noise signals to the original input signals to generate new noisy samples and then train the model with these new noisy
330 | P a g e www.ijacsa.thesai.org
(IJACSA) International Journal of Advanced Computer Science and Applications, Vol. 9, No. 8, 2018
samples [10]. This helps parameters to converge, avoid overfitting, and make the proposed system capable of generalization to unseen samples.
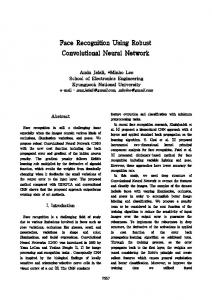
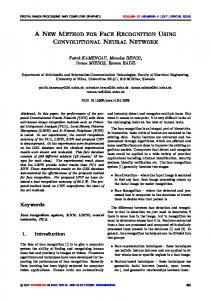
Fig. 3. Illustration of 3D Convolution Operation: a) Input Volume, and b) Output Volume.
Fig. 2. The Representation of the 3D-CNN Input Volume with 5 Consecutive Frames.
To generate the noisy EEG signals, a Gaussian noise signal n with zero mean and unit variance is first generated randomly with N samples such that N is the number of samples of the original EEG signal s. Finally, the noisy version ṧ of s is obtained by adding all samples of s and ň signals together. The augmentation phase is applied in the training step only. During the testing step, the clean versions of the signals are used. B. 3D Input Representation As mentioned earlier, the 3D-CNN is capable of learning spatiotemporal features. This requires a construction of 3D input representations from the EEG signals. To this end, a 3D representation procedure is presented in the proposed work. Usually, the EEG data from every signal is recorded from different Ch channels. Using a window size w, the data from every channel c is segmented into small segments (frames). The number of frames from every channel is D frames (f1, f2,…, fD). The samples of the frame from all Ch channels are appended together to form a 2D matrix K where its height is the number of channels and its width is the number of samples in the frame. Then, the third temporal domain is appended by selecting a number of consecutive frames m which is also called the chunk size. If the chunk size is 6, then, 6 sequential frames are appended together in one chunk in a 3D matrix called B. To add a label to each chunk, the majority rule is employed to get the corresponding ground truth label. If the chunk has 6 frames and the same label occurs in more than 3 frames (chunk size / 2), this majority label is assigned to this chunk. Finally, a new 3D matrix C is created to hold the chunk of frames and its corresponding label. Each 3D matrix C is considered as an input to the 3D-CNN model for the training. Fig. 2 shows the shape of the 3D input volume. The figure shows a chunk with 5 consecutive frames and 32 channels. C. The 3D-Convolutional Neural Network Model The next step is to use the proposed the 3D-CNN to recognize emotions based on spatiotemporal features. The 3DCNN structure is introduced and the proposed network architecture is thus described in the next subsections.
1) 3D convolutional neural networks: 3D-CNN is a deep learning approach [18] which is the extension of the traditional CNN with modified convolution and pooling operations. It is introduced to model the spatiotemporal features of long sequences. Sequences with long durations such as speech, videos, and EEG signals have a dependency between its segments and neglecting these dependencies may affect the robustness of recognition systems. The 3D-CNN models these temporal dependencies by applying 3D convolution operations over the input segments. In addition, the spatial correlation between pixels of video frames or different EEG channel locations can be visualized and modeled using the 3D convolution operation. The 3D-CNN has utilized for action recognition in [19]. The convolution operation is inspired by the notions of cells of the visual neuroscience [20]. The 2D-convolution operation uses 2D inputs and results in a series of 2D feature maps. Inspired by this, the 3D convolution generates a series of 3D feature volumes by processing 3D inputs, where the third dimension is the time which is modeled by consecutive input frames. From a mathematical point of view, the 3D convolution operation is calculated as follows: (
)
∑ ∑ ∑
(
)
(
)
(1)
Where O is the output of the convolution operation, f is the filter with size m*n*p and C is the 3D input EEG chunk. C has usually larger size than f. The convolution is the discrete multiplication of f and C for all discrete indices x, y, and z which range from m, n, and p respectively. The 3D convolution operation is illustrated in Fig. 3: the size of the input volume is H*W*L. The filter size is k*k*d where d is smaller than L. This results in an output volume. 2) Network architecture: Choosing the correct network architecture for a problem gives a better opportunity of getting more accurate results. The 3D-CNN supports a series of connected layers. Due to a large number of different layer types, it is not trivial to find an optimal chain that closely matches the given problem.
331 | P a g e www.ijacsa.thesai.org
(IJACSA) International Journal of Advanced Computer Science and Applications, Vol. 9, No. 8, 2018
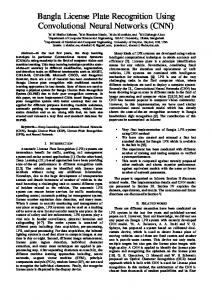
Fig. 4. Network Architecture of the Proposed 3D-CNN Model.
The adopted architecture consists of six layers. The first layer is the input volume. The middle layers are two convolution layers, each followed by a max-pooling layer. The last layer is one fully-connected layer to extract the final features. A detailed illustration of the proposed network architecture is shown in Fig. 4. For the first layer, the input volume size is 6*32*128; 6 is the number of the consecutive frames processed at once, 32 is the number of channels, and 128 is the number of samples in a frame. The kernel shape of the first convolution layer is 3*3*3: where 3, 3, and 3 are the width, height, and depth respectively. The rectified linear unit (RELU) is used as activation function in both convolution layers since it is linear, drivable, and has a simple implementation which can be expressed as: ( )
{
(2)
where, is the input to the current convolution layer. The number of feature maps is set to 8. The max-pooling operation down-samples the extracted features from the convolution layer. The max-pooling layer has a resolution of 2*2*2. For the second convolution layer, the same configurations of the first convolution layer are used except for the number of feature maps which is set to 16.
Before passing the 16 resulting feature maps to the fullyconnected layer, the output feature maps are reshaped to be in a vector shape. The number of output features from the fullyconnected layer is 600. IV. EXPERIMENTS AND RESULTS Below sub-sections explains the data description, the parameter settings, the experiments, and analysis of the results. A. Data Description The presented system has been verified using benchmarking DEAP dataset. Using a publicly available database enables us to compare the proposed research results with the related works in literature. The DEAP dataset contains the EEG and the peripheral signals from 32 participants, and each participant watched 40 music videos each with one- minute duration. Only the EEG signals are used in the proposed work. The allowed labels in the DEAP data are valence, arousal, dominance, and liking. The subjects rated each video on a scale from 1 to 9. Only two main types of categories are tested in the proposed work: valence and arousal. Valence ranges from unpleasant to pleasant and arousal ranges from calm to active. In this paper, two binary classes for each category are tested: low and high. If the participant’s rating is < 5, the label of valence/arousal is low and if the rating is >= 5, the label of valence/arousal is high.
332 | P a g e www.ijacsa.thesai.org
(IJACSA) International Journal of Advanced Computer Science and Applications, Vol. 9, No. 8, 2018
B. Implementation Details The proposed system works through three main steps: data augmentation, 3D input representation of the EEG signal and training and testing of the 3D-CNN model. All parameter settings are described in details in this sub-section. 1) Training settings: The learning rate is set to 1E-3 and the momentum is 0.9 with RMSprop optimizer. Batch size for training and testing is set to 100 samples. The K-fold crossvalidation method is used to evaluate the performance of the proposed approach since it avoids using uneven dataset for testing. K is set to 5 with a true shuffle. Four folds are used for training and the remaining one fold is used for testing. The final recognition accuracy is the average over all the 5 folds. The main goals of the training process are the convergence and making the loss reaches zero. If the loss reaches zero before reaching the total number of epochs, an early stopping criterion is applied to save time processing more epochs, while the system is already converged. The proposed early stopping criterion is achieved by counting the number of times the loss reaches zero, and if this count exceeds a threshold, the optimization is stopped. This threshold is set to 3 to make sure of the system convergence. One-hundred epochs are used in the proposed experiments. For the number of features that represent the training samples of each class, the number is chosen to be 600 which is selected experimentally. 2) Environment details: Tensorflow framework [21] is employed in the proposed system using Core i7 device with 8Giga RAM and 960M graphics processing units (GPUs) which allowed researchers to train networks 10 or 20 times faster. C. Pre-Processing the EEG Signals Different pre-processing operations are applied to enhance the quality of the EEG signal and hence improve the accuracy of the emotion recognition task. The pre-processing includes performing high pass filter to get rid of any signal below 1 Hz or any dc. In addition, a band stop filter with a cutoff frequency of 50 to 60 Hz is applied to remove any unwanted noise. Besides, normalization of each channel data is performed to be between -1 and 1. The EEG signal for each video is 63 seconds. The first 3 seconds pre-trial baseline are removed from the EEG signal leaving only 60 seconds as trials for training and testing. Each the EEG signal is stationary for a small period of time [22], so, it is preferred to apply overlapping to maintain the continuity between frames. The overlap size is chosen to be 0.5. D. Single-Label vs. Multi-Label Emotion Recognition The most well-known approach to classify an input instance into valence and arousal class labels is to simply train an independent classifier for each label at once. This is called single-label classification (SLC). Multi-label classification (MLC) [23] aims to classify instances where each instance belongs to more than one class simultaneously. In emotion recognition case, MLC intends to classify input instance into its four combinations of valence and arousal; low valence-low arousal, low valence-high arousal, high valence-low arousal,
and high valence-high arousal. MLC saves time processing each dimensional label in separate. In the proposed work, a binary representation is associated for each input instance to represent its label. In the case of SLC, only two digits are required to represent the two classes of valence/arousal (low and high) such that 10 mean high valence/arousal and 01 mean low valence/arousal. For MLC case, the label of each input instance is represented in four digits to express its four combinations. The first two digits represent the labels of valence and the last two digits represent the labels of arousal. For example, an input instance with label 1001 means that input instance is classified as low valence and high arousal simultaneously. In the proposed work, singlelabel and multi-label experiments are conducted to investigate the effectiveness of each methodology on the emotion recognition performance. E. Results and Discussions To show the effectiveness of the proposed system, a set of experiments are conducted using the DEAP data. Each experiment is implemented using the best configuration achieved till now from its previous experiment. 1) Single-label EEG based emotion recognition: In this experiment, valence labels are classified in separate from arousal labels. A flag with two values “valence” or “arousal” is set. If the flag is “valence”, the input sample is classified as low/high valence. If the flag is “arousal”, the input sample is classified as low/high arousal. Two experiments are conducted: the first is to choose the appropriate chunk size and the second is to increase the number of training samples. a) Choosing the appropriate chunk size: chunk size is the number of consecutive frames that are combined together in one chunk as an input to the 3D-CNN method to model the temporal dependency between the EEG signal segments. The duration of each frame is one second, so the chunk size refers to the required number of seconds to describe the given emotion. Table I shows the experimented chunk sizes and the corresponding average accuracy over all users. As illustrated, the accuracy increases as the chunk size increase until a specific range and reaches its maximum using 6 seconds. This concludes that the 3D-CNN needs about 6 seconds to give a precise decision about the input emotion. As long as the data from each video has 60 seconds trial and the 60 seconds are divided into 1s frames, 60 frames are achieved. Appending every 6 successive frames together as a chunk, every video contains 10 chunks. Since the overlap size is 0.5, 20 chunks are achieved for each video on average. Hence, the total readings are 25376 chunks for the 32 users and 40 videos. TABLE I.
AVERAGE ACCURACY FOR VALENCE AND AROUSAL USING DIFFERENT CHUNK SIZES Chunk Size 3
5
Valence
70.80
Arousal
72.60
6
7
9
71.97 76.3
74.77
73.98
74.62 78.10
75.80
75.22
333 | P a g e www.ijacsa.thesai.org
(IJACSA) International Journal of Advanced Computer Science and Applications, Vol. 9, No. 8, 2018
b) The effect of augmentation phase: One of the limitations of machine learning methods is the availability of sufficient training data to get high recognition performance [24]. The EEG data has only 40 one-minute videos for each subject. To solve this limitation, several noisy versions of the same video signal are generated to increase the number of video samples. The augmentation process is applied to the training samples only and clean data is used for testing. The type of the noise added to the original signal is the white Gaussian noise with zero mean and unit variance. In order not to affect the quality of original signal and hence the accuracy of the system, the signal-to-noise ratio (SNR) between original the EEG signal and the noise signal is set to a small value which is 5. Fig. 5 illustrates a comparison between the accuracy values with and without augmentation. This experiment is done using a chunk size of 6 frames with 0.5 overlap and preprocessing operations as mentioned in section C. Several numbers of augmentation files have experimented; 10, 30, and 50. The first element in the x-axis in Fig. 5 refers to no augmentation case. As clear, the average accuracy increases with the increase in the number of augmentation files since having bigger data allows the system to generalize. And the results indicate that better results can be achieved by increasing the number of noisy files per video.
TABLE II.
COMPARISON WITH THE RELATED WORKS IN LITERATURE AND THE PROPOSED METHOD IN TERMS OF ACCURACY Valence
Arousal
Yoon and Chung [7]
70.9
70.1
Naser and Saha [8]
64.3
66.2
Atkinson and Campos [9]
73.41
73.06
Chen et al. [11] Koelstra et al. [12] Rozgic et al. [13] Li et al. [10] Alhagry et al. [14] The proposed method
73 57.6 76.9 72.06 85 87.44
75.63 62 68.4 74.12 85 88.49
Yoon and Chung [7] extracted FFT from the EEG segments, Naser and Saha [8] used DT-CWPT for feature extraction. DT-CWPT has less accuracy than FFT which indicates the superior effectiveness of FFT in emotion recognition. Atkinson and Campos [9] computed a set of statistical features besides some frequency bands features. The proposed method in [9] is better than both works in [7], [8] due to the use of a different set of features. Their work still less than the proposed method since their features are handcrafted. Hand-crafted features require a huge amount of engineering skill and domain expertise to select the best set of features that best represent input data. Chen et al. [11] computed the power values of 6 frequency bands for each electrode as features and got a recognition accuracy of 73 and 75.63 for valence and arousal classes respectively. Even though they are using hand-crafted features, their accuracy is a bit high due to working on only 10 participants. Both Rozgic et al. [13] and Koelstra et al. [12] extracted the same features from the EEG signals. However, their accuracies still less than the proposed method since they are using hand-crafted features (power of frequency bands). This proves the superiority of deep learning features especially the 3D-CNN features for EEG-based emotion recognition task.
Fig. 5. The Effect of Augmentation on Average Accuracy Overall.
c) Comparative Study: the proposed work is compared to the state of the art EEG-based emotion recognition methods that worked on DEAP data. The comparison is presented in Table II.
Li et al. [10] extracted spatiotemporal features from two different architectures (CNN with RNN) combined stacked together. While CNN and RNN got good recognition accuracy, they are two different models. The CNN used stacked layers of convolution operations, and the RNN used gated cells called Long Short-term Memory (LSTM). On the other hand, the 3D-CNN extracts the spatiotemporal features in one- end-to-end architecture with sharing parameters. Alhagry et al. [14] have a larger accuracy compared to other works in literature since they used the RNN which is a deep learning method the models the time variations in the EEG signal. Although RNN has promising results in emotion recognition tasks, RNN has the limitation of increasing depth while extraction with the spectral and temporal features caused by the great number of parameters. And, it extracts only temporal features and it requires another method such as CNN to model the spatial variations in the EEG signal. However, the 3D-CNN is a compact model that is able to model the spatiotemporal variations simultaneously.
334 | P a g e www.ijacsa.thesai.org
(IJACSA) International Journal of Advanced Computer Science and Applications, Vol. 9, No. 8, 2018
RNN [14]
The Proposed 3D-CNN (A) Valence
RNN [14]
The proposed 3D-CNN (B) Arousal
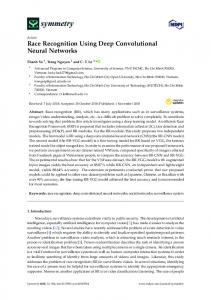
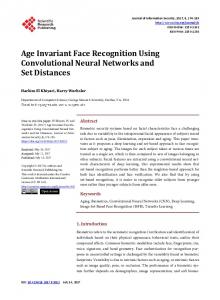
Fig. 6. A t-SNE Visualization Of Testing Samples for User 1 for both Valence (A) and Arousal (B) from Two Different Models: the RNN [14] (left) and the Proposed the 3D-CNN (right). Blue Samples Belong to the Low Class and High-Class Samples are Marked with Yellow. Best Viewed in Color.
The 3D-CNN significantly outperforms recent-related methods in the literature. One of the main reasons for the superiority of the 3D-CNN is the existence of the 3Dconvolution operation in its architecture. One of the main advantages of using the convolution operation is the parameter sharing since one feature detector of one part of input can be useful in another part of the same input. In addition, the convolution operation has the advantage of the sparsity of connections since each output value depends on a small number of inputs. These advantages provide the 3D-CNN with the capability of extracting representative spatial features that visualize the correlation between different channel locations. The 3D-convolution operation works over consecutive frames which help in extracting temporal features from the consecutive EEG segments. Table III describes a set of different performance measures for the proposed system. All the values indicate the effectiveness of the 3D-CNN for emotion recognition using brain signals. TABLE III.
To figure out the effectiveness of the 3D-CNN features in discriminating between dimensional labels, the t-SNE tool is used to visualize the test samples of one user as shown in Fig. 6 in comparison with best recent work [11]. As illustrated in Fig. 6, the proposed the 3D-CNN features results in high discriminated classes due to its compact model which do spatial and temporal classification in one end-to-end model. These results show that the proposed the 3D-CNN method produces discriminative feature representations which could give accurate emotion recognition system. 2) Multi-label EEG-based emotion recognition: In emotion recognition, classifying the input emotion in terms of only one dimension at a time leads to an incomplete description of given input emotional video. For example, for a sample to be happy in the dimensional emotions as in Fig. 7; it must be in high arousal and high valence. Hence, classifying an input based on valence only or arousal only would not give a complete description of an emotion.
DIFFERENT PERFORMANCE MEASURES FOR THE PROPOSED METHOD Sensitivity
Specificity
Precision
F1-Score
Valence
0.88
0.88
0.83
0.86
Arousal
0.85
0.91
0.88
0.86
335 | P a g e www.ijacsa.thesai.org
(IJACSA) International Journal of Advanced Computer Science and Applications, Vol. 9, No. 8, 2018
Fig. 8 compares the proposed SLC and MLC methods where SLC is the best result achieved in experiment 2. The comparison indicates the ability of the 3D-CNN to model the correlation between valence and arousal labels. In addition considering the correlation between valence and arousal gives a higher performance which can reach 93.43. V. CONCLUSION
Fig. 7. Illustration of Dimensional Emotions: Valence and Arousal.
Fig. 8. Comparison of the Proposed SLC and MLC Methods.
Sigmoid activation function which is commonly used in multi-label classification problems [25], assumes no dependency between class labels. Softmax activation function is chosen in the proposed work of multi-label classification since there is a dependency between dimensional labels. For example, one input instance could not be classified as 1100; which is low and high valence simultaneously and not any of the arousal labels. Softmax activation function can be expressed as: ( )
In this paper, the 3D-CNN emotion recognition approach is proposed to extract the spatiotemporal features to model the temporal dependencies between the EEG signals. Since the 3D-CNN requires 3D inputs, a novel method that represents the EEG signals into a 3D format from multi-channel signals has been developed. The frame samples from multi-channels are used to create a 2D spatial matrix. Then, the time dimension is appended by concatenating m consecutive frames together to form the 3D input volume. In order to show the effectiveness of the proposed method, the DEAP data is used. Since most of the publicly available EEG datasets have fewer amounts of data per subject, the data augmentation phase is employed to increase the number of samples per subject by adding noise signals to the original EEG signals. It has been shown from the experimental work that the proposed method is capable of producing a very high recognition accuracy compared to works in literature in the same domain. From this comparative study, the proposed approach is capable of achieving a significant improvement in emotion recognition from the EEG signals. In addition, the 3D-CNN proves its superiority in visualizing the correlation between valence and arousal labels and hence gives promising recognition accuracy. The advantage of using the 3D-CNN is the ability to extract spatial and temporal features in one endto-end model. In addition, it works well using time domain raw signals to construct frames for feature learning. Also, it does not need a very deep architecture to work with and hence a less processing time. Future work will include combining different modalities together with the EEG signals such as the face or the eye to increase the performance of the spatiotemporal feature learning in emotion recognition systems. [1]
∑
(3)
Where is the ith weighted input instance after passing through the last layer in the 3D-CNN model, and K is the total number of samples in the last layer. In the proposed method, the argmax function is applied to get the label at which the maximum probability occurs. It is first applied twice, one time for the first two digits of binary representation to get the label of maximum prediction probability of valence labels, and another time for the second two digits to get the maximum prediction probability of arousal labels. Then, the mean of correct predictions is calculated for both valence and arousal classes. The average accuracy per valence and arousal can be calculated simply by adding the two means of valence and arousal, then, the result is divided by 2.
[2]
[3]
[4]
[5]
[6]
REFERENCES N.N. Khatri, Z.H. Shah, and S.A. Patel, “Facial expression recognition: A survey,” International Journal of Computer Science and Information Technologies, vol. 5, no. 1, pp. 149–152, 2014. Q. Yao, “Multi-sensory Emotion recognition with speech and facial expression,” Ph.D. dissertation, Computing. University of Southern Mississippi, 2014. P. Ekman, and W. V Friesen, Unmasking the face: a guide to recognizing emotions from facial expressions, 1st ed., Englewood Cliffs, N. J: Prentice Hall, 1975. C. Brunner, C. Vidaurre, M. Billinger, and C. Neuper, “A comparison of univariate, vector, bilinear autoregressive, and band power features for brain-computer interfaces,” Medical and Biological Engineering and Computing., vol. 49, no. 11, pp. 1337–1346, 2011. J. Kim, and E. Andre, “Emotion recognition based on physiological changes in music listening,” in Proceedings of IEEE International Conference on Pattern Analysis and Machine Intelligence, vol. 30, no. 12. 2008, pp 2067–2083. G. K. Verma, and U. S. Tiwary, “Multimodal fusion framework: a multi-resolution approach for emotion classification and recognition from physiological signal,” NeuroImage, vol. 102, pp. 162–172, 2014.
336 | P a g e www.ijacsa.thesai.org
(IJACSA) International Journal of Advanced Computer Science and Applications, Vol. 9, No. 8, 2018 [7]
[8]
[9]
[10]
[11]
[12]
[13]
[14]
[15]
H. J. Yoon and S. Y. Chung. “EEG-based emotion estimation using Bayesian weighted-log-posterior function and perceptron convergence algorithm,” Computers in Biology and Medicine, vol 43, no. 12, pp. 2230–2237. 2013. D. S. Naser and G. Saha. “Recognition of emotions induced by music videos using DT-CWPT,” 2013 Indian Conference on Medical Informatics and Telemedicine, India, 2013, pp. 53–57. J. Atkinson and D. Campos. “Improving BCI-based emotion recognition by combining EEG feature selection and kernel classifiers,” Expert Systems with Applications, vol. 47, pp. 35–6, 2015. K. Li, et al., “Emotion recognition from multi-channel the EEG data through convolutional recurrent neural network,” in Proceedings of IEEE International Conference on Bioinformatics and Biomedicine, Shenzhen, China, 2017, pp. 352–359. J. Chen, B. Hu, L. Xu, P. Moore, and Y. Su, “Feature-level fusion of multimodal physiological signals for emotion recognition,” in Proceedings of IEEE International Conference Bioinformatics and Biomedicine, Washington, USA, 2015, pp, 395–4. S. Koelstra, C. Muhl, and M. Soleymani, “DEAP: A database for emotion analysis using physiological signals,” IEEE Transactions on Affective Computing, vol. 3, no. 1, pp. 18–13, 2012. V. Rozgic, S. N. Vitaladevuni, and R. Prasad, “Robust the EEG emotion classification using segment level decision fusion,” In 2013 IEEE Conference of Acoustics, Speech, and Signal Processing, Vancouver, Canada, 2013, pp. 1286–1290. S. Alhagry, A. A. Fahmy, and R. A. El-Khoribi, “Emotion recognition based on the EEG using LSTM recurrent neural network,” International Journal of Advanced Computer Science and Applications, vol. 8, no. 10, pp. 355-358, 2017. T. Zhang, W. Zheng, Z. Cui, Y. Zong, and Y. Li, “Spatial-temporal recurrent neural network for emotion recognition,” Journal of Latex Class Files, vol. 13, no. 9, pp. 1–8, 2017.
[16] K. Krizhevsky, I. Sutskever, and G. E. Hinton, “ImageNet classification with deep convolutional neural networks,” Neural Information Processing Systems, pp. 1106–1114, 2012. [17] K. Simonyan, and A. Zisserman, “Very deep convolutional networks for large-scale image recognition,” in Proceedings of Computer Vision and Pattern Recognition, 2014, pp. 1409-1556. [18] D. Maturana, and S. Scherer, “VoxNet: A 3D convolutional neural network for real-time object recognition,” 2015 IEEE/RSJ International Conference on Intelligent Robots and Systems, Hamburg, Germany, 2015. [19] D. Tran, L. Bourdev, R. Fergus, L. Torresani, and M. Paluri, “Learning spatiotemporal features with 3D convolutional networks,” The IEEE International Conference on Computer Vision, 2015, pp. 4489-4497. [20] D. H. Hubel, and T. N. Wiesel, “Receptive fields, binocular interaction, and functional architecture in the cat’s visual cortex,” Journal of Physiology, vol. 160, pp. 106–154, 1962. [21] M. Abadi, P. Barham, J. Chen, and Z. Chen, A. Davis, J. Dean, et al, “TensorFlow: A system for large-scale machine learning,” in the Proceedings of the 12th USENIX Symposium on Operating Systems Design and Implementation, Savannah, GA, USA, 2016, pp 265–283. [22] N. Hazarika, J. Z. Chen, A. C. Tsoi, and A. Sergejew, “Classification of the EEG signals using the wavelet transform.” in Proceedings of the 13th International Conference in Digital Signal Processing, Santorini, Greece, 1997, pp. 61-72. [23] G. Tsoumakas, I. Katakis, and I. Vlahavas, “A review of multi-label classification methods,” in Proceedings of the 2nd ADBIS Workshop on Data Mining and Knowledge Discovery, 2006, pp. 99–109. [24] Y. Zhang, X. Ji, and S. Zhang, “An approach to EEG-based emotion recognition using combined feature extraction method,” Neuroscience Letters, vol. 633, pp. 152–157, 2016. [25] L. Lenc, and P. Král, “Combination of neural networks for multi-label document classification,” International Conference on Applications of Natural Language to Information Systems, 2017, vol 10260, pp. 278282.
337 | P a g e www.ijacsa.thesai.org