1 Introduction. This IS primarily a study of the relationship between signal
detection perfor- mance and event-related potentials (ERPs) In the EEG The
relevant ...
Biological Psychology 7 (1978) 1 3 - 2 8 © North-Holland Pubhshmg Company
EEG EVENT-RELATED POTENTIALS AND SIGNAL DETECTION R o b e r t T W I L K I N S O N a n d David M S E A L E S Naval Health Research Center, San Dwgo, Cahforma 92152, U S A Accepted for pubhcatxon 22 June 1978
The purpose of this study was to determine whether certain previously reported relationships between event-related potentials and measures of signal detection performance occur in vigilance as well as psychophyslcal settings In the course of the study, evidence was found which challenges previously proposed psychological correlates of 'P3o0' EEG was recorded while 15 subjects carried out a 40-mm signal detection test. CNV was measured between a warning chck and the brief offset of a dim hght denoting the possible (/9 = 0 5) occurrence of the signal, a faint tone m the constant background noise P3oo was measured at a point 300 msec following offset of the dim light As reported previously m psychophyslcal settmgs, P3oo amphtude ~as positively related to signal intensity and response confidence, and was larger for correct detections (Hits) than tot correct rejections, misses or false alarms From first to second half of the test both Hits and false alarms fell, response criterion 13 rose, and the amphtude of both CNV and P3oo tell The latter negative relationship between 13 andP30o contrasted with a positive one when subjects rated their signal reports at three levels of confidence, here the most confident ratings (high /3) were assoctated with the highest amphtude of P3oo CNV reflected mdwldual ablhty to sustain performance Results are explained in terms of a twofactor version IWflkmson, 1976) of the prior state/reactive change hypothesis (Karhn, 1970) It is suggested that time on task constitutes a prior state influence on P3oo, whereas other variables influence P3oo by means of either reactive change or 'real' change m an endogenous P3oo component
1 Introduction This IS p r i m a r i l y a s t u d y o f the r e l a t i o n s h i p b e t w e e n signal d e t e c t i o n perform a n c e a n d e v e n t - r e l a t e d p o t e n t i a l s ( E R P s ) In t h e E E G T h e r e l e v a n t p a r a m e t e r s o f signal d e t e c t i o n are d', t h e i n d e x o f a p e r s o n ' s a b l h t y to d i s c r i m i n a t e f a i n t signals in noise, and/3, t h e c r i t e r i o n w h i c h h e a d o p t s m deciding h o w risky to b e m r e p o r t i n g a given d i s t u r b a n c e as a signal ( T a n n e r a n d Swets, 1 9 5 4 ) T h e t w o E R P m e a s u r e s are t h e c o n t i n g e n t negative v a r i a t i o n ( C N V ) , a negative-going wave first r e p o r t e d b y Walter, C o o p e r , Aldridge, M c C a l l u m a n d Winter ( 1 9 6 4 ) a n d t h o u g h t t o reflect t h e level o f e x p e c t a n c y w i t h w h i c h a p e r s o n awaits t h e o n s e t o f an i m p e r a t i v e s t i m u l u s , a n d 'P3oo', a p o s t - s t i m u l u s , positive wave w h i c h h a s b e e n h e l d t o reflect a variety o f p s y c h o l o g i c a l p a r a m e t e r s associated w i t h decision processes, a t t e n t i o n , a n d dlscrunm a t l o n (see T u e t l n g a n d S u t t o n , 1 9 7 3 , T u e t i n g , in press, for r e c e n t reviews) It 13
14
R T h'tll~mson, D M Seales/ Lvol, cd potenttals
may be noted here that the cognomen 'P~oo" will be used %1 thl,, phenomenon throughout this paper purely as a lnatter of ~onvemence and without prejudice to the vmws o f the present autho)s, o~ othels, as to the latency of this event or its quahflcatmns to be considered one of the components of the stnnulus-ew~ked response The aim o f the study is to examine tire relationship of P~oo to performance in a vigilance, as opposed to a psychophyslcal, setting of signal detectmn in ordel to learn more about the psychological s~gnlflcance o f thePa0o wave In vigilance tasks the stgnal detection palameters d' and 3 have been shown to vary with time at work (Broadbent and G~egory, 1963, see Broadbent, 1971, pp 6 6 - 1 1 l, for review) The inaln questmn here is whethei PJoo covarles with these changes m d' and 3, and if so whether this corresponds to the covarlation found between PJo0 and d' and 3 when the parameters are signal strength (Hlllyard, Sqmres, Bauer and Lmdsay. 1971), signal probability, response confidence (Paul and Sutton, 1972. K Squires, N Squires and Hfllyard. 1975a, 1975b), and p a y o f f schedule (Paul and Sutton, 1972) As regards CNV, the questmn is whether it covanes with perfmmance as would be predicted by theories of vigilance based upon psychological prmmples of expectancy (Deese, 1955), and whether therefore It may provide a guide to individual differences in the abihty to lnamtam prolonged concentration during long, boring tasks 2 Method 2 ! Sublects and procedure 24 enlisted men between the ages o f 20 and 30 attended the laboratory one at a time for a single sessmn of about 3-hour duration to carry out the test of signal detection Dmmg tlus time electrodes were placed to record EEG and EOG (dectrooculoglam) The subject was then given instructions on the performance task, followed b y a prehmlna)y practice run o f 4 mm and a final one of 10 mm There followed a control run of 5 mm in which the subject heard and saw the task stimuh passively, hawng been instructed to ignore them and relax, but not fall asleep After a break o f about 5 mm the mare 40-rain task was c a m e d out This was followed by a further 5-mln control period passively ignoring the stlmuh Subjects were reformed befolehand that they would be given a summary o f thmr scores on the performance test and an indication of how they related to those of othel subjects 2 2 The perfi)rmance task The task was one of prolonged signal detection in which the subject had to detect faint tones in the plesence o f continuous white noise at a level 70 dBA above thleshold The tones were of frequency 1 KHz and duration 50 msec The test conslsted of 240 trials The lntertrlal interval vaned quasi-randomly from 3 to 13 sec
R T Wllkmson, D M Seales / Evoked potenttals
15
(mean 8 sec). A trial comprised three stlmuh coming at 1-sec intervals. The first ($1) was a short, high-pitched chck presented as a warning for the subject to listen for a possible signal 1 sec later The second ($2) was the signal, when it occurred (p = 0 5), combined with the brief offset of a hght-emlttmg diode (LED) The LED blink came whether a signal was present or not and acted as a time marker so that the subject could know precisely when the signal was absent as well as present (Sqmres et al, 1975a) Finally, 1 sec later, a low-pitched click ($3) served as a response cue directing the subject to report whether he had heard a signal. This he did by pressing one of four buttons on a response panel to indicate, respectively, no signal, signal reported at high confidence, signal at medium confidence, and signal at low confidence level. The chcks, tones, and white noise were presented through a loudspeakel located 30 cm behind the subject's head The LED hght was mounted 50 cm m front of the subject at eye level He was Instructed to fixate this hght as continuously as possible throughout the test. The LED provided a small, red light of moderate intensity, the bhnk of which was clearly discernible Signals occurred on half of the 240 trials. The order of signal and non-signal events was random over the first quarter of the test and this order was repeated m subsequent quarters An attempt was made to divide the signals into three levels of intensity. In fact the adjustment of signal strength was unsatisfactory m that the 'High' and the 'Medium' intensity signals were about the same and allowed a high probablhty of detection whereas the 'Low' antenslty ones were much more difficult to hear Unfortunately the time available for the experiment precluded a restart wath signal strengths adjusted, so it was decided to continue wath essentially two signal strengths, High for ] of the signals and Low fm the rest, randomized on the same basis as for the signal and non-signal stlmuh The performance records were scored m terms of Correct Detections (Hits) and Errors of Omlssmn (Misses) in the case of trials containing signals, and False Alarms (FAs) and Correct Rejections (CRs) for the non-signal-bearing trads In addition, measures of d' and/3 were obtained from the observed overall probabilities of Hit and FA by entering Freeman's 'Table of d' and/3' (1973) with the appropriate figures Unfortunately these assessments must be heated with some clrcumspectmn because of the two intensities of signal used It is not clear what degree of normahty is expected of the neurological 'noise' and 'noise plus signal' dlstnbutmns as assumed by the Theory of Sagnal Detection for calculating d' and 13, nor can actual distributions be measured in the brain Nevertheless, the present assessments of d' and 13 should be legarded as more approximate than usual, for with two signal strengths rather than one there is a greater probablhty of departure from normahty. However, there is one change m/3 which is of particular importance to the conclusions drawn from this study, namely an increase in 13from first to second half of the test In this case it is assumed that if both Hits and Fas fall with tame on task it is reasonable to conclude that cntermn has moved in the direction of greater caution, that is, a change slmflm to a rise in 13has occurred
16
R T h'tlkmson, D M Scales 1.) oAed potcnttala
2 3 E l e c t r o p h y s t o l o g t c a l m e a s u r e s a n d t h e i r analysis
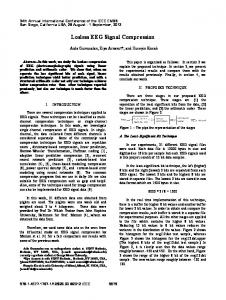
Sllvm disc electrodes wele e m p l o ) e d m recording EEG between Ce and hnked mastoids (impedance < 5 kg2), and EOG from snes located &agonall? on the upper and lower canthl of the left eye Electrode sites were cleansed u n h acetone Further, to reduce skin potentials at the EEG recording sites, the outer layers of skin were removed by abrasmn w)th pmmce paste EEG and EOG we)e amphfled and w m t e n out by means o f a Beckman Type R Dynoglaph (response 3 dB down at 0 02 and 32 Hz) The wrlteout also contained malkers coded m relation to the nature of the signal tone and the subject's response Data were stored on analogue tape for offlme analysis using a PDP-12 computer EEG and EOG were digmeed for each trial from a point 500 msec before the onset of the warning chck (S~) for a period of 3 sec (256 dlgmzatmn points), that is to a point 500 msec after the onset of the response-cue chck ($3) Polygraph records were examined visually for reals with eye movements clea)ly influencing the morphology o f the EEG and also t~mls with muscle altefact These trials (mean 25(~, mtersubject range 1 5 - 3 8 # ) were deleted from further electrophystologmal analysis, though not from analyses of performance Acceptable trials were combined into ave)aged event-related potentmls (ERPs) m relation to var)ous criteria (e.g tone mtensny confidence o f response, quarter of task), and a tutther check for the influence of eTye movements was made by exammg the ave,aged EOG obtained wnh each ERP. No further reJection o f ERPs was wmlanted The electrophys)olog)cal measures a,e dlustrated m fig 1 and were as follows (1) CNV The amphtude of the EEG averaged over the period 50 msec before the point o f signal onset and related to the EEG level averaged over the 50 msec p~mr to the onset of the warning d i c k (2)P~o0 The posltlvny of the EEG tiace 300 msec aftra the s~gnal onset related to the average EEG level over the 50 msec prior to the s)gnal onset point
.~_ ~--'L~ .. I See" Worn
CN~" V ~= ~ I / |$e(:" ~I S=g. ~ Resp.
Fig 1 Schematic ot an averaged event-related potential to illustrate the m e t h o d o1 quantifying CNV and P3o0 amphtudes Blocks indicate where a mean value `has derived from 50 msec o f EEG The P 3 0 0 trough ,has measured at a single point 300 msec lollo'alng signal onset Warn = ~ a r m n g click, Slg = signal onset and brmt LED offset (50 msec), Resp = response-cue chck
R T Wtlkmson, D M Seales / Evoked potentials
17
2 4 Stattsttcal analysts Non-parametric statastlcs (Siegel, 1956) were used throughout to avoid assumptions being made about the normality of the dxstrlbutaons of the data Spearman's rho was used for correlations and exther a simple Binomial Test or Wllcoxon's Matcheo Pairs, Signed Ranks p~ocedure (T) for comparing pairs of scores o~ electrophysiological levels
3. Results Fig 2 dlustrates for a typical subject the 3-sec, computer-averaged examples of the EEG derwed for the various combinations of trials reported below The figure also shows the averaged traces (combined) for the passwe control runs which were
Hit Category ~
Miss
~
FA
~
CR ~'~
No
Category~ ~
[~/
rone]
~
H
Cot rol ]
Confidence Level
Quarter 't We
~ ~
~J
~/
il~p.
Fig 2 Three-second averages of EEG, covering a whole trial, from one typical subject The last trace, thtrd row is from the pre- and post-test passwe control runs Otherwise in each row the total of 240 trials (less about 25% lost through eye, muscle, or movement artifact) are subdwlded along different dmaenslons category of behavloural response, signal intensity, response confidence, and quarter of the test The number of samples m each average trace as shown to the right of the trace Events during each trml are denoted as follows Warn = warning clack (St), Slg = signal onset point ($2), Resp = response-cue chck ($2)
l8
R F Wdkmson. D M Scales / 1-vo~ed potenttals
Table 1 Measures derived from averaged EEG traces samples as a lunctmn ot behavloural response, signal intensity, and response confidence P3 oo
CNV
Behavloural response
Hits FA CR Miss
14 3 7 4 a) 6 8 a) 6 2 a)
54 64 48 36
Signal intensity
High Medium Low
14 6 15 1 7 7 b)
_
Confidence level
High Medium Low
15 3 6 l c) 6 9 c)
59 52 51
a) Amphtude less than that of Hits, p < 0 01 b) Amphtude less than that of High or Medium intensity signals, p < 0 01 c) Amplitude less than that of High confidence, p < 0 01
presented before and after the main 40-ram performance test Table 1 shows the measures of P3oo and CNV averaged over all subjects and derived from the EEG traces averaged with respect either to Behavloural Response, Signal Intensity, or Response Confidence 3 1 Behavloural response The amplitude of P3oo associated with Hits was lalger than that to CRs m all 15 subjects ( p < 0 001), and larger than that to Misses and FAs in 14 out of 15 subjects in each case (p < 0 001) There were no slgmficant differences among the latter three categories 3 2 Stgnal m t e n s t t y As would be expected d' was higher for the High (d ' = 5.00) than for the Low intensity (d' = 0.77) signals in all subjects (p < 0 0 0 l ) The same was true for the amphtude of P3oo (P < 0.001) Thus, when the intensity of the signal was varied from trial to trial durmg a long test, a large P3oo was associated with high slgnal &scrmnnablhty (d') 3.3. Confidence level For comparisons revolving confidence level the numbers of subjects considered was hmlted to 12 This was due to some subjects fading to make any responses in
19
R T Wtlkmson, D,M Seales / Evoked potentials
the Medxum or Low categories of confidence Signals (or FAs) which were reported at a High level of confidence were associated with higher P3o0 waves than those reported at Medium or Low levels of confidence in 12 out of 12 (p < 0 001) and 11 out of 12 (t9 < 0 01) subjects respectwely High confidence is normally associated with a high level of/3 (more Hits m relation to the number of FAs) Thus when confidence level was the parameter hxgh /3 was assocmted with a high amplitude of PJoo 3 4 Changes with ttme on task
Changes m performance and EEG as a function o f time on task were examined by dividing the test into halves, and assessing the difference between first half and second half score For the purpose of correlating time-related changes of the various measures within each subject scores were taken over each quarter of the test Where d' and/3 were calculated only 12 subjects could be included in the analysts involving halves of the test. This was because three subjects faded to make any FAs m at least one of thear halves, for the same reason only nine subjects could be included m the within-subject correlations, considered later, of d' and/3 with CNV and P3oo across quarters of the test Table 2 shows Hits, FAs, P3oo and CNV averaged for each quarter of the test The measures of P30o and CNV were derived from all artefact-free trials m each quarter A freer analys~s within quarters was impossible because the numbers of samples per average trace would have been too small for clear measurement of the P3oo and CNV amplitudes Values of d' and 13 were averaged in the same way for
Table 2 Scores m the performance and EEG measures In each quarter of the test, or half of the test m the case of d' and Quarters of the test
Hits (%) False alarms (%) P3oo (,uV) CNV (~V)
1
2
3
4
81 8 18 0 11 1 52
77 3 17 1 10 8 7.0
75 1 15 6 81 36
70 7 14.9 92 54
Halves of the test
d' (N = 12) (N = 12)
1
2
1 87 1 47
1 79 2 08
20
R T Wilkinson, D M 5ealcs / Lroked porenttals
each half of the test for the 12 subjects for whom these parameters could be calculated on a half-test basis As regards performance the results confirm an general those of Deaton, Tobias, and Wilkinson (1971) for changes with time oil task in a prolonged test of signal detection From first to last half o f the test l-hts felt in 14 out of 15 s u b j e c t s ( p < 0 0 0 1 ) F a l s e A l a m l s fell a l s o ( T = 1 9 ~ , N = 1 3 , p < 0 0 5 . one-tail) Taken together these ~esults suggest that the subjects' criterion becanle more cautious from first to second half of the test, and m some confirmation of this the measure 3 (though an approxnnatlon, see section 2 2 above) rose in 11 out of 12 subjects (p < 0 0 l ) Regarding sensltlVlty, there was no significant change in d' with time on task, although the downward direction of change was again the same as that found by Deaton et al (1971) Assessing the physiological measures on the same basis, there was a dechne in the amplitude o f b o t h P 3 0 o , (T = 10, N = 15, p < 0 01), and CNV (T = 18, N = 14, p < 0 02) from first to second half of the test In order to see whether the average confidence level of ~eports changed during the course of the test an arbitrary measure was detlved by counting 3, 2, and 1 respectively for High, Medmm, and Low confidence reports, summing, and dividing the total by the numbers of such reports for each subject and for each quarter of the test On this basis the change m response confidence was small during the test and insignificant statlstically, the figures being 2 67, 2 65, 2 64 and 2 64 for the first through fourth quarters Eight subjects showed a fall and six an increase m confidence with time 3 5 Correlattons, wtthtn sublects, as a function o f t t m e on task
For each subject the scores o f Hits In each quarter were correlated with the corresponding levels o f P30o using Spearman's rho These correlations were then averaged over all subjects and the significance of the difference o f this average from zero assessed by the Wllcoxon procedure For the colrelatlon between Hits and P3oo rho = +0 24, N = 15 and between Hits and CNV rho = +0 12, N = 15 Neither correlation was significant Similar correlations were performed for d' and/3 in relatmn to the P3oo and CNV for the nine subjects for whom d' and 3 could be calculated in every quarter of the test (i e had no zero F A scores m an)' quarter) Both o f the correlations involving P3oo were significant P3oo vs d', rho = +0 36, N = 9 (pchoph)slolog), 10, 125-138 Siegel, S (1956) Nonparametrlc Statistics, New • ork McGraw-Hill Sqmres, K C , Hlllyard, S A and Llndsa}, P tl (1973) Vertex potentials evoked during auditory signal detection Relation to decision critena Perception and Ps} choph~ SlCS,4 , 2 6 5 272 Sqmres, K C , Squires, N K and Hlllyard, S A (1975a) Decision-related cortical potenuals during an auditor}' signal detection task x~lth cued observation intervals Journal ot Experimental Psychology Human Perception and Performance, 1 , 2 6 8 - 2 7 9 Squires, K C , Squires, N K and Hlllyard, S A (1975b) Vertex evoked potentials in a ratingscale detection task Relation to signal probabfllt~ Behavioral Blolog}, ] 3 21 34 Sutton, S , Braren, M Zubln, J , and John, L R (1965) Evoked potential correlates oI stimulus uncertainty Science, 150, 1187-1188 Tanner, W P and Swets, J A (1954) A deClslon-lnaklng theory of visual detection Ps)chologlcal Review, 6 1 , 4 0 1 - 4 0 9 Tuetlng, P Event-related potentials, cognitive events, and inlormatlon processing In Otto, D (Ed) Proceedings of the Fourth International Congress on Fvent Related Slow Potentials of the Brain, US Government, (In press) Tuetmg, P and Sutton, S (1973) The relationship between pre-stlmulus negative shifts and post-stimulus components of the averaged evoked potential In Kornblum, S (Ed I &ttentlon and Performance IV, New York Academic Press Vanghan, H G and Rltter, W (1970) The sources ot auditory evoked responses recorded trom the human scalp Electroencephalography and Chmcal Neurophyslology, 28,360 367 Walter, W G , Cooper, R , Aldrldge, V J , McCallum, W C and Winter, A L (1964) Contingent negative variation an electrical sign of sensorlmotor association and expectancy in the human brain Nature (London), 203,380 384 Wilkinson, R T (1976) Relationship between CNV, its resolution and the evoked response In McCallum, W C and Knott, J R (Eds), The Responsive Brain, Bristol John W'rlght and Sons Wilkinson, R T and Asby, S A (1974) Selective attention, contingent negative variation and the evoked potential Biological Psychology, 1, 167-179 Wilkinson, R T and Lee, M V (1972) Auditory evoked potentials and selective attention Electroencephalography and Chnical Neurophyslology, 33, 411 418 Wilkinson, R T and Morlock, H C 11967) Auditor} evoked response and reaction rune Iclectroencephalography and Cllmcal Neurophyslology, 23, 5 0 - 5 6 Wilkinson, R T and Spence, M T (1973l Deterlnmants of the post-stimulus resolution of contmgent negative variation ICNVI Flectroencephalography and Cllmcal Neurophs}lology, 35,503-509