RESEARCH ARTICLE
EEG Findings of Reduced Neural Synchronization during Visual Integration in Schizophrenia Jonathan K. Wynn1,2*, Brian J. Roach3, Junghee Lee2,1, William P. Horan1,2, Judith M. Ford3,4, Amy M. Jimenez1, Michael F. Green2,1 1 Veterans Affairs Greater Los Angeles Healthcare System, Los Angeles, CA, United States of America, 2 Psychiatry and Biobehavioral Sciences, University of California Los Angeles, Los Angeles, CA, United States of America, 3 Veterans Affairs San Francisco Medical Center, San Francisco, CA, United States of America, 4 University of California San Francisco, San Francisco, CA, United States of America
a11111
*
[email protected]
Abstract
Data Availability Statement: All relevant data are within the Supporting Information files.
Schizophrenia patients exhibit well-documented visual processing deficits. One area of disruption is visual integration, the ability to form global objects from local elements. However, most studies of visual integration in schizophrenia have been conducted in the context of an active attention task, which may influence the findings. In this study we examined visual integration using electroencephalography (EEG) in a passive task to elucidate neural mechanisms associated with poor visual integration. Forty-six schizophrenia patients and 30 healthy controls had EEG recorded while passively viewing figures comprised of real, illusory, or no contours. We examined visual P100, N100, and P200 event-related potential (ERP) components, as well as neural synchronization in the gamma (30-60 Hz) band assessed by the EEG phase locking factor (PLF). The N100 was significantly larger to illusory vs. no contour, and illusory vs. real contour stimuli while the P200 was larger only to real vs. illusory stimuli; there were no significant interactions with group. Compared to controls, patients failed to show increased phase locking to illusory versus no contours between 40-60 Hz. Also, controls, but not patients, had larger PLF between 30-40 Hz when viewing real vs. illusory contours. Finally, the positive symptom factor of the BPRS was negatively correlated with PLF values between 40-60 Hz to illusory stimuli, and with PLF between 30-40 Hz to real contour stimuli. These results suggest that the pattern of results across visual processing conditions is similar in patients and controls. However, patients have deficits in neural synchronization in the gamma range during basic processing of illusory contours when attentional demand is limited.
Funding: Support for this study came from a VA Career Development Award to Jonathan K. Wynn, Ph.D., and NIMH Grants MH43292 and MH065707 (PI: Michael F. Green, Ph.D). The funders had no role in study design, data collection and analysis, decision to publish, or preparation of the manuscript.
Introduction
Competing Interests: The authors have declared that no competing interests exist.
Visual integration refers to the process by which basic local visual aspects, such as brightness, motion, and color, are combined to form a more complex visual percept, such as an actual
OPEN ACCESS Citation: Wynn JK, Roach BJ, Lee J, Horan WP, Ford JM, Jimenez AM, et al. (2015) EEG Findings of Reduced Neural Synchronization during Visual Integration in Schizophrenia. PLoS ONE 10(3): e0119849. doi:10.1371/journal.pone.0119849 Academic Editor: Sonja Kotz, Max Planck Institute for Human Cognitive and Brain Sciences, GERMANY Received: June 24, 2014 Accepted: January 17, 2015 Published: March 18, 2015 Copyright: This is an open access article, free of all copyright, and may be freely reproduced, distributed, transmitted, modified, built upon, or otherwise used by anyone for any lawful purpose. The work is made available under the Creative Commons CC0 public domain dedication.
PLOS ONE | DOI:10.1371/journal.pone.0119849 March 18, 2015
1 / 16
Visual Integration in Schizophrenia
object or shape [1]. Patients with schizophrenia have well-documented deficits in visual perception, including visual integration. The CNTRICS (Cognitive Neuroscience Treatment Research to Improve Cognition in Schizophrenia) Initiative prioritized visual integration as one of two key visual constructs for the study of schizophrenia [1]. Impairments in visual integration in schizophrenia are seen using various paradigms, including contour integration [2], perceptual closure [3], and facial processing [4]. Integration can occur through synchronization of cortical activity, as well as through feedback from higher neural levels to lower neural levels [5]. However, nearly all studies of visual integration have occurred in the context of an active attention task, requiring the participants to make some judgment on the object being presented. The current study was designed to examine in close detail the early perceptual processes involved with visual integration of illusory and real figures during a passive task. In healthy samples, visual integration, in particular Gestalt processing, can be examined through the use of illusory contours (IC), known as Kanizsa figures [6] (see Fig. 1). The neural mechanisms of Kanizsa shape perception are well-described in non-clinical animal and human samples. Electroencephalography (EEG) and functional magnetic resonance imaging studies have shown that illusory contour processing is localized to bilateral lateral occipital cortex (LO) [7,8]. However, it has also been demonstrated that recurrent feedback information from LO to V1 and V2 [9] and even from V2 to V1 is also necessary for completion of illusory processing [10].
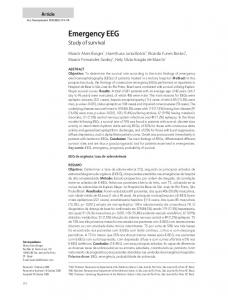
Fig 1. Example of stimuli, comprised either real figures (square or diamond) or no figures. Real figures were composed of either real contours (RC) or illusory contours (IC). No figure stimuli contained no contours (NC). A small fixation dot at the center of the stimulus changed from black to red and vice versa periodically. doi:10.1371/journal.pone.0119849.g001
PLOS ONE | DOI:10.1371/journal.pone.0119849 March 18, 2015
2 / 16
Visual Integration in Schizophrenia
EEG studies in healthy populations using Kanizsa stimuli have shown that N100 eventrelated potentials (ERP) are larger to stimuli with IC versus those with no contours (NC) [11,12,13,14]. Similarly, EEG time-frequency analyses have shown increased gamma band (25–70) Hz neural synchrony (e.g., intertrial phase locking factor, PLF) to illusory vs. no contours [15]. Gamma-band synchronization is thought to be involved with feature-binding, a bottom-up process that “binds” distinct aspects of the same stimulus into a coherent object [16]. IC stimuli have been examined with EEG in schizophrenia using active tasks in which participants determine the presence or absence of an illusory figure. In these studies, patients exhibit an overall reduced P100 compared to controls, while both patients and controls exhibit a larger N100 to IC versus NC stimuli [15,17,18,19]. However, in one study with a passive task, patients showed intact P100 amplitudes, and neither group showed a larger N100 to IC versus NC stimuli [20]. Patients did exhibit a slightly prolonged P100 latency compared to healthy controls when viewing IC stimuli, indicating a delayed neural response when visual integration of illusory contours is necessary. Schizophrenia patients also have deficits in synchronizing activity within the gamma-band, between 30–60 Hz, during IC processing [15,17,18], suggesting that a failure to synchronize neural activity may underlie visual integration deficits. These deficits are potentially due to reported N-methyl-D-aspartate receptor hypofunction [21,22] located on inhibitory interneurons [23,24] which are thought to be responsible for EEG synchronization [25,26]. Moreover, gamma band deficits during illusory contour processing have been shown to be correlated with positive symptom severity (e.g. [15]). The studies mentioned above that used IC stimuli in active tasks all yielded similar findings. However, it is not clear whether patients exhibit neural activation and gamma synchronization deficits when attention to the stimuli is limited, as only one previous study included such a task and found a different pattern of results. Hence, in the current study we had three aims. First, we examined differences in EEG measures of neural activity and synchronization to IC and NC stimuli that were matched for their physical characteristics. We hypothesized that healthy controls and schizophrenia patients would show larger N100 amplitude to IC versus NC figures, but only controls would show greater synchronization to IC stimuli. Second, we examined differences in neural activity and synchronization generated by IC and real contours (RC) (i.e., luminance-defined contours) in which the psychological experience was similar (i.e., impression of contour). We hypothesized that there would be a main effect of group (patients would show overall ERP amplitude and synchronization deficits compared to controls) but no effect of condition on neural activity or synchronization. Finally, we hypothesized that positive symptoms would be correlated with gamma band activity in the schizophrenia patients.
Methods Participants EEG data were initially collected in 48 patients with schizophrenia (40 male, 8 female) and 31 healthy controls (24 male, 7 female). Schizophrenia patients were recruited from outpatient treatment clinics at the Veterans Affairs Greater Los Angeles Healthcare System (GLA) and through presentations in the community. Forty-five patients were receiving second generation antipsychotic medication, 2 patients were receiving first generation antipsychotic medication, and 1 was taking both types of medication at the time of testing; medication information for 2 patients could not be obtained. All patients met diagnostic criteria for schizophrenia based on the Structured Clinical Interview for DSM-IV Axis I Disorders (SCID; [27]. Patients were between 18 and 60 years of age, and were excluded from participation if they had: substance abuse in the past month or dependence in the last six months, IQ < 70 based on examination
PLOS ONE | DOI:10.1371/journal.pone.0119849 March 18, 2015
3 / 16
Visual Integration in Schizophrenia
of medical record, a history of loss of consciousness for more than one hour, an identifiable neurological disorder, or were not sufficiently fluent in English to consent and understand procedures. Psychiatric symptoms were evaluated using the expanded 24-item UCLA version of the Brief Psychiatric Rating Scale (BPRS; [28] and the Scale for the Assessment of Negative Symptoms (SANS) [29]. For the BPRS we report the total score and means for the “positive symptom,” “negative symptom,” “agitation/mania,” and “depression/anxiety” factors [30]. Healthy control participants (between 18–60 years of age) were recruited through advertisements in local newspapers and internet postings. An initial screening interview excluded potential healthy controls who had any identifiable neurological disorder or head injury, had a first-degree relative with schizophrenia or another psychotic disorder, were not sufficiently fluent in English, had a personal history of schizophrenia or other psychotic disorder, bipolar disorder, recurrent depression, had a lifetime history of substance dependence, or had any substance abuse in the last 6 months. Potential healthy control participants were interviewed with the SCID-I and portions of the Structured Clinical Interview for DSM-IV Axis II Disorders (SCID-II; [31], and were excluded if they had any of the following Axis II disorders: avoidant, borderline, paranoid, schizoid, or schizotypal. All SCID interviewers were trained through the Treatment Unit of the Department of Veterans Affairs VISN 22 Mental Illness Research, Education, and Clinical Center (MIRECC) to a minimum kappa of 0.75 for key psychotic and mood items. All participants had the capacity to give informed consent and provided written informed consent after all procedures were fully explained in accordance with procedures approved by the Institutional Review Boards at the University of California, Los Angeles (UCLA) and GLA.
Procedures Participants viewed images (diamonds or squares) that contained illusory (IC), no (NC), or real contours (RC). Images were comprised of a series of inducers (“pacmen,” i.e. circle with a cut-out wedge) and/or lines that were arranged to form the figures (see Fig. 1). For the RC figures, lines were drawn between inducers to form a continuous contour; for IC figures, inducers were arranged to give the illusion that a figure was present; for NC figures, inducers were arranged such that no figure could be discerned. Stimuli were presented on a 17-inch cathode ray tube computer monitor with a screen refresh rate of 160 Hz, positioned 1 m from the participant. Each inducer measured 1.55 degrees of visual angle, with a wedge that was created by removing 25% of the circle. One side of the real / illusory image (square or diamond) measured 3.72 degrees, resulting in a support ratio of 0.42 [32]. To ensure that participants were actively engaged with the task and were awake and watching the monitor, they were instructed to view a central fixation point that was present throughout the experiment and to push the mouse button whenever the color of the fixation changed from black to red and vice versa (33 times). Participants had 3000 ms to make a response. IC, RC and NC stimuli were displayed for 250 ms followed by an intertrial interval (ITI) that varied between 1700–3800 ms. Each of the six stimulus types (real, illusory, and no contour; square and diamond) were randomized in blocks of six trials for a total of 20 blocks, resulting in a pseudo-randomized fixed order of 120 trials. This same sequence was presented three times in a row, for a total of 360 trials. At most, two stimuli could be repeated in a row. The task took approximately 20 minutes to complete.
EEG Recording and Processing Participants had their EEG activity recorded continuously using a Neuroscan SynAmps2 amplifier (Compumedics USA, Charlotte, NC). Data were sampled at 500 Hz with filter settings of
PLOS ONE | DOI:10.1371/journal.pone.0119849 March 18, 2015
4 / 16
Visual Integration in Schizophrenia
1.0 to 100 Hz. Sixty-four equidistant cap-mounted, sintered Ag-AgCl electrodes were positioned using a modified international 10–20 system placement scheme. Additionally, four electrodes were used to measure horizontal electrooculogram (EOG; placed on the outer canthus of the left and right eye) and vertical EOG (placed above and below the left eye). All electrodes were referenced to a point halfway between electrodes Cz and CPz and a forehead ground was employed.
EEG Analyses ERP Waveforms. All ERP data were processed using BrainVision Analyzer 2.0 software (Brain Products, Germany). Data were re-referenced offline to the left and right mastoids. Eyeblinks were removed from the data using established mathematical procedures [33]. Data were epoched to 100 ms pre- and 600 ms post-stimulus onset and then low-pass filtered at 20 Hz (24 dB/Hz rolloff). Baseline correction on the 100 ms prior to stimulus presentation was applied. Artifact rejection was performed for any trial that exceeded +/−100 μV at any electrode site. Two patients and 1 control were excluded for having excessively noisy data due to continuous muscle artifact or electrode shorting; thus, the final sample size for analyses was 46 patients and 30 controls. For the remaining participants, there was no significant difference in the number of trials accepted for each figure type or for each group (see Table 1). We examined three separate ERP components: the P100, N100 and P200. A 40 ms time window of activity (+/- 20 ms around the peak) was defined for each ERP component based on the peak activity observed by inspection of butterfly plots and scalp current density (SCD) maps (see Fig. 2). SCD maps are reference-free and reduce the effect of volume conduction due to current flow within the scalp, thus approximating the source of intracranial generators and help narrow down the number of electrodes to analyze [14]. Based on inspection of the SCD maps where activity was most prominent for each component, we examined activity averaged across electrodes P3, P5, P7, PO3, PO5, and PO7 (left hemisphere) and P4, P6, P8, PO4, PO6, Table 1. Mean (SD) demographic information, symptom ratings, behavioral performance, and accepted EEG trials. Schizophrenia Patients (n = 46)
Healthy Controls (n = 30)
Age
45.8 (10.9)
42.4 (9.3)
Education*
12.6 (1.1)
14.1 (1.9)
Parental Education
13.3 (3.3)
14.7 (3.0)
Male:Female
40:6
23:7
BPRS Total Score
43.5 (10.8)
Factors (mean score per item) Positive Symptoms
2.2 (0.9)
Negative Symptoms
1.7 (0.8)
Depression/Anxiety
1.8 (0.6)
Agitation/Mania Mean performance (out of 33)
1.4 (0.5) 26.9 (7.9)
30.1 (6.2)
Illusory Contours
100.7 (17.7)
104.4 (15.9)
No Contours
100.5 (18.1)
105.5 (15.1)
Real Contours
99.4 (18.3)
105.5 (15.7)
Mean accepted EEG trials (out of 120)
* p < 0.05 difference between groups. doi:10.1371/journal.pone.0119849.t001
PLOS ONE | DOI:10.1371/journal.pone.0119849 March 18, 2015
5 / 16
Visual Integration in Schizophrenia
Fig 2. Butterfly plots for each group and figure type time locked to target onset (0 ms) for controls (top) and patients (bottom) for all three figure types (IC, NC, RC). Scalp current density (SCD) maps for the corresponding three main ERP components (P100, N100, P200) are plotted. doi:10.1371/journal.pone.0119849.g002
PO8 (right hemisphere). The mean EEG activity within each window was used for the main dependent measure. The time windows for each component and each task for both groups are shown in Table 2. We additionally examined P100 latency in order to compare our results to those of Ikeda et al. [20]. Time Frequency Analysis. After eyeblink correction, data were epoched to 1000 ms preand 1500 ms post-stimulus onset. No filtering was applied. We examined activity for the same electrodes used in the ERP analysis. Artifact rejection was performed on these electrodes between 250 ms pre- and 750 ms post-stimulus, so that any trial with activity within this window that exceeded +/−100 μV was rejected. Time-frequency analysis was performed using the FieldTrip plugin for Matlab [34]. A Morlet wavelet decomposition was performed across all time points and all frequencies between 2–70 Hz. The wavelet’s Gaussian shape was defined by a constant ratio (σf = f/7) and wavelet duration (3σt), where f is the center frequency and σt = 1/(2πσf). At 40 Hz, the wavelet duration is over six cycles (4σt = 167.1 ms) with a spectral bandwidth of 4σf = 34.2857 Hz. FieldTrip performed wavelet decompositions by multiplying the Fast Fourier Transform (FFT) of the wavelet by the FFT of the signal. The inverse FFT of the resultant is adjusted so that the time course
PLOS ONE | DOI:10.1371/journal.pone.0119849 March 18, 2015
6 / 16
Visual Integration in Schizophrenia
Table 2. Time-windows (in ms) of analysis for schizophrenia patients and healthy controls for illusory, no contour, and real figures. P100
Patients
Controls
Illusory Contour
70–110
66–106
No Contour
72–112
64–104
Real Contour
70–110
64–104
Illusory Contour
136–176
134–174
No Contour
138–178
134–174
Real Contour
134–174
128–168
Illusory Contour
230–270
222–262
No Contour
232–272
224–264
Real Contour
220–260
210–250
N100
P200
doi:10.1371/journal.pone.0119849.t002
of the data corresponds to the time course of the original signal. These calculations are conducted in 1 Hz steps. Each trial was analyzed with this method after which the PLF was determined (calculated as 1 minus the phase variance). Larger PLF values at a specific frequency within a specific time window indicate that oscillations have become phase-synchronized across trials with respect to event onset. Based on visual inspection of the time frequency plots, we identified two separate bursts of activity between 70–100 ms: one between 30–40 Hz and the other between 40–60 Hz. We therefore examined mean PLF between 70–100 ms separately for these two gamma bursts, averaged across all electrodes examined. This time-frequency window was similar to time-frequency windows where early gamma band responses have been reported [13,15,18]. Statistical Analysis and Key Contrasts. We conducted two sets of analyses each for the ERP and PLF data to address our hypotheses. The first set of analyses focused on the contrast between IC and NC stimuli because these are matched for the physical characteristics of the stimuli on the screen. The second focused on the contrast between IC and RC stimuli, in which the psychological experience is similar. Repeated measures analysis of variance (ANOVAs) were used with figure type and hemisphere as the within subject factor, and group was the between subject factor. We report effect sizes as partial eta-squared (ηp2). Follow-up Bonferonnicorrected t-tests were used to examine significant main effects or interactions. An alpha level of p = 0.05 was used for all ERP and PLF analyses. Finally, we examined correlations between the positive BPRS factor and its associated items and ERP and PLF measures to all three stimulus types (IC, RC and NC).
Results Demographic and Clinical Characteristics Table 1 lists the group demographics, symptom ratings on the BPRS for the patients, mean behavioral performance, and mean number of accepted EEG trials per figure type for the final sample of 46 patients and 30 controls. As most of our patient participants were recruited from VA clinics the sample is predominantly male. Patients were clinically stable and exhibited mild clinical symptoms. For EEG, there was no significant difference in mean (SD) performance in detecting the color change between patients and controls.
PLOS ONE | DOI:10.1371/journal.pone.0119849 March 18, 2015
7 / 16
Visual Integration in Schizophrenia
Fig 3. ERPs at electrodes PO7 and PO8, with the P100, N100 and P200 marked with arrows. A) ERPs comparing the IC (black) and NC (red) stimuli along with the IC-NC difference (blue). B) ERPs comparing the IC (black) and RC (green) stimuli along with the IC-RC difference (blue). doi:10.1371/journal.pone.0119849.g003
Illusory vs. No Contour Analyses ERP Results. Representative waveforms for electrodes PO7 and PO8 are shown in Fig. 3A. Waveforms for IC (black) and NC (red) and the difference between the respective conditions (blue), are plotted. The P100, N100, and P200 responses are marked with arrows. Mean amplitudes for each ERP for each group are shown in Table 3. P100. There were no significant main effects of group, figure type or hemisphere, and no significant interactions for amplitude. There was a significant effect of hemisphere for latency, (F1, 74 = 4.19, p < 0.05, ηp2 = 0.05), with faster latencies in the left vs. right hemisphere, 83.2 (12.1) and 85.8 (11.8) ms, respectively. N100. There was a marginally significant main effect of group (F1, 74 = 3.22, p < 0.08, ηp2 = 0.04), a significant main effect of figure type (F1, 74 = 34.74, p < 0.001, ηp2 = 0.32), and a significant main effect of hemisphere (F1, 74 = 4.72, p < 0.05, ηp2 = 0.06). There were no significant interactions. The marginal effect of group was because controls tended to have a larger N100 than patients, -2.85 (1.91) μV vs. -2.10 (1.53) μV, respectively. The main effect of figure type was due to larger responses to IC vs. NC figures, -2.69 (1.93) and -2.03 (1.61) μV,
PLOS ONE | DOI:10.1371/journal.pone.0119849 March 18, 2015
8 / 16
Visual Integration in Schizophrenia
Table 3. Mean (SD) ERP amplitudes and phase locking factor (PLF) values for patients and controls for illusory, no contour, and real figures. Patients
Controls
P100
Left
Right
Left
Right
Illusory Contour
0.37 (0.96)
0.41 (1.06)
0.56 (0.66)
0.39 (0.75)
No Contour
0.53 (0.82)
0.53 (0.93)
0.52 (0.65)
0.45 (0.73)
Real Contour
0.54 (0.92)
0.41(0.99)
0.59 (0.73)
0.31 (0.93)
Illusory Contour
-2.15 (1.74)
-2.63 (2.12)
-3.07 (2.08)
-3.21 (2.06)
No Contour
-1.61 (1.44)
-1.92 (1.64)
-2.41 (1.77)
-2.47 (1.89)
Real Contour
-1.95 (1.46)
-2.37 (1.86)
-2.86 (2.15)
-3.06 (2.10)
Illusory Contour
1.41 (1.37)
1.51 (1.61)
2.43 (1.65)
2.64 (1.76)
No Contour
1.44 (1.31)
1.67 (1.70)
2.34 (1.54)
2.42 (1.76)
Real Contour
1.81 (1.74)
2.31 (2.19)
3.15 (1.79)
3.39 (2.01)
Illusory Contour
0.11 (0.04)
0.11 (0.04)
0.12 (0.07)
0.14 (0.09)
No Contour
0.10 (0.04)
0.10 (0.04)
0.13 (0.08)
0.14 (0.10)
Real Contour
0.11 (0.05)
0.12 (0.06)
0.17 (0.08)
0.18 (0.09)
Illusory Contour
0.10 (0.03)
0.10 (0.03)
0.13 (0.07)
0.13 (0.07)
No Contour
0.09 (0.02)
0.10 (0.02)
0.11 (0.05)
0.11 (0.05)
Real Contour
0.10 (0.03)
0.11 (0.03)
0.12 (0.08)
0.13 (0.09)
N100
P200
PLF: 30–40 Hz
PLF: 40–60 Hz
doi:10.1371/journal.pone.0119849.t003
respectively. The main effect of hemisphere was due to larger responses in the right vs. left hemisphere, -2.50 (1.87) vs. -2.22 (1.70) μV, respectively. P200. There was only a significant main effect of group (F1, 74 = 7.88, p < 0.01, ηp2 = 0.10), due to controls having a significantly larger P200 than patients, 2.46 (1.56) μV vs. 1.51 (1.37) μV, respectively (see Table 3 for means). Phase Locking Factor Results. Time-frequency plots of phase locking at representative electrodes PO3, PO4, PO7, and PO8 are shown in Fig. 4. We examined mean PLF (across all electrodes) separately within the 30–40 Hz and 40–60 Hz frequency band between 70–100 ms, and these values are shown in Table 3. For the 30–40 Hz band, there was a significant main effect of group, F1, 74 = 4.15, p < 0.05, ηp2 = 0.05. Patients had significantly lower PLF compared to controls, 0.11 (0.02) vs. 0.13 (0.07), respectively. The main effect of figure type and the figure type x group interaction were not significant. For the 40–60 Hz band, there was a significant main effect of group, F1, 74 = 5.73, p < 0.02, ηp2 = 0.07, a significant main effect of figure type, F1, 74 = 9.56, p < 0.005, ηp2 = 0.11, and a significant group x figure type interaction, F1, 74 = 5.34, p < 0.03, ηp2 = 0.07. The interaction was due to controls having significantly greater PLF to IC compared to patients, 0.13 (0.07) and 0.10 (0.02), respectively, t74 = 2.91, p < 0.01. There was no significant difference between controls and patients for NC, 0.11 (0.05) and 0.10 (0.02), respectively, p < 0.24.
Illusory vs. Real Contour Analyses ERP Results. Representative waveforms for electrodes PO7 and PO8 are shown in Fig. 3B. Waveforms for IC (black) and RC (red) and the difference between the respective conditions (blue), are plotted. Mean amplitudes for each ERP for each group are shown in Table 3.
PLOS ONE | DOI:10.1371/journal.pone.0119849 March 18, 2015
9 / 16
Visual Integration in Schizophrenia
Fig 4. Time-frequency plots of phase locking factor for controls (top) and patients (bottom) for all three figure types. Plots from four representative electrodes (PO3, PO4, PO7, PO8) are shown. The scale for each plot is included. Frequency is plotted on the y-axis and ranges from 25–70 Hz (from top to bottom); time from onset of the stimulus is plotted on the x-axis and ranges from-100 to 500 ms. The blue box highlights the 30–40 Hz band and the red box the 40–60 Hz band that were analyzed. doi:10.1371/journal.pone.0119849.g004
P100. There were no significant main effects or interactions for amplitude. For latency there was a significant group x figure type interaction, (F1, 74 = 6.37, p < 0.02, ηp2 = 0.08). Healthy controls had significantly faster latencies to RC vs. IC stimuli, 81.4 (11.0) and 85.2 (9.6) ms, respectively, t29 = 2.55, p < 0.02. There was no significant latency difference in patients for RC vs. IC stimuli, 86.5 (11.5) and 85.0 (12.4) ms, respectively. N100. There was a marginally significant main effect of group (F1, 74 = 3.38, p < 0.07, ηp2 = 0.04), a significant main effect of figure type (F1, 74 = 4.41, p < 0.05, ηp2 = 0.06), and a significant main effect of hemisphere (F1, 74 = 6.77, p < 0.02, ηp2 = 0.08). There were no significant interactions. The marginal effect of group was because controls tended to have a larger N100 than patients, -3.05 (2.01) μV vs. -2.27 (1.66) μV, respectively. The main effect of figure type was due to larger responses to IC vs. RC figures, -2.69 (1.93) and -2.48 (1.82) μV, respectively. The main effect of hemisphere was due to larger responses in the right vs. left hemisphere, -2.75 (1.98) vs. -2.41 (1.82) μV, respectively.
PLOS ONE | DOI:10.1371/journal.pone.0119849 March 18, 2015
10 / 16
Visual Integration in Schizophrenia
P200. There was a significant main effect of group (F1, 74 = 9.12, p < 0.01, ηp2 = 0.11), a significant main effect of figure type (F1, 74 = 34.76, p < 0.001, ηp2 = 0.32), a significant main effect of hemisphere (F1, 74 = 5.25, p < 0.02, ηp2 = 0.07), and a significant figure type x hemisphere interaction (F1, 74 = 3.98, p < 0.05, ηp2 = 0.05). The main effect of group was because controls had a larger response than patients, 2.91 (1.65) μV vs. 1.76 (1.60) μV, respectively. The main effect of figure-type was due to larger responses to RC than IC stimuli. The figure type x hemisphere interaction was due to larger responses to RC stimuli in the right vs. left hemisphere, 2.74 (2.17) μV vs. 2.34 (1.87) μV, respectively; there was no difference between hemispheres to IC stimuli. Phase Locking Factor Results. Time-frequency plots of phase locking at representative electrodes PO3, PO4, PO7, and PO8, are shown in Fig. 4. For the 30–40 Hz band, there were significant main effects of figure type, F1, 74 = 9.91, p < 0.005, group, F1, 74 = 8.41, p < 0.005, and a significant figure type x group interaction, F1, 74 = 6.48, p < 0.02. The significant interaction was due to controls having significantly greater PLF to RC than IC stimuli, 0.17 (0.09) and 0.13 (0.07), respectively, t 29 = 3.21, p < 0.005. There was no significant difference between RC and IC stimuli for the patients, 0.11 (0.04) vs. 0.11 (0.03), respectively. For the 40–60 Hz band, there was only a significant main effect of group, F1, 74 = 6.18, p < 0.02, ηp2 = 0.08, due to controls having a larger PLF compared to patients, 0.13 (0.07) vs. 0.10 (0.02), respectively.
Correlations between Symptom Ratings and EEG Measures We first correlated the scores on the BPRS positive factor with each of the EEG measures (ERP and PLF). A significant negative correlation between the scores on BPRS positive factor and PLF values between 40–60 Hz in the right hemisphere to the IC figures, r = -0.34, p < 0.03 was found. In particular, the unusual thought content (r = -0.43, p < 0.001) and bizarre behavior (r = -0.30, p < 0.05) items accounted for this finding. PLF values between 30–40 Hz in the right hemisphere to RC figures also correlated on BPRS positive factor, r = -0.34, p < 0.03, in particular with unusual thought content, r = -0.44, p < 0.01. As an exploratory analysis, we examined additional correlations with the BPRS (depression/anxiety, agitation/mania, total) and the SANS global scores. PLF values between 30–40 Hz in the right hemisphere to RC figures correlated with total anhedonia scores on the SANS, r = 0.35, p < 0.02. There were also significant correlations between the scores on the BPRS agitation/mania factor and P100 amplitude in the left (0.41, p < 0.01) and right hemisphere (0.36, p < 0.02) to IC figures. Given the large number of these additional correlations performed they would most likely not survive familywise error correction and should be interpreted with caution.
Discussion This study examined the neural mechanisms involved with dysfunctional visual integration in schizophrenia while limiting the influence of attentional processing using EEG methodologies. Several key findings emerged from this study. First, patients and controls showed a similar pattern of ERP responses to the different figure types: both groups showed greater N100 amplitudes for IC compared to NC and both groups showed greater P200 amplitudes for RC compared to IC. Second, controls but not patients exhibited larger phase locking to IC compared to NC. Third, the positive BPRS factor (and items of unusual thought content and bizarre behavior) correlated with PLF values to IC stimuli in the right hemisphere. The results of this study demonstrate dysfunctional neural synchronization associated with visual integration in schizophrenia, even in the absence of specific attentional demands.
PLOS ONE | DOI:10.1371/journal.pone.0119849 March 18, 2015
11 / 16
Visual Integration in Schizophrenia
Regarding the key contrast between IC and NC stimuli, we found that the pattern of ERPs for illusory contour processing were intact in schizophrenia patients, consistent with previous ERP [11,12,14] and behavioral [35] findings. We found a non-significant trend for patients to show a lower N100 than controls, similar to other findings in the literature [15,17,18,19]. A novel finding of the current study is that, unlike controls, schizophrenia patients failed to show phase locking in the early (