17306 • The Journal of Neuroscience, November 23, 2011 • 31(47):17306 –17316
Behavioral/Systems/Cognitive
Effect of Auditory Cortex Deactivation on Stimulus-Specific Adaptation in the Medial Geniculate Body Flora M. Antunes1 and Manuel S. Malmierca1,2 1Auditory Neurophysiology Unit, Laboratory for the Neurobiology of Hearing, Institute of Neuroscience of Castilla y Leo ´n, Calle Pintor Fernando Gallego, 1, and 2Department of Cell Biology and Pathology, Faculty of Medicine, University of Salamanca, Campus Miguel de Unamuno, 37007 Salamanca, Spain
An animal’s survival may depend on detecting new events or objects in its environment, and it is likely that the brain has evolved specific mechanisms to detect such changes. In sensory systems, neurons often exhibit stimulus-specific adaptation (SSA) whereby they adapt to frequently occurring stimuli, but resume firing when “surprised” by rare or new ones. In the auditory system, SSA has been identified in the midbrain, thalamus, and auditory cortex (AC). It has been proposed that the SSA observed subcortically originates in the AC as a higher-order property that is transmitted to the subcortical nuclei via corticofugal pathways. Here we report that SSA in the auditory thalamus of the rat remains intact when the AC is deactivated by cooling, thus demonstrating that the AC is not necessary for the generation of SSA in the thalamus. The AC does, however, modulate the responses of thalamic neurons in a way that strongly indicates a gain modulation mechanism. The changes imposed by the AC in thalamic neurons depend on the level of SSA that they exhibit.
Introduction In nature, a critical task for the brain is to detect and attend to rare stimuli (Ranganath and Rainer, 2003). At the single-neuron level, the detection of rare stimuli is reflected by stimulus-specific adaptation (SSA), in which neurons respond strongly to rare stimulus while adapting to frequently occurring ones (Ulanovsky et al., 2003; Gutfreund and Knudsen, 2006; Reches and Gutfreund, 2008; Malmierca et al., 2009; von der Behrens et al., 2009; Antunes et al., 2010; Reches et al., 2010). SSA depends on the history of stimulation and on mechanisms operating at the inputs of the neuron rather than on activity-dependent mechanisms operating at the output of the neuron (Ulanovsky et al., 2003, 2004). Neurons showing SSA integrate sensory information to create a predictive model of the stimulation, detecting deviant features in the environment. In the auditory brain, SSA has been linked to auditory memory, recognition of acoustic objects, and scene analysis (Nelken, 2004; Winkler et al., 2009). SSA to the frequency of the acoustic stimulus has been identified in the midbrain, thalamus, and cortex (Ulanovsky et al., 2003; Pérez-González et al., 2005; Gutfreund and Knudsen, 2006; Reches and Gutfreund, 2008; Malmierca et al., 2009; von der Behrens et al., 2009; Antunes et al., Received April 17, 2011; revised Sept. 23, 2011; accepted Oct. 12, 2011. Author contributions: F.M.A. and M.S.M. designed research; F.M.A. performed research; F.M.A. and M.S.M. contributed unpublished reagents/analytic tools; F.M.A. analyzed data; F.M.A. and M.S.M. wrote the paper. Financial support was provided by the Spanish Ministerio de Ciencia y Innovacio´n (Grants BFU2009-07286 and EUI2009-04083, in the framework of the ERA-NET Network of European Funding for Neuroscience Research) and Junta de Castilla y Leo´n-Unio´n Europea (Grant GR221) to M.S.M. F.M.A. held a fellowship from the Spanish Ministerio de Educacio´n y Ciencia (BES-2007-15642). We are most grateful to Drs. Alan Palmer and Stephen Lomber for their helpful assistance and suggestions in setting up the cooling technique. We also thank Drs. Israel Nelken, Daniel Llano, Adrian Rees, Alan Palmer, Xiaoqin Wang, and Stephen Lomber for their critical and valuable comments on a previous version of this manuscript. Correspondence should be addressed to Dr. Manuel S. Malmierca, Auditory Neurophysiology Unit, Institute of Neuroscience of Castilla y Leo´n, University of Salamanca, C/ Pintor Fernando Gallego, 1, 37007 Salamanca, Spain. E-mail:
[email protected]. DOI:10.1523/JNEUROSCI.1915-11.2011 Copyright © 2011 the authors 0270-6474/11/3117306-11$15.00/0
2010; Reches et al., 2010; Taaseh et al., 2011). SSA is strong in nonlemniscal subcortical regions (Pérez-González et al., 2005; Malmierca et al., 2009; Antunes et al., 2010), but the primary auditory cortex (AC) is the first lemniscal station where it is widespread and strong (Ulanovsky et al., 2003). Thus, SSA has been suggested to emerge in the AC as a higher-order feature of sensory processing that can be transmitted to subcortical nuclei in a topdown manner (Nelken and Ulanovsky, 2007). However, this hypothesis remains untested. In the present study, we tested the hypothesis that SSA in thalamic neurons is inherited via corticofugal projections. A remarkable feature of the thalamus is the massive set of corticofugal projections it receives. In the auditory thalamus [the medial geniculate body (MGB)], these projections outnumber the ascending projections by a factor of 10 (Winer et al., 2001; Kimura et al., 2005; Lee and Winer, 2005; Ojima and Rouiller, 2011) and strongly modulate the responses of MGB neurons (Ryugo and Weinberger, 1976; Villa and Abeles, 1990; Villa et al., 1991, 1999; He, 2003a,b; Palmer et al., 2007). This corticothalamic projection mainly originates in layer VI pyramidal neurons, whose terminals are small and modulatory in nature. A numerically smaller corticothalamic projection arises from layer V neurons and produces large terminals that are able to determine the receptive field properties of the postsynaptic neuron (Rouiller and Welker, 1991, 2000; Ojima, 1994; Bajo et al., 1995; Sherman and Guillery, 1998; Bartlett et al., 2000). Here, we recorded the responses of single neurons throughout the MGB, before, during, and after reversibly deactivating the AC by cooling (Ryugo and Weinberger, 1976; Villa et al., 1991; Lomber, 1999; Lomber et al., 1999) while stimulating the animal with tones of two frequencies in an oddball paradigm to elicit SSA (Ulanovsky et al., 2003; Antunes et al., 2010). Our results demonstrate that the responses of MGB neurons were significantly modified, but the SSA levels and their temporal dynamics were
Antunes and Malmierca • Cortical Influence on SSA in the Auditory Thalamus
mostly unaffected during AC deactivation. These findings demonstrate that SSA in the MGB is not inherited from the AC, but rather, the AC modulates the responses of MGB neurons, presumably in a gain control manner. Preliminary reports have been presented previously (Antunes and Malmierca, 2011).
Materials and Methods Surgical procedures and electrophysiological recordings. Experiments were performed on 17 female adult pigmented rats (Rattus norvegicus; Long– Evans) with body weights between 150 and 250 g. All experiments were performed at the University of Salamanca with the approval of, and using methods conforming to the standards of the University of Salamanca Animal Care Committee. Details of surgical and recording procedures were as described in detail previously (Antunes et al., 2010). Surgical anesthesia was induced and maintained with urethane (1.5 g/kg, i.p.; 0.5 g/kg, i.p., supplementary if needed). A craniotomy was performed to expose the cerebral cortex overlying the MGB and the ipsilateral AC. A tungsten electrode (1–2 M⍀) (Merrill and Ainsworth, 1972) was used to record extracellular single-unit responses. Stimuli were delivered through a sealed acoustic system (Rees, 1990; Malmierca et al., 2005, 2008) using two electrostatic loudspeakers (EC1, Tucker-Davis Technologies) driven by two ED1 (Tucker-Davis Technologies) modules. All stimuli were generated and delivered to the contralateral ear using TDT System 2 (Tucker-Davis Technologies) hardware and custom software (Malmierca et al., 2009). The output of the system at each ear was calibrated in situ using a one-quarter inch condenser microphone (model 4136, Bru¨el & Kjær) and a DI-2200 spectrum analyzer (Diagnostic Instruments). The maximum output of the Tucker-Davis Technologies system was flat from 0.3 to 5 kHz (⬃100 ⫾ 7 dB SPL) and from 5 to 40 kHz (90 ⫾ 5 dB SPL). The highest frequency produced by this system was limited to 40 kHz. The second and third harmonic components in the signal were ⱖ40 dB below the level of the fundamental at the highest output level (Malmierca et al., 2008, 2009). Action potentials were recorded with a BIOAMP amplifier (Tucker-Davis Technologies), the 10⫻ output of which was further amplified and bandpass filtered (PC1, Tucker-Davis Technologies; between 0.5 and 3 kHz) before passing through a spike discriminator (SD1, Tucker-Davis Technologies). Spike times were logged on a computer by feeding the output of the spike discriminator into an event timer (ET1, Tucker-Davis Technologies) synchronized to a timing generator (TG6, Tucker-Davis Technologies). The monaural frequency response area (FRA) was obtained automatically using a randomized stimulus presentation paradigm (frequency steps and intensity levels) and plotted using MATLAB. Stimuli to measure FRAs in single units were 75 ms duration pure tones (5 ms rise/fall time). Frequency and intensity of the stimulus were varied randomly (0 –100 dB attenuation in 5 or 10 dB levels and in 25 frequency steps from 0.1 to 40 kHz, to cover approximately two to three octaves above and below the best frequency (Hernández et al., 2005; Malmierca et al., 2008). Stimulus presentation paradigm. Stimuli were presented in an oddball paradigm similar to that used previously (Ulanovsky et al., 2003; Malmierca et al., 2009; Antunes et al., 2010), consisting of two different puretone stimuli ( f1 and f2), at the 10 – 40 dB level above threshold. Both frequencies were within the excitatory FRA previously determined for the neuron and had a frequency ratio of 0.141 octaves [i.e., a normalized frequency difference (⌬f ) ⫽ 0.10, where ⌬f ⫽ ( f2 ⫺ f1)/( f2 * f1) 1/2] (Ulanovsky et al., 2003; Malmierca et al., 2009; Antunes et al., 2010). A train of 400 stimuli containing both frequencies in a pseudo-random order, at a 4 Hz repetition rate, was presented, varying the probability of each frequency, as follows: f1 was presented with 90% probability (standard stimulus); and f2 was presented with 10% probability (deviant stimulus) within the sequence. A second train was then presented, in which the probabilities of the two stimuli were reversed ( f2 as standard; f1 as deviant). The sound frequencies of each pair were chosen to elicit similar spike counts when presented individually, to ensure that all differences in response were due to the statistics of the stimulus ensemble. The parameters chosen were demonstrated to effectively elicit SSA in the MGB neurons (Antunes et al., 2010). SSA was quantified as described previously (Ulanovsky et al., 2003; Malmierca et al., 2009; Antunes et al.,
J. Neurosci., November 23, 2011 • 31(47):17306 –17316 • 17307
2010). The frequency-specific SSA index (SI), SI( fi) (i ⫽ 1 or 2), was calculated as SI( fi) ⫽ [d( fi) ⫺ s( fi)]/[d( fi) ⫹ s( fi)] where d( fi) and s( fi) were responses (in spike counts/stimulus) to frequency fi when it was deviant or standard, respectively. The amount of SSA for both frequencies [common SSA index (CSI)] was calculated as CSI ⫽ [d( f1) ⫹ d( f2) ⫺ s( f1) ⫺ s( f2)]/[d( f1) ⫹ d( f2) ⫹ s( f1) ⫹ s( f2)]. These indices reflect the extent to which the response to a tone, when standard, was smaller than the response to the same tone, when deviant. The indices range between ⫺1 and ⫹1, being positive if the response to a tone, when deviant, was greater than the response to the same tone, when standard. Reversible cooling AC deactivation. We recorded well isolated single units from the MGB before, during, and after deactivating the ipsilateral AC using the cooling technique (Fig. 1). This technique enables the reversible deactivation of discrete regions of the brain (Lomber, 1999; Lomber and Malhotra, 2008; Carrasco and Lomber, 2009a,b; Coomber et al., 2011). It has been extensively used to study functional interactions between cortical areas in cat (Ghosh et al., 1994; Lomber, 1999; Lomber et al., 1999; Lomber and Malhotra, 2008; Carrasco and Lomber, 2009a,b) and the corticofugal modulation of subcortical nuclei in various sensory systems. In smaller animals, such as the guinea pig, cooling has been demonstrated to reliably deactivate the AC without causing a reduction in temperature sufficient to directly reduce neural activity in the MGB and other subcortical nuclei (Coomber et al., 2011). It is assumed that ipsilateral AC cooling deactivated all the descending inputs to the MGB, since corticofugal fibers terminating in this nucleus are entirely ipsilateral (Bajo et al., 1995, 2010; Ojima and Rouiller, 2011). To cool the AC, a 4-mm-diameter cryoloop was fabricated by shaping a loop of 23 gauge stainless steel hypodermic tubing to conform to the AC surface (Lomber et al., 1999). The loop was stereotaxically positioned over the AC, encompassing both the primary and secondary cortical field (Doron et al., 2002). The whole AC was deactivated to avoid incomplete effects due to partial deactivation. Cooling was achieved by pumping methanol cooled by dry ice through the cryoloop using a peristaltic pump. The temperature was monitored continuously by a microthermocouple (HH506RA multiterm, Omega) attached to the union of the loop and accurately governed by controlling the flow of methanol to get a loop temperature of 3 ⫾ 1°C (Lomber et al., 1999). A stable cortical temperature was reached within ⬃5 min of cooling initiation (Fig. 1a). Recordings were started 5 min later to ensure deactivation of the deeper AC layers where the corticofugal projection to the MGB originates (mostly from layer VI with a minor proportion from layer V) (Bajo et al., 1995; Bartlett et al., 2000; Kimura et al., 2007; Ojima and Rouiller, 2011). Cooling the cryoloop to 3 ⫾ 1°C is sufficient to deactivate all six layers of cortex beneath the cryoloop (Lomber et al., 1999, 2007) as it places the critical 20°C deactivation isotherm necessary to block synaptic transmission at the gray matter–white matter interface or deeper (Lomber et al., 1999, 2007). Such deactivation was confirmed in selected cases where AC responses were recorded up to 1000 m in depth, corresponding to layers V/VI in rat (Games and Winer, 1988) by the cessation of activity, as recorded by microelectrodes. In one experiment, changes in temperature were measured in the MGB during AC cooling to confirm that the temperature in the MGB was not reduced to 24 –20°C, the range of temperatures sufficient to diminish neuronal function (Lomber et al., 1999) (Fig. 1a). These measurements were made with an Omega 5SC-TT-KI thermo-probe, composed of two wires (76 m diameter and plastic insulated) welded together to form a bead of 225 m diameter, as described by Coomber et al. (2011). The responses of the MGB neurons (FRAs and SSA) were recorded during ⬃15 min of AC deactivation, after which the cryoloop pump was turned off (Fig. 1). The normal AC surface temperature was regained in a few minutes, though cortical and MGB responses took longer to return to normal (Nakamoto et al., 2008; Coomber et al., 2011). After 30 min, the responses of the neurons returned to normal, since cooling disrupts neither the structural nor functional integrity of the cooled area (Lomber et al., 1999; Yang et al., 2006) (Fig. 1). The few MBG neurons (3 of 51) that did not recover to within 20% of the precooling maximum spike count were removed from all analyses. In some neurons, a moderate higher firing rate was observed in the recovery, a
Antunes and Malmierca • Cortical Influence on SSA in the Auditory Thalamus
17308 • J. Neurosci., November 23, 2011 • 31(47):17306 –17316
rebound presumably due to a higher synaptic release probability during rewarming (Volgushev et al., 2004). Data analysis. Statistical tests were performed using the nonparametric (two-sided) Wilcoxon signed rank test to test differences between distribution medians of varying conditions. Multiple comparisons were performed using two-way repeated-measures ANOVAs (one-factor repetition; repeated factor was “condition”). Correlation coefficients were performed using Pearson’s correlation. Statistical tests were considered significant when p ⬍ 0.05. The SD for the CSI of each individual neuron was calculated using bootstrapping (1000 repetitions). The limits of the 99% confidence intervals were calculated by using the 0.5 and 99.5 percentiles of the CSI bootstrap distribution obtained for each neuron; the 1% confidence level was used to determine statistically significant differences in the CSI value between conditions. The analysis and figures were done using Sigmaplot 11 (Systat Software) and Matlab (MathWorks). Histological verification of recording sites. Each track was marked with electrolytic lesions for subsequent histological localization of the recording sites. At the end of each experiment, the animal was perfused transcardially with 0.5% NaNO3 in PBS followed by fixative (1% paraformaldehyde and 1% glutaraldehyde in rat Ringer’s solution). The brain tissue was sectioned in the transverse plane into 40-m-thick sections that were Nissl stained with 0.1% cresyl violet. Recording sites were marked on standard sections from a rat brain atlas (Paxinos and Watson, 2005), and units were assigned to one of the three main divisions (ventral, dorsal, and medial) of the MGB (Winer et al., 1999).
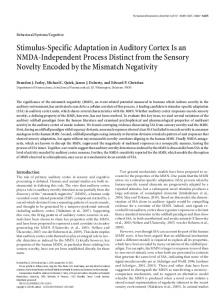
Figure 1. Stages of the AC deactivation cycle. a, Temperature changes recorded at the cooling loop and in MGB during a complete AC deactivation cycle. Temperatures decreased by ⬃5°C in the MGB while the surface of the auditory cortex was cooled. Temperature in the MGB never fell below 26°C. b, c, Peristimulus time histograms show the activity of the units that Figure 2, a–l (b) and m–x (c), shows in the five stages of the cycle. Both units had a stronger response to the deviant than to the standard stimulus (i.e., showed SSA) in all conditions. Note the strong decrease in activity during the cool condition compared with the activity in the warm and recovery conditions, and the gradual changes during the transitional stages between conditions.
Results Effect of AC deactivation on SSA in the MGB To determine whether the AC conveys SSA to the MGB neurons, we recorded the responses of 51 well isolated single units in the MGB, before, during, and after reversibly deactivating the AC by cooling (Fig. 1). To rule out direct cooling effects in the MGB, we performed an experiment in which we measured the temperature in the MGB while the AC was cooled (Fig. 1). There was a small drop in the MGB temperature (⬃5°C), but it never fell to 26°C (Fig. 1), a temperature that is above the 24 –20°C necessary to reduce neural activity (Lomber et al., 1999; Coomber et al., 2011). To elicit SSA in the MGB neurons, we used trains of two different puretone stimuli in an oddball paradigm ( f1 and f2; 400 stimulus presentations in two blocks) (Figs. 2, 3), presenting each tone with different probability of occurrence in the sequence (90%, standard tone; 10%, deviant tone). We used the stimulation conditions that elicited the most SSA in the MGB neurons (a frequency ratio of 0.141 octaves presented at a rate of 4Hz) (Antunes et al., 2010). To quantify SSA, we calculated the SI( fi) and CSI indices. These indices reflect the extent to which the response to a tone, when standard, was smaller than the response to the same tone, when deviant. The indices range between ⫺1 and ⫹1, being positive if the response to a tone, when deviant, was greater than the response to the same tone, when standard [compare Figs. 1b,c, 2 (units that had a stronger response to the deviant, i.e., they
showed SSA), Fig. 3m–x (unit that had a similar response to both stimuli; i.e., did not show SSA)]. Here, we found a similar distribution of values across the population to that found in our previous work, for the same set of conditions (Antunes et al., 2010). All but three neurons showed full recovery following AC deactivation (48 of 51 neurons) (Figs. 1– 4); these 3 neurons were excluded from subsequent analysis. Of the 48 neurons recorded, 30 demonstrated SSA (CSI ⬎0.18) (Antunes et al., 2010). Our main finding is that these neurons had significant SSA levels during cortical deactivation (Figs. 1, 2, 3a–l, 4). However, other response properties of the MGB neurons that we tested simultaneously did change significantly under AC deactivation. These included spectral response patterns (Figs. 2, 3, FRAs), spontaneous activity (the units in Fig. 2 reduced their spontaneous activity; the unit in Fig. 3a–l augmented their spontaneous activity), firing rate (the units in Figs. 1, 2, and 3m–x were suppressed; the unit in Fig. 3a–l were facilitated) (Fig. 5), and latency (Fig. 6). We will describe in detail the changes in firing rate and latency, after characterizing the effects of AC deactivation on SSA. Neurons that showed SSA had a stronger response to the deviant than to the standard stimulus under all conditions (warm, cool, and recovery) (Figs. 1, 2, 3a–l ) (similar CSI value in all conditions for all neurons). Neurons that did not show SSA maintained a similar response to both stimuli (Fig. 3m–x). There were no significant differences between the median CSI for the
Antunes and Malmierca • Cortical Influence on SSA in the Auditory Thalamus
J. Neurosci., November 23, 2011 • 31(47):17306 –17316 • 17309
whole population when the AC was active or when it was deactivated (median CSI for both conditions: 0.31; n ⫽ 37; Z ⫽ ⫺1.290; p ⫽ 0.2, Wilcoxon signed rank test, between warm and cool conditions) (Fig. 4a). Eleven neurons were not included in the previous analysis: 7 of these neurons were not included because they ceased firing during cooling, and so it was not possible to determine their CSI value for this condition; during cooling, 4 neurons were completely suppressed to one of the frequencies of the pair chosen in the warm condition. There were no significant differences between the median CSI during warm and recovery conditions (median CSI: 0.27 and 0.25, respectively; n ⫽ 48; Z ⫽ ⫺1.313; p ⫽ 0.191, Wilcoxon signed rank test between warm and recovery conditions; this analysis included the 7 neurons that ceased firing and the 4 neurons that were suppressed to one of the frequencies during cooling). The overall distribution of CSI values in the population of neurons that were active during AC deactivation to both frequencies (n ⫽ 37) (Fig. 4a) was similar for the three conditions (Fig. 4a). To determine whether there were significant differences between the CSI values of individual neurons in the different conditions, we used the bootstrap method over 1000 randomizations to estimate the SD and the 99% confidence intervals of the CSI in the warm condition, for each neuron (Fig. 4b). No significant differences were found between the CSI values in the different conditions for the majority of neurons (46 of 48 neurons). Only 2 of the 48 neurons had a significantly lower CSI value during the cool condition [Fig. 4b, units 40 and 48 in the cool condition (asterisks); Fig. 3a–l, unit 40]. Nevertheless, these neurons retained SSA during AC deactivation (CSI ⫽ 0.39 and 0.68, respectively). Effect of AC deactivation on the temporal dynamics of SSA To look for a possible alteration in the dynamics of SSA with cortical deactivation, we calculated the average population firing rate in response to the standard stimulus across trials, before, during, and after cortical deactivation (Fig. 4c,d). Since these dynamics will be influenced by all neurons in the population, we analyzed separately the responses of neurons with and without SSA (CS ⱕ 0.18 and ⬎0.18, respectively) (Antunes et al., 2010) to the standard stimulus (Fig. 4c,d). As the neurons did not adapt to the deviant stimulus, they maintained their response to this stimulus through the trials in each condition (Fig. 4e). The responses to the standard of neurons with SSA declined strongly after the first few trials, under all conditions (Fig. 4c). Although these neurons reduced their firing rate during AC deactivation (cool, blue trace), they recovered to the rate exhibited before deactivation (warm, red trace) after AC rewarming (recovery, green trace), and maintained similar dynamics of adaptation under all conditions (Fig. 4c). Indeed, the model that provided the best fit to these responses in the warm condition when the AC was active, explained a high proportion of the adaptation, and yielded similar results in the three conditions (poly4
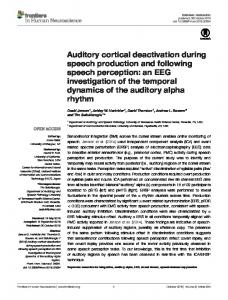
Figure 2. Examples of single-unit responses in the MGB before, during, and after AC deactivation. a– c, The FRA of a neuron localized to the MGM in the warm, cool, and recovery conditions. d–i, Responses of the neuron to the oddball paradigm as dot rasters, which plot
individual spikes (red and blue dots, to the deviant and standard, respectively) in each of the three conditions, for the first block ( f1 /f2 as standard/deviant) (d–f) and second block ( f2/f1 as standard/deviant) (g–i) of stimulus presentations (stacked along the y-axis: trial number, 400 trials per block). The time between trials (250 ms; x-axis) corresponds to the stimulus repetition rate (4 Hz; with 75 ms stimulus duration; black horizontal lines under the plots). j–l, Peristimulus time histograms (PSTHs) show the number of spikes/stimulus (bin duration: 3 ms) averaged over the two blocks [( f1 ⫹ f2)/2; blue line is standard, red line is deviant]. The CSI calculated for each condition is noted as an insert on the PSTHs. m–x, Responses of another neuron localized to the MGD, presented as in a–l.
Antunes and Malmierca • Cortical Influence on SSA in the Auditory Thalamus
17310 • J. Neurosci., November 23, 2011 • 31(47):17306 –17316
nomial inverse model: f ⫽ y0 ⫹ (a/x) ⫹ (b/x2); r 2 ⫽ 0.61, 0.53, and 0.55, respectively, for warm, cool, and recovery; p ⬍ 0.0001 for all conditions). Hence, the neurons showing SSA maintained a similar adaptation dynamics when the AC was deactivated to that when it was active. This demonstrates that the AC exerts no significant effect on the SSA exhibited by the majority of MGB neurons and on its dynamics over time, and that SSA in this thalamic nucleus is not inherited from the AC. The responses of neurons without SSA showed a minor decrement in firing rate after the first trials in the warm condition that was lost during AC deactivation (Fig. 4d) (the variance explained by the same polynomial inverse model described above was close to zero in the warm condition: r 2 ⫽ 0.09, p ⬍ 0.001; the model was not significant in cool and recovery conditions: p ⫽ 0.378 and 0.516, respectively). The overall firing rate to the standard of these neurons was strongly reduced with cortical deactivation in relation to the warm condition. This effect was less pronounced in the neurons that show SSA (Fig. 4, compare c, d). This suggests that the AC exerts a differential modulatory effect on the discharge rate of neurons exhibiting different levels of SSA. Effect of AC deactivation on the firing rate of MGB neurons In the whole population, the average firing rate evoked by both stimuli was significantly lower while the AC was cooled and deactivated (only 9 of 48 neurons augmented their firing rate) (Fig. 3a–l ) than while it was active (n ⫽ 48; median firing rate to the deviant: 1.34 and 0.54 spikes/stimulus, warm and cool conditions, respectively; median firing rate to the standard: 0.85 and 0.16 spikes/stimulus, respectively, for warm and cool conditions; Wilcoxon signed rank test, between the warm and cool conditions: Z ⫽ ⫺4.913 and ⫺4.667, respectively, for deviant and standard; p ⬍ 0.001, both stimuli; Fig. 5a,c) (Figs. 1, 2, 3m–x). Neurons recovered their initial firing rate after AC rewarming (n ⫽ 48; median firing rate to the deviant: 1.34 spikes/stimulus, both conditions; median firing rate to the standard: 0.85 and 0.67 spikes/stimulus, respectively, warm and recovery conditions; Wilcoxon signed rank test, between the warm and recovery conditions: Z ⫽ ⫺0.369 and ⫺0.944, p ⫽ 0.716 and 0.348, deviant and standard, respectively) (Figs. 1–3, 5b,c). To determine the effect of AC deactivation on the discharge rate of neurons across SSA levels, we plotted the CSI versus the difference in firing rate between the warm and cool conditions for each neuron (Fig. 5d,e, standard and deviant, respectively): positive values for this difference indicate a reduction in firing rate with AC deactivation; and negative values indicate an increment (Fig. 5d,e, values above and below the horizontal line at the origin, respectively). This difference in firing rate was inversely correlated with CSI for both stimuli (Pearson: r ⫽ ⫺0.645 and ⫺0.496, respectively, for standard and deviant; p ⬍ 0.001, n ⫽ 48, both stimuli; Fig. 5d,e). Although the correlation coefficient is higher for the standard than for the deviant stimulus, this difference is not significant since the slopes of the standard and deviant regression lines are not significantly different from each other 4
Figure 3. Examples of single-unit responses in the MGB before, during, and after AC deactivation. a– c, The FRAs in the three conditions of a neuron localized to the MGM that was facilitated during AC deactivation. d–i, Responses of the neuron to the oddball paradigm as dot rasters, which plot individual spikes (red and blue dots, to the deviant and standard, respectively) in each of the three conditions, for the first block ( f1/f2 as standard/deviant) (d–f) and
second block ( f2 /f1 as standard/deviant) (g–i) of stimulus presentations (stacked along the y-axis: trial number, 400 trials per block). The time between trials (250 ms; x-axis) corresponds to the stimulus repetition rate (4 Hz; with 75 ms stimulus duration, black horizontal lines under the plots). j–l, Peristimulus time histograms (PSTHs) show the number of spikes/stimulus (bin duration: 3 ms) averaged over the two blocks [( f1 ⫹ f2)/2; blue line is standard, red line is deviant]. The CSI calculated for each condition is noted as an insert on the PSTHs. m–x, Responses of another neuron localized to the MGV with a V-shaped-type FRA that did not show SSA (similar response to both stimuli: CSI, ⬃0).
Antunes and Malmierca • Cortical Influence on SSA in the Auditory Thalamus
J. Neurosci., November 23, 2011 • 31(47):17306 –17316 • 17311
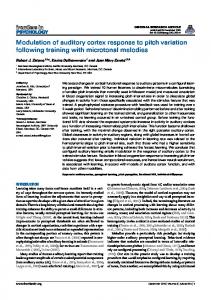
Figure 4. SSA quantification and its time course of adaptation in the MGB neurons before, during, and after AC deactivation. a, Box plots showing the distribution of CSI values in the warm (red), cool (blue), and recovery conditions (green), for the population of active neurons that responded to both frequencies during cooling (n ⫽ 37). The continuous and dashed horizontal lines across the plots represent the median and mean values, respectively. b, CSI values for each individual neuron in the warm (red dots), cool (blue dots), and recovery (green dots) conditions. Of the 48 neurons, only 37 had a CSI value for the cool condition. Error bars indicate SD, calculated using bootstrapping. Asterisks indicate neurons that had a significantly lower CSI value during the cool condition outside 2 SDs of the bootstrapped sample. c, d, Average population firing rate (spikes/stimulus) in response to the standard stimulus of the neurons with adaptation (CSI ⬎0.18) (c) and without adaptation (CSI ⱕ0.18) (d) versus trial number, in the warm (red line), cool (blue line), and recovery (green line) conditions. e, Responses to the deviant stimulus for all neurons, presented as in c and d.
(ANCOVA: main effect of stimuli, F(1,92) ⫽ 1.89, p ⫽ 0.172; main effect of CSI, F(1,92) ⫽ 43.27, p ⫽ 0; interaction, F(1,92) ⫽ 0.23, p ⫽ 0.634; n ⫽ 48; Fig. 5d,e). Neurons without SSA were suppressed during AC deactivation to both stimuli [Fig. 5d,e, CSI values around zero (vertical dashed line)]; neurons with higher SSA were less suppressed (Fig. 5d,e, standard and deviant, respectively). Furthermore, some highly adapting neurons were facilitated during AC deactivation to both stimuli (Figs. 2a–l, 5d,e). This suggests that the AC has a differential effect upon the discharge pattern of neurons exhibiting different levels of SSA; neurons without SSA are mainly facilitated, but some neurons with high SSA are suppressed by the AC. We localized 45 (of 48) neurons to one of the three main MGB subdivisions: 24 neurons were localized to the dorsal MGB (MGD), 12 to the ventral MGB (MGV), and 9 to the medial MGB (MGM) (Fig. 5d,e, green, blue, and red dots, respectively; Figs. 2a–l, 3a–l, units from the MGM; Fig. 2m–x, units from the MGD; Fig. 3m–x, units from the MGV). SSA was stronger in the medial subdivision; intermediate in the dorsal, and weakest in the ventral subdivisions (mean CSI ⫽ 0.65, 0.36, and 0.1, respectively) (but see Antunes et al., 2010). Our sample is biased toward the nonlemniscal subdivisions (total of 33 units from the MGD and MGM) where SSA is stronger and neurons show predominantly non-Vshaped type FRAs. Although there was a significant effect of AC deactivation on the firing rate of this population, there was no effect of subdivision or an interaction between condition and subdivision (n ⫽ 45; Two-way repeated-measures ANOVA, for the responses to the deviants: F(1,42) ⫽ 21.95, p ⬍ 0.001, main effect of condition; F(2,42) ⫽ 2.96, p ⫽ 0.06, main effect of subdivision; and
F(2,42) ⫽ 0.12, p ⫽ 0.89, interaction; two-way repeated-measures ANOVA, for the responses to the standards: main effect of condition, F(1.42) ⫽ 22.88, p ⬍ 0.001; main effect of subdivision, F(2,42) ⫽ 2.89, p ⫽ 0.07; interaction, F(2,42) ⫽ 1.06, p ⫽ 0.36). These results are consistent with the fact that the MGD shows a range of firing rate changes that extends through the CSI range. Moreover, the MGM also has some neurons that were facilitated whereas others were suppressed. This lack of a correlation between subdivisions and the firing rate changes suggests that the degree of SSA exhibited by the MGB neurons determines the modulatory effect exerted by the AC on their discharge rate rather than their localization within subdivisions. Effect of AC deactivation on the latency of MGB neurons The population of active neurons during AC deactivation showed a significantly longer median latency (mean first-spike latency) than before deactivation (n ⫽ 41; median latencies to the deviant: 17.1 and 19.5 ms, respectively, warm and cool condition; median latency to the standard: 17.5 ms and 21.3 ms, respectively, warm and cool condition; Wilcoxon signed rank test, between warm and cool conditions: Z ⫽ 3.764 and 4.244, deviant and standard, respectively; p ⬍ 0.001, both stimuli; this analysis included the four neurons that were suppressed to one of the frequencies during cooling since they were active and responded to the other frequency; Fig. 6a,c). This lengthening of latency caused by AC deactivation indicates that the AC modulates the latency of the MGB neurons, shortening their latencies to both stimuli. The neurons recovered their latencies after AC deactivation: no differences were found between their initial latencies and those after
17312 • J. Neurosci., November 23, 2011 • 31(47):17306 –17316
Antunes and Malmierca • Cortical Influence on SSA in the Auditory Thalamus
AC rewarming and reactivation (n ⫽ 48; median latencies to the deviant: 17.4 and 18.5 ms, respectively, warm and recovery condition; median latencies to the standard: 19.3 and 19.7 ms, respectively, warm and recovery condition; Wilcoxon signed rank test, between warm and recovery conditions: Z ⫽ 0.697 and 0; p ⫽ 0.489 and 0.996, deviant and standard, respectively; this analysis included the neurons that were inactive during cooling; Fig. 6b,d). This analysis also showed that the latency of the responses to the deviant was significantly shorter than that to the standard, before AC deactivation (median latency, 17.1 and 17.5 ms, respectively; Wilcoxon signed rank test: n ⫽ 41, Z ⫽ 4.879, p ⬍ 0.001) (Fig. 6c) (but see Antunes et al., 2010); and that this latency difference was maintained during AC deactivation (median latency: 19.5 and 21.3 ms, respectively, deviant and standard; Wilcoxon signed rank test: n ⫽ 41, Z ⫽ 2.041, p ⫽ 0.04; Fig. 6c). This indicates that the AC is not generating the latency gap in the responses to the standard versus the deviant exhibited by the MGB neurons. To further evaluate whether the AC deactivation had a differential effect on the latency across SSA levels, we plotted the CSI of the neurons versus the difference in the mean first-spike latency between the warm and cool conditions (Fig. 6e,f, standard and deviant, respectively; n ⫽ 41 active neurons during cooling): negative values indicate a lengthening in the latency during AC deactivation; and positive values indicate a shortening (Fig. 6e,f, below and above the horizontal line at the origin, respectively). This difference in latency was significantly and positively correlated with CSI for the responses to the standard stimulus (Pearson: r ⫽ 0.319, Figure 5. Effect of AC deactivation on the firing rate of MGB neurons. a, b, Scatterplots of the responses of all neurons (spikes/ p ⫽ 0.042; Fig. 6e). The latency of the re- stimulus, n ⫽ 48) to the deviant (red dots) and standard stimulus (blue dots) in the warm versus cool condition ( p ⬍ 0.001, both sponses to the deviant stimulus showed stimuli, Wilcoxon signed rank test) (a) and warm versus recovery condition (n.s., both stimuli, Wilcoxon signed rank test) (b). c, Box the same trend, but the correlation was plots showing the distribution of firing rate values in the whole population (n ⫽ 48) in the warm, cool, and recovery conditions, in not significant (Pearson: r ⫽ 0.262, p ⫽ response to the standard (blue plots) and the deviant stimulus (red plots). d, e, Scatterplots of the CSI (warm condition) versus the 0.099; Fig. 6f ). The slopes of the standard difference in firing rate between the warm and cool conditions (spikes/stimulus difference) in response to the standard stimulus and deviant regression lines are not signif- (d) and in response to the deviant stimulus (e), for each neuron. Blue, green, and red dots represent the neurons that were localized icantly different from each other indicat- to the ventral (n ⫽ 12), dorsal (n ⫽ 24), and medial (n ⫽ 9) subdivisions of the MGB, respectively (n ⫽ 45). Positive values ing that there is no significant difference indicate a reduction in firing rate with AC deactivation, and negative values an increment (above and below the horizontal line at the origin, respectively). between the correlation coefficient obtained for both stimuli (ANCOVA: main deactivation, showed some level of adaptation (CSI ⬎0.18; Fig. effect of stimuli, F(1,78) ⫽ 0.34, p ⫽ 0.561; main effect of CSI, 6e,f, dots above the horizontal line); but still, the median latency F(1,78) ⫽ 7.14, p ⫽ 0.009; interaction, F(1,78) ⫽ 0.05, p ⫽ 0.829; of the population of neurons with SSA was significantly longer n ⫽ 41; Fig. 6e,f ). This analysis showed that all neurons not during AC deactivation to both stimuli (Wilcoxon signed rank showing SSA (CSI ⱕ0.18) had a longer latency during AC deactest, between control and cooling, CSI ⬎0.18: n ⫽ 26, Z ⫽ 2.451 tivation to both stimuli (Fig. 6e,f; Wilcoxon signed rank test, and 2.578, p ⫽ 0.015 and 0.01, deviant and standard, respecbetween warm and cool conditions: n ⫽ 15, Z ⫽ 2.95 and 3.408, tively). The higher warm– cool differences were exhibited by neup ⫽ 0.002 and ⬍0.001, deviant and standard, respectively). By rons with zero or intermediate CSI values (⬍0.45) from the MGV contrast, the few neurons that had a shorter latency during AC
Antunes and Malmierca • Cortical Influence on SSA in the Auditory Thalamus
J. Neurosci., November 23, 2011 • 31(47):17306 –17316 • 17313
ANOVA, for the responses to the standard: main effect of condition, F(1,36) ⫽ 6.788, p ⫽ 0.013; main effect of subdivision, F(2,36) ⫽ 1.732, p ⫽ 0.191; interaction, F(2,36) ⫽ 0.64, p ⫽ 0.533).
Discussion In this study, we reversibly deactivated the AC using the cooling technique to silence its neurons and descending (ipsilateral) projections to the auditory thalamus, to examine whether the AC exerts an effect on the SSA exhibited by MGB neurons. Overall, our results demonstrate that AC deactivation produced nonsignificant changes in the mean SSA levels over the population and small changes in the individual neurons in the MGB. Furthermore, the temporal dynamics of SSA in the MGB were not affected by AC deactivation. These findings demonstrate that SSA exhibited by MGB neurons is not a property inherited from the AC but instead can be inherited from lower levels such as the inferior colliculus (IC) and/or generated de novo in the MGB. We suggest that SSA generated at lower levels can be transmitted in a bottom-up manner and likely can be modulated intrinsically at each level of the auditory pathway. Such bottom-up transmission of SSA would enable each level of the auditory system to take the responses of the previous level to eliminate as much statistical redundancy as possible (Schwartz and Simoncelli, 2001). In light of this, synaptic depression can be a potential mechanism underlying SSA (Chung et al., 2002; Rothman et al., 2009), since it is input specific and causes the responses of a neuron to depend on the previous history of afferent firing, enFigure 6. Effect of AC deactivation on the latency of MGB neurons. a, b, Scatterplots showing the mean first spike latencies hancing its sensitivity to nonrepeated (latency, in milliseconds) of the active neurons during cooling (n ⫽ 41) to the deviant (red dots) and standard stimuli (blue dots) stimuli (Abbott et al., 1997; Rothman et in the warm versus cool condition ( p ⬍ 0.001, both stimuli, Wilcoxon signed rank test) (a) and the latencies of all neurons (n ⫽ al., 2009). Moreover, it is compatible with 48) in the warm versus recovery conditions (n.s., both stimuli, Wilcoxon signed rank test) (b). c, d, Box plots showing the distri- the participation of additional mechabution of latency values in response to the standard (blue plots) and the deviant stimuli (red plots) in the warm and cool conditions nisms linked to neuronal intrinsic properfor the population of active neurons during cooling (n ⫽ 41) (c) and in the warm and recovery conditions for all neurons (n ⫽ 48) ties (Abolafia et al., 2011), which can (d). e, f, Scatterplots of the CSI (warm condition) versus the difference in latency between the warm and cool conditions (latency transform SSA at each level of the auditory difference) in response to the standard stimulus (e) and in response to the deviant stimulus (f), for each neuron. Blue, green, and pathway. red dots represent the neurons that were localized to the ventral (n ⫽ 12), dorsal, (n ⫽ 24) and medial (n ⫽ 9) subdivisions of the The insensitivity of SSA to AC deactiMGB, respectively (n ⫽ 45). Positive values indicate a decrease in latency with AC deactivation, and negative values an increase vation is all the more remarkable given (above and bellow the horizontal line at the origin, respectively). the significant alteration of many other properties of the MGB neurons during AC deactivation, such as their FRAs, subdivision (Fig. 6e,f, blue dots). This indicates that the MGV is the spontaneous activity, discharge rates, and latencies. These subdivision in which latency depends strongest on modulation from changes occurred in all neurons, although to different degrees in the AC. the different neurons, demonstrating that our results are genuine Although there was a significant effect of AC deactivation on the and not the consequence of technical artifacts. Furthermore, latencies in the population of the neurons that were localized, there these findings confirm previous studies of corticofugal projecwas no effect of subdivision or an interaction between condition and tions that used a cooling technique (Ryugo and Weinberger, subdivision (two-way repeated-measures ANOVA, for the re1976; Villa and Abeles, 1990; Villa et al., 1991, 1999; Palmer et sponses to the deviant: main effect of condition, F(1,36) ⫽ 4.520, p ⫽ al., 2007) or electrical stimulation (He, 2003a,b; Ojima and 0.04; main effect of subdivision, F(2,36) ⫽ 2.103, p ⫽ 0.137; interaction, F(2,36) ⫽ 0.821, p ⫽ 0.448; two-way repeated-measures Rouiller, 2011), and corroborate the strong corticofugal mod-
Antunes and Malmierca • Cortical Influence on SSA in the Auditory Thalamus
17314 • J. Neurosci., November 23, 2011 • 31(47):17306 –17316
ulation that the MGB, like other subcortical nuclei, receive (Villa and Abeles, 1990; Villa et al., 1991, 1999; Nakamoto et al., 2008, 2010; Yu et al., 2009; Bajo et al., 2010; Malmierca and Ryugo, 2011), as also demonstrated in the visual (Sillito et al., 1994; Rushmore et al., 2005) and somatosensory systems (Ghosh et al., 1994). Here, we demonstrate that such corticofugal modulation does not account significantly for the SSA exhibited in MGB neurons but, rather, modulates the discharge rate of these neurons affecting similarly the responses to the standard and the deviant stimuli. As a result, the degree of SSA quantified by a ratio of driven rates was largely unaffected by cooling. This strongly suggests that the corticofugal pathway exerts a gain control in the MGB neurons. Indeed, recent studies suggest that the corticofugal system can participate in a gain control process that leads to improved coding of salient stimuli (Robinson and McAlpine, 2009) and possibly underlies auditory attention (He, 2003b) and learninginduced plasticity (Bajo et al., 2010). Our results are consistent with the role of the corticofugal pathway in scaling the sensitivity of the MGB neurons to its driving inputs by controlling their gain. Although SSA in the MGB is only weakly affected by cortical deactivation, we did find a highly significant relationship between SSA and changes elicited by cooling. Our findings demonstrate that the corticofugal modulation of the discharge rate of MGB neurons vary significantly with the SSA level that they exhibited, such that the facilitation exerted by the AC on the MGB neurons reduces as the SSA increases, with some highly adapting neurons being suppressed (Fig. 5). This relation is not dependent on the anatomical subdivision to which the MGB neurons belong, but on the SSA they exhibit, linking this property to the type of corticofugal modulation that they receive. This is an important finding, since the general view of corticothalamic interactions is one of very large variability with many different effects. Consistent with this view is our finding that the subdivision of MGB has no effect on the responses under cortical deactivation. Therefore, our finding that the amount of cortical modulation depends on the level of SSA constitutes strong evidence for a clear rule that relates cortical modulation to neuronal properties: high SSA is related to strong cortical gain. Since some high SSA neurons from the nonlemniscal MGB receive suppressive influence from the corticofugal pathway, inhibition is a possible mechanism underlying such modulation, via the thalamic reticular nucleus (TRN) (He, 2003b; Yu et al., 2009), a nucleus that also exhibits SSA (Yu et al., 2009). Our results show that the possible inhibition driven by the corticofugal pathway does not underlie SSA in the MGB neurons. Hence, if inhibition plays a role in SSA, as has been suggested in previous studies (Eytan et al., 2003; Yu et al., 2009; Richardson et al., 2011), other pathways should be involved, such as those coming from the IC (Peruzzi et al., 1997) as well as the TRN–MGB connections themselves (Yu et al., 2009). Furthermore, we demonstrate that the AC modulates the latency of the MGB neurons, mainly shortening their latencies, as previously shown in some subcortical neurons using electrical stimulation of AC (Luo et al., 2008). This effect becomes less pronounced as the neuronal adaptation increases. The slight latency shift that the strong adapting neurons from the thalamus and the midbrain with the shortest latencies (⬍25 ms) exhibit comparatively to the weaker or nonadapting ones (Malmierca et al., 2009; Antunes et al., 2010) may be due to a weaker cortical influence that mainly shortens the latency of the MGB neurons.
The MGB neurons maintained a shorter latency to the deviant than to the standard stimulus (but see Antunes et al., 2010) during cortical deactivation, demonstrating that this latency phenomenon is not of cortical origin. However, all of these latency phenomena can be due to changes in the excitability of the MGB neurons, either controlled by the cortex or elicited by different stimulus probabilities, since increased excitability will usually be expressed as a reduction in latency. This also applies among neurons with different SSA levels, since neurons that exhibit high levels of SSA tend to have lower firing rates (Antunes et al., 2010). The fact that the nonadapting neurons are mainly facilitated and their latencies shortened by corticofugal modulation can be achieved by direct excitation from the AC and/or by a release of inhibitory inputs coming from neurons in the thalamus and its input stations (IC–MGB projection) (Peruzzi et al., 1997; Bartlett et al., 2000) via TRN inhibition on these inhibitory inputs. Together, our findings demonstrate that the AC and corticofugal pathways modulate the general responses of the MGB neurons without significantly changing SSA in this thalamic nucleus, probably by providing a gating or gain control mechanism (Villa and Abeles, 1990; Villa et al., 1991; He, 2003b; Robinson and McAlpine, 2009; Yu et al., 2009). However, a subset of neurons had their acoustic responsiveness eliminated with cortical deactivation (four in the MGD; two in the MGV; the other was not histologically localized). These data are in agreement with the drivers and modulators hypothesis proposed originally by Guillery (1995) and Sherman and Guillery (1998). The main corticofugal projections to the MGB arise from layer VI neurons, whose terminals are mostly small and modulatory (Rouiller and Welker, 1991; Ojima, 1994; Bajo et al., 1995; Bartlett et al., 2000; Ojima and Rouiller, 2011). In addition, a few pyramidal neurons from layer V with large terminal boutons of the driver type project to the MGD and MGV subdivisions (Rouiller and Welker, 1991; Ojima, 1994; Bajo et al., 1995; Bartlett et al., 2000; Ojima and Rouiller, 2011). The seven neurons that ceased firing during AC cooling had nonexistent or very low levels of SSA (CSI ⬍0.28), agreeing with our main result that SSA in the MGB is not inherited from the AC. In summary, we demonstrate that the corticofugal pathway does not drive or transform SSA in the MGB but modulates the responses of the MGB neurons, presumably by changing their gain. The amount of gain exerted by the AC in the MGB varies from neuron to neuron depending on the ability of these neurons to detect rare sounds in the environment. We suggest that SSA could be generated in a bottom-up manner throughout the auditory pathway, as a preattentive gating involved in reducing sensory inputs to behaviorally relevant aspects.
References Abbott LF, Varela JA, Sen K, Nelson SB (1997) Synaptic depression and cortical gain control. Science 275:220 –224. Abolafia JM, Vergara R, Arnold MM, Reig R, Sanchez-Vives MV (2011) Cortical auditory adaptation in the awake rat and the role of potassium currents. Cereb Cortex 21:977–990. Antunes FM, Malmierca MS (2011) Top-down modulation of stimulusspecific adaptation in the auditory thalamus. In: Abstracts of the 34th MidWinter Meeting of the Association for Research in Otolaryngology, pp 93–94. Mt. Royal, NJ: Association for Research in Otolaryngology. Antunes FM, Nelken I, Covey E, Malmierca MS (2010) Stimulus-specific adaptation in the auditory thalamus of the anesthetized rat. PLoS One 5:e14071. Bajo VM, Rouiller EM, Welker E, Clarke S, Villa AE, de Ribaupierre Y, de Ribaupierre F (1995) Morphology and spatial distribution of corticothalamic terminals originating from the cat auditory cortex. Hear Res 83:161–174.
Antunes and Malmierca • Cortical Influence on SSA in the Auditory Thalamus Bajo VM, Nodal FR, Moore DR, King AJ (2010) The descending corticocollicular pathway mediates learning-induced auditory plasticity. Nat Neurosci 13:253–260. Bartlett EL, Stark JM, Guillery RW, Smith PH (2000) Comparison of the fine structure of cortical and collicular terminals in the rat medial geniculate body. Neuroscience 100:811– 828. Carrasco A, Lomber SG (2009a) Differential modulatory influences between primary auditory cortex and the anterior auditory field. J Neurosci 29:8350 – 8362. Carrasco A, Lomber SG (2009b) Evidence for hierarchical processing in cat auditory cortex: nonreciprocal influence of primary auditory cortex on the posterior auditory field. J Neurosci 29:14323–14333. Chung S, Li X, Nelson SB (2002) Short-term depression at thalamocortical synapses contributes to rapid adaptation of cortical sensory responses in vivo. Neuron 34:437– 446. Coomber B, Edwards D, Jones SJ, Shackleton T.M., Goldschmidt J, Wallace MN and Palmer AR (2011) Cortical inactivation by cooling in smaller animals. Front Syst Neurosci. Advance online publication. Retrieved October 22, 2011. doi:10.3389/fnsys.2011.00053. Doron NN, Ledoux JE, Semple MN (2002) Redefining the tonotopic core of rat auditory cortex: physiological evidence for a posterior field. J Comp Neurol 453:345–360. Eytan D, Brenner N, Marom S (2003) Selective adaptation in networks of cortical neurons. J Neurosci 23:9349 –9356. Games KD, Winer JA (1988) Layer V in rat auditory cortex: projections to the inferior colliculus and contralateral cortex. Hear Res 34:1–25. Ghosh S, Murray GM, Turman AB, Rowe MJ (1994) Corticothalamic influences on transmission of tactile information in the ventroposterolateral thalamus of the cat: effect of reversible inactivation of somatosensory cortical areas I and II. Exp Brain Res 100:276 –286. Guillery RW (1995) Anatomical evidence concerning the role of the thalamus in corticocortical communication: a brief review. J Anat 187:583–592. Gutfreund Y, Knudsen EI (2006) Adaptation in the auditory space map of the barn owl. J Neurophysiol 96:813– 825. He J (2003a) Corticofugal modulation on both ON and OFF responses in the nonlemniscal auditory thalamus of the guinea pig. J Neurophysiol 89:367–381. He J (2003b) Corticofugal modulation of the auditory thalamus. Exp Brain Res 153:579 –590. Hernández O, Espinosa N, Pérez-González D, Malmierca MS (2005) The inferior colliculus of the rat: a quantitative analysis of monaural frequency response areas. Neuroscience 132:203–217. Kimura A, Donishi T, Okamoto K, Tamai Y (2005) Topography of projections from the primary and non-primary auditory cortical areas to the medial geniculate body and thalamic reticular nucleus in the rat. Neuroscience 135:1325–1342. Kimura A, Donishi T, Okamoto K, Imbe H, Tamai Y (2007) Efferent connections of the ventral auditory area in the rat cortex: implications for auditory processing related to emotion. Eur J Neurosci 25:2819 –2834. Lee CC, Winer JA (2005) Principles governing auditory cortex connections. Cereb Cortex 15:1804 –1814. Lomber SG (1999) The advantages and limitations of permanent or reversible deactivation techniques in the assessment of neural function. J Neurosci Methods 86:109 –117. Lomber SG, Malhotra S (2008) Double dissociation of ‘what’ and ‘where’ processing in auditory cortex. Nat Neurosci 11:609 – 616. Lomber SG, Payne BR, Horel JA (1999) The cryoloop: an adaptable reversible cooling deactivation method for behavioral or electrophysiological assessment of neural function. J Neurosci Methods 86:179 –194. Lomber SG, Malhotra S, Hall AJ (2007) Functional specialization in nonprimary auditory cortex of the cat: areal and laminar contributions to sound localization. Hear Res 229:31– 45. Luo F, Wang Q, Kashani A, Yan J (2008) Corticofugal modulation of initial sound processing in the brain. J Neurosci 28:11615–11621. Malmierca MS, Ryugo DK (2011) Descending connections of auditory cortex to the midbrain and brian stem. In: The auditory cortex (Winer JA, Schreiner CE, eds), pp 189 –208. New York: Springer. Malmierca MS, Herna´ndez O, Rees A (2005) Intercollicular commissural projections modulate neuronal responses in the inferior colliculus. Eur J Neurosci 21:2701–2710.
J. Neurosci., November 23, 2011 • 31(47):17306 –17316 • 17315 Malmierca MS, Izquierdo MA, Cristaudo S, Herna´ndez O, Pe´rez-Gonza´lez D, Covey E, Oliver DL (2008) A discontinuous tonotopic organization in the inferior colliculus of the rat. J Neurosci 28:4767– 4776. Malmierca MS, Cristaudo S, Pe´rez-Gonza´lez D, Covey E (2009) Stimulusspecific adaptation in the inferior colliculus of the anesthetized rat. J Neurosci 29:5483–5493. Merrill EG, Ainsworth A (1972) Glass-coated platinum coated tungsten microelectrodes. Med Biol Eng 10:662– 672. Nakamoto KT, Jones SJ, Palmer AR (2008) Descending projections from auditory cortex modulate sensitivity in the midbrain to cues for spatial position. J Neurophysiol 99:2347–2356. Nakamoto KT, Shackleton TM, Palmer AR (2010) Responses in the inferior colliculus of the guinea pig to concurrent harmonic series and the effect of inactivation of descending controls. J Neurophysiol 103:2050 –2061. Nelken I (2004) Processing of complex stimuli and natural scenes in the auditory cortex. Curr Opin Neurobiol 14:474 – 480. Nelken I, Ulanovsky N (2007) Mismatch negativity and stimulus-specific adaptation in animal models. J Psychophysiol 21:214 –223. Ojima H (1994) Terminal morphology and distribution of corticothalamic fibers originating from layers 5 and 6 of cat primary auditory cortex. Cereb Cortex 4:646 – 663. Ojima H, Rouiller EM (2011) Auditory cortical projections to the medial geniculate body. In: The auditory cortex (Winer JA, Schreiner CE, eds), pp 171–188. New York: Springer. Palmer AR, Hall DA, Sumner C, Barrett DJ, Jones S, Nakamoto K, Moore DR (2007) Some investigations into non-passive listening. Hear Res 229:148 –157. Paxinos G, Watson C (2005) The rat brain in stereotaxic coordinates. Burlington, VT: Elsevier-Academic. Pe´rez-Gonza´lez D, Malmierca MS, Covey E (2005) Novelty detector neurons in the mammalian auditory midbrain. Eur J Neurosci 22:2879 –2885. Peruzzi D, Bartlett E, Smith PH, Oliver DL (1997) A monosynaptic GABAergic input from the inferior colliculus to the medial geniculate body in rat. J Neurosci 17:3766 –3777. Ranganath C, Rainer G (2003) Neural mechanisms for detecting and remembering novel events. Nat Rev Neurosci 4:193–202. Reches A, Gutfreund Y (2008) Stimulus-specific adaptations in the gaze control system of the barn owl. J Neurosci 28:1523–1533. Reches A, Netser S, Gutfreund Y (2010) Interactions between stimulusspecific adaptation and visual auditory integration in the forebrain of the barn owl. J Neurosci 30:6991– 6998. Rees A (1990) A close-field sound system for auditory neurophysiology. J Physiol 430:2. Richardson BD, Ling LL, Uteshev VV, Caspary DM (2011) Extrasynaptic GABA(A) receptors and tonic inhibition in rat auditory thalamus. PLoS One 6:e16508. Robinson BL, McAlpine D (2009) Gain control mechanisms in the auditory pathway. Curr Opin Neurobiol 19:402– 407. Rothman JS, Cathala L, Steuber V, Silver RA (2009) Synaptic depression enables neuronal gain control. Nature 457:1015–1018. Rouiller EM, Welker E (1991) Morphology of corticothalamic terminals arising from the auditory cortex of the rat: a Phaseolus vulgarisleucoagglutinin (PHA-L) tracing study. Hear Res 56:179 –190. Rouiller EM, Welker E (2000) A comparative analysis of the morphology of corticothalamic projections in mammals. Brain Res Bull 53:727–741. Rushmore RJ, Payne BR, Lomber SG (2005) Functional impact of primary visual cortex deactivation on subcortical target structures in the thalamus and midbrain. J Comp Neurol 488:414 – 426. Ryugo DK, Weinberger NM (1976) Corticofugal modulation of the medial geniculate body. Exp Neurol 51:377–391. Schwartz O, Simoncelli EP (2001) Natural signal statistics and sensory gain control. Nat Neurosci 4:819 – 825. Sherman SM, Guillery RW (1998) On the actions that one nerve cell can have on another: distinguishing “drivers” from “modulators.” Proc Natl Acad Sci U S A 95:7121–7126. Sillito AM, Jones HE, Gerstein GL, West DC (1994) Feature-linked synchronization of thalamic relay cell firing induced by feedback from the visual cortex. Nature 369:479 – 482.
17316 • J. Neurosci., November 23, 2011 • 31(47):17306 –17316 Taaseh N, Yaron A, Nelken I (2011) Stimulus-specific adaptation and deviance detection in the rat auditory cortex. PLoS One 6:e23369. Ulanovsky N, Las L, Nelken I (2003) Processing of low-probability sounds by cortical neurons. Nat Neurosci 6:391–398. Ulanovsky N, Las L, Farkas D, Nelken I (2004) Multiple time scales of adaptation in auditory cortex neurons. J Neurosci 24:10440 –10453. Villa AE, Abeles M (1990) Evidence for spatiotemporal firing patterns within the auditory thalamus of the cat. Brain Res 509:325–327. Villa AE, Rouiller EM, Simm GM, Zurita P, de Ribaupierre Y, de Ribaupierre F (1991) Corticofugal modulation of the information processing in the auditory thalamus of the cat. Exp Brain Res 86:506 –517. Villa AE, Tetko IV, Dutoit P, De Ribaupierre Y, De Ribaupierre F (1999) Corticofugal modulation of functional connectivity within the auditory thalamus of rat, guinea pig and cat revealed by cooling deactivation. J Neurosci Methods 86:161–178. Volgushev M, Kudryashov I, Chistiakova M, Mukovski M, Niesmann J, Eysel
Antunes and Malmierca • Cortical Influence on SSA in the Auditory Thalamus UT (2004) Probability of transmitter release at neocortical synapses at different temperatures. J Neurophysiol 92:212–220. von der Behrens W, Ba¨uerle P, Ko¨ssl M, Gaese BH (2009) Correlating stimulus-specific adaptation of cortical neurons and local field potentials in the awake rat. J Neurosci 29:13837–13849. Winer JA, Kelly JB, Larue DT (1999) Neural architecture of the rat medial geniculate body. Hear Res 130:19 – 41. Winer JA, Diehl JJ, Larue DT (2001) Projections of auditory cortex to the medial geniculate body of the cat. J Comp Neurol 430:27–55. Winkler I, Denham SL, Nelken I (2009) Modeling the auditory scene: predictive regularity representations and perceptual objects. Trends Cogn Sci 13:532–540. Yang XF, Kennedy BR, Lomber SG, Schmidt RE, Rothman SM (2006) Cooling produces minimal neuropathology in neocortex and hippocampus. Neurobiol Dis 23:637– 643. Yu XJ, Xu XX, He S, He J (2009) Change detection by thalamic reticular neurons. Nat Neurosci 12:1165–1170.