THE JOURNAL OF COMPARATIVE NEUROLOGY 507:1920 –1943 (2008)
Connections of Cat Auditory Cortex: III. Corticocortical System CHARLES C. LEE* AND JEFFERY A. WINER Division of Neurobiology, Department of Molecular and Cell Biology, University of California at Berkeley, Berkeley, California 94720-3200
ABSTRACT The mammalian auditory cortex (AC) is essential for computing the source and decoding the information contained in sound. Knowledge of AC corticocortical connections is modest other than in the primary auditory regions, nor is there an anatomical framework in the cat for understanding the patterns of connections among the many auditory areas. To address this issue we investigated cat AC connectivity in 13 auditory regions. Retrograde tracers were injected in the same area or in different areas to reveal the areal and laminar sources of convergent input to each region. Architectonic borders were established in Nissl and SMI-32 immunostained material. We assessed the topography, convergence, and divergence of the labeling. Intrinsic input constituted ⬎50% of the projection cells in each area, and extrinsic inputs were strongest from functionally related areas. Each area received significant convergent ipsilateral input from several fields (5 to 8; mean 6). These varied in their laminar origin and projection density. Major extrinsic projections were preferentially from areas of the same functional type (tonotopic to tonotopic, nontonotopic to nontonotopic, limbic-related to limbicrelated, multisensory-to-multisensory), while smaller projections link areas belonging to different groups. Branched projections between areas were ⬍2% with deposits of two tracers in an area or in different areas. All extrinsic projections to each area were highly and equally topographic and clustered. Intrinsic input arose from all layers except layer I, and extrinsic input had unique, area-specific infragranular and supragranular origins. The many areal and laminar sources of input may contribute to the complexity of physiological responses in AC and suggest that many projections of modest size converge within each area rather than a simpler area-to-area serial or hierarchical pattern of corticocortical connectivity. J. Comp. Neurol. 507:1920 –1943, 2008. © 2008 Wiley-Liss, Inc. Indexing terms: divergence; convergence; SMI-32; laminar origins; areal origins
Auditory cortex (AC) receives ascending thalamic input, which it redistributes across a massive network of cortical and corticothalamic connections (Winer and Lee, 2007). Understanding how these thalamic and corticocortical inputs contribute to AC computations is challenging without a connectional framework for the many auditory cortical regions, particularly those without systematic representations of characteristic frequency (CF). In cat AC, five areas have such representations (Merzenich et al., 1973; Reale and Imig, 1980; Loftus and Sutter, 2001), and eight more have acoustically responsive cells (Woolsey, 1960; Schreiner and Cynader, 1984; Clarey and Irvine, 1990a; He et al., 1997) and robust auditory thalamic affiliations (Bowman and Olson, 1988b; Shinonaga et al., 1994; Clasca´ et al., 1997; Lee and Winer, 2008a) without a corresponding © 2008 WILEY-LISS, INC.
CF organization (Schreiner and Winer, 2007). A principled understanding of AC processing must address how such diverse physiological properties are integrated to derive the auditory scene, and how these different computational
Grant sponsor: National Institutes of Health; Grant number: R01 DC2319-29. *Correspondence to: Charles C. Lee, Department of Neurobiology, University of Chicago, 947 E. 58th St., MC 0926, Chicago, IL 60637. E-mail:
[email protected] Received 1 November 2006; Revised 13 November 2007; Accepted 19 November 2007 DOI 10.1002/cne.21613 Published online in Wiley InterScience (www.interscience.wiley.com).
The Journal of Comparative Neurology
CORTICOCORTICAL CONNECTIONS OF AUDITORY CORTEX metrics are established and organized by their connections. However, current knowledge of cat AC corticocortical connections is inadequate to construct models of information flow and the data available are confined to a few of the many areas (Rouiller et al., 1991). Thus, an important step is to specify the areal and laminar sources of cortical input, focusing on the origins and the relative strength of each convergent input. Do AC regions receive equally weighted input from similar (functionally related) areas and layers, or are families of areas (tonotopic-to-tonotopic, nontonotopic-to-nontonotopic, etc.) interconnected preferentially, or are there more specialized processing families? If so, then how do these families interact to integrate different streams of information? A profile of the convergent inputs to each area could illuminate their roles. The laminar origins likewise offer clues contributing to models of functional organization. If feedforward AC connections follow a single pattern, then different areas may be extracting analogous kinds of information in similar ways. When such connections involve multiple layers/sublayers, an area might participate in independent and parallel intercortical processes concurrently. Regardless, a more developed theory will require a knowledge of laminar arrangements that is now unavailable, and this question is a focus of the present study. Other facets of connectivity influence auditory cortex function. Thus, we investigated whether single corticocortical neurons project to more than one area. In the thalamocortical (Lee and Winer, 2008a) and commissural (Lee and Winer, 2008b) systems, we found little such divergence, suggesting that thalamic nuclei and commissural projections are highly specific, even in nonprimary areas or in regions devoid of tonotopic organization (Lee et al., 2004a). We also examined projection topography (Lee and Winer, 2005), which orders input and might be reduced in areas without tonotopic maps. We investigated corticocortical connectivity using a dual retrograde tracing strategy to reveal the areal and laminar sources of convergent projections to each AC area in adult cats. The patterns of retrograde labeling were analyzed with respect to their convergence, divergence, topography, and the profile of extrinsic and in-
1921
trinsic input. This is part of a larger investigation which includes the thalamocortical (Lee and Winer, 2008a) and commissural (Lee and Winer, 2008b) systems.
MATERIALS AND METHODS Surgery, perfusion, and histology Details of these procedures appear in a companion study (Lee and Winer, 2008a).
Data analysis An average of ⬇36 sections/experiment (a 1:6 series) were analyzed in the ipsilateral hemisphere; alternate series were examined to verify connectional patterns. Only sections whose labeling was representative of the global pattern seen in confirmatory experiments were accepted for analysis. Procedures for the reconstruction of areal labeling are presented in a related study (Lee and Winer, 2008b). Vertical banding observed in the areal maps results from the projection of serial sections onto the cortical surface (Lee and Winer, 2008b). Photomicrographs were taken using a Nikon digital camera (Nikon, Melville, NY) with accompanying software (ACT-1). Brightness and contrast adjustments were performed digitally using Canvas (Deneba Software, Miami, FL). The data were conserved during all digital manipulations and the concordance between the plotted material and photomicrographs was high. The laminar distribution of labeled neurons was determined by superimposing layer borders drawn independently with the Neurolucida system from adjacent Nissl preparations. Quantitative analysis of neuronal distributions within areas and among layers and nuclei were then made with Neuroexplorer software module. For each auditory area projecting to the target area the laminar origins were assigned point values as follows: supragranular (1.0), infragranular (0), bilaminar (0.5). A laminar origin index for each area (Fig. 11) was then computed as a weighted average of these laminar values.
RESULTS General features Several findings were present in all experiments. The largest input to each area originated from intrinsic
Abbreviations AAF AES AI AII Cg CVA D DZ ED EI EV I In L LS LLS MLS
Anterior auditory field Anterior ectosylvian field Primary auditory cortex Secondary auditory cortex Cingulate cortex Cingulate visual area Dorsal Dorsal auditory zone Posterior ectosylvian gyrus, dorsal part Posterior ectosylvian gyrus, intermediate part Posterior ectosylvian gyrus, ventral part Infragranular Insular cortex Lateral Lateral suprasylvian Lateral suprasylvian area, lateral bank Lateral suprasylvian area, medial bank
P Ps R Rs S Te Ve VP 7 20 20a 20b 21 21a 21b 35/36
Posterior auditory cortex Postsylvian visual area Rostral Rostrasplenial visual area Supragranular Temporal cortex Ventral auditory area Ventral posterior auditory area Visual area 7 Visual area 20 Visual area 20a Visual area 20b Visual area 21 Visual area 21a Visual area 21b Parahippocampal areas 35 and 36
The Journal of Comparative Neurology
1922
C.C. LEE AND J.A. WINER
Figure 1
The Journal of Comparative Neurology
CORTICOCORTICAL CONNECTIONS OF AUDITORY CORTEX sources and comprised ⬎50% of the total cortical projection. Intrinsic input always originated from multiple layers. The extrinsic input had predominantly infragranular projections and area-specific supragranular or bilaminar origins (Fig. 11). Extrinsic input originated from regions up to 18 mm away (Fig. 5A). From five to eight areas projected to each area. Most projections were clustered and topographic, although a few were columnar. Few neurons projected to more than one area (⬍2%). The maximal divergence was after deposits 2–3 mm apart in nontonotopic areas (Fig. 11B).
1923
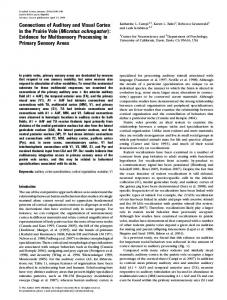
Primary auditory cortex (AI). Eight experiments targeted different AI domains, with four sets of deposits aligned physiologically within an isofrequency contour (Lee et al., 2004a). All AI deposits produced massive intrinsic labeling (Figs. 1A, 3A). However, smaller deposits labeled a vertical band and produced lighter caudorostral labeling in much of primary auditory cortex. AI received strong topographic input from all tonotopic fields (AAF, P, VP, Ve), and smaller projections from almost all other areas (Figs. 1B,D–I, 3, 11A). The primary areas had differential projections, with neurons labeled throughout areas P, Ve, and AAF, while those in area VP were in its dorsal half (Fig. 1A,E). However, AI shared many inputs with other tonotopic areas (Figs. 1A: AAF; 2A: P, VP). Both physiologically guided (Fig. 1) and nonphysiological (Fig. 3) deposits labeled loci in tonotopic areas consistent with the characteristic frequency or topographic gradient; thus, caudal AI injections labeled focal clusters in rostral AAF and dorsal P
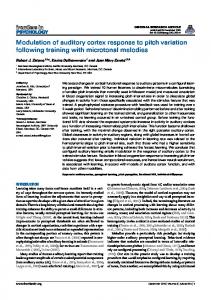
(Fig. 1A). Area AAF was the principal extrinsic input (⬎25%), with the other tonotopic regions (P, VP, Ve) contributing ⬎10% each (Figs. 1B, 3B). The dorsal auditory zone (DZ) was unique among nontonotopic regions, with robust input (⬎10%) that was highly clustered, whereas sparse, scattered projections (⬍5%) originated in the other nontonotopic regions (Figs. 1A, 3A). AI input was distinct qualitatively and quantitatively from that to nontonotopic areas, such as AII (Fig. 3A,B) in arising from few areas and having a more focal concentration. Anterior auditory field (AAF). Four of the six AAF experiments were guided by physiological mapping. As in AI, AAF input was mainly from foci in tonotopic areas AI, P, VP, and Ve (Fig. 1). A single deposit produced massive intrinsic labeling throughout AAF. The range of areas labeled was as large as that for AI. Frequencymatched injections in AI and AAF labeled overlapping clusters in many tonotopic regions (Fig. 1A), with ⬍0.5% of cells double-labeled (Figs. 1, 8B). These extrinsic clusters of labeling were focal in each area and, in the tonotopic areas, aligned with CF maps (Imaizumi et al., 2004; Lee et al., 2004b). The major extrinsic input arose from AI (⬎30%), with other tonotopic fields each providing ⬇10 –20%, and nontonotopic regions contributing ⬍5% each (Fig. 1B). Although the areal origin of projections to AAF and AI were highly similar, AAF had stronger parahippocampal (35/36) and cingulate cortex (Cg) (Fig. 1B,D,I) inputs (P ⬍ 0.05, df ⫽ 3, two-tailed, paired t-test) (Lee et al., 2004a), as well as from AII. Posterior auditory field (P). Area P received strong projections from adjacent tonotopic regions and moderate input from areas widely dispersed along the posterior ectosylvian gyrus. Two comparatively small deposits labeled cells in every auditory cortex subdivision (Fig. 2B). Deposits on the dorsocaudal bank (Fig. 2E) labeled major foci (15–25%) and lesser clusters at tonotopically/topographically appropriate loci in AI, VP, and Ve (Fig. 2A,B), with cells concentrated caudally in AI and ventrally in VP, in accord with the predicted, low frequency position of the dorsal area P deposits (Fig. 2A) (Imig and Reale, 1980). In contrast, the dorsal (corresponding presumptive high frequency) injections in VP labeled the appropriate locus of each tonotopic field, e.g., rostral AI (Fig. 2A). Unlike the other tonotopic
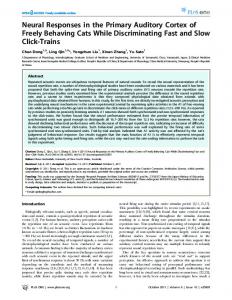
Fig. 1. Areal and laminar sources of ipsilateral corticocortical input to AI and AAF. A: Areal distribution of retrograde labeling from physiologically matched injections in the 7-kHz isofrequency contours in AI (CT; red circles) and AAF (CTG; blue circle) (Lee et al., 2004a). Vertical banding of labeled cells is an artifact of the computerized reconstruction process (see Materials and Methods). Each deposit involved primarily tonotopic regions (AAF, P, VP, Ve) with the labeled cells forming topographic clusters in accord with their characteristic frequency organization (Imig and Reale, 1980). Labeled neurons from both injections interdigitate in many areas, but labeled cells were topographically segregated, with few double-labeled (green dots; 0.5%) (Lee et al., 2004a). Some input (⬇15%) arose from heterotopic loci within these tonotopic areas. Each injection also labeled focal clusters in nontonotopic regions (DZ, AII, EI), with minor, scattered labeling elsewhere. B: The amount of extrinsic convergent input to both areas was similar in AI (red bars) and AAF (blue bars), each receiving most extrinsic input from the other injected area (⬎25%), significant input (⬎10%) from other tonotopic areas, and usually
⬍10% from nontonotopic regions. AI had stronger input from DZ, AAF from areas 35/36 and the cingulate cortex. C: The laminar origin of input was similar for AI (red bars) and AAF (blue bars), with infragranular projections dominating. D–I: Coronal views of input to AI (red dots) and AAF (blue dots) in a caudorostral sequence (A). D: Caudally, in the postectosylvian gyrus, clustered infragranular ED and EI projections originate, while areas 35 and 36 target AAF preferentially. E: At the caudal sulcal bank of the posterior ectosylvian sulcus (pes), mixed clusters of input from AI, P, and VP reach both areas. F: Focal labeling is present in the rostral bank in Ve, and within the AI injection sites; bilaminar DZ to AI projections were also present. G: Labeling in the middle ectosylvian gyrus shows laminar heterogeneity for both areas, bilaminar input from AI and DZ, and small infragranular clusters from areas AII, Te, and EV. H: The AAF injection was ⬍1 mm wide, and produced massive intrinsic labeling. I: Intrinsic AAF projections had bilaminar origins. Black dots, areal borders.
Local connectivity A modular organization of retrograde labeling was seen only in area AI, and after deposits orthogonal to the isofrequency axis (Fig. 3: blue dots), which labeled prominent columnar bands interspersed dorsoventrally among more weakly labeled areas (Fig. 3G,H: blue dots). Module width (250 –1,000 m) and intermodular spacing (250 –1,000 m) were variable (Fig. 3H: blue dots). In areas other than AI, intrinsic projections were isotropic, with weak or no modular spatial pattern. In every experiment the laminar origin of intrinsic sources included all layers except layer I.
Extrinsic areal origins: tonotopic areas
The Journal of Comparative Neurology
1924
C.C. LEE AND J.A. WINER
Figure 2
The Journal of Comparative Neurology
CORTICOCORTICAL CONNECTIONS OF AUDITORY CORTEX regions, AAF did not project heavily to P, with ⬍5% labeled neurons scattered in its rostral pole. Moderate projections (5–10%) from the posterior ectosylvian gyrus (areas ED, EI, EV), were clustered in EV, and distributed more diffusely in areas ED and EI. Sparse projections (⬍5%) from other nontonotopic regions (AES, AII, DZ, Te, In) clustered in each area. Thus, area P resembles the other tonotopic regions, having strong interconnections with areas AI, P, and Ve, and sparse AAF input (Fig. 8C). Ventroposterior auditory field (VP). Area VP had strong input from both nearby tonotopic regions and from the posterior ectosylvian gyrus. Three experiments targeted dorsal VP. Input to dorsal VP was consistent after injections either orthogonal to the sulcal bank (Fig. 2E) or on the rostral crest of the posterior ectosylvian gyrus (Fig. 6F). Clusters of labeled neurons in tonotopically appropriate (high frequency) loci were found in AI, P, Ve, and AAF (Figs. 2A, 6A), with Ve consistently a major source (10 –20%). Much like the input to area P, the posterior ectosylvian gyrus had prominent projections (⬎10%) to VP (Figs. 2B, 6B), and from specific loci in EP, e.g., ventrally in ED and EV, and dorsally from EI (Figs. 2A, 6A), which was the major source. Lesser projections (⬍10%) from other nontonotopic regions also arose in particular loci, e.g., caudally from area Te and dorsally in AII (Figs. 2A, 6A). Overall, VP is affiliated with other tonotopic regions by its strong input from them, and it is distinguished by stronger connections with EP areas (Fig. 8D). Ventral auditory area (Ve). The connections of this field closely resembled those of area VP, but with stronger input from areas P, AAF, and Te (Fig. 11A). Most of the labeling was in the upper half of area P, while the ventral portion of Te and the central part of area AAF also had large concentrations (Fig. 8A), and there was a focus in area In and lesser input throughout most of EP.
Nontonotopic areas
1925
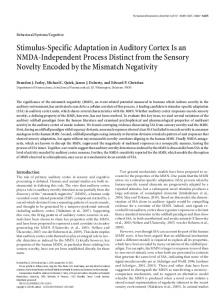
AII, which likewise projects to Ve (Fig. 8A). Other strong input (⬎10%) arose from adjacent temporal (Te) and insular (In) areas, and from specific topographic parts of areas EI and EV (Figs. 3B, 8B). Rostral and caudal parts of AII received topographic, segregated input from neuron clusters in rostral and caudal regions in ED, In, and Te, respectively (data not shown), and these were organized as topographically as those between tonotopic regions (Lee and Winer, 2005). Anterior ectosylvian sulcus (AES). In four experiments, AES deposits were made orthogonal to the caudal sulcal bank to reach the auditory subregion (Clarey and Irvine, 1990a; Meredith et al., 2006) (Fig. 4A,G). The retrograde labeling was focused in rostral AC and arose predominantly (⬎20%) from clusters of cells in the dorsal auditory zone (DZ) (Fig. 4G) and the anterior auditory field (AAF) (Fig. 4I) adjoining rostral AI (Fig. 4A). Lesser projections (⬍10%) arose from a broad combination of tonotopic (P, VP, Ve) and nontonotopic (AII, ED, EI, In) areas, whose origins were sparsely distributed and tightly clustered in each area. The labeling differed from that in multisensory and limbic regions, such as area ED whose input arises from fields outside the tonotopic core (Fig. 4A), e.g., the projections from the dorsal auditory zone (Fig. 4G: DZ). Thus, input to AES, like that to other nontonotopic regions, is largely segregated from the tonotopic, multisensory, and limbic groups; however, unlike AII, its connections arise in fewer areas (Fig. 9A). Dorsal auditory zone (DZ). This area (He et al., 1997) received input as focal (Fig. 8D) as that to area AES (Fig. 4A). Projections arose mainly from dorsal auditory regions, with prominent contributions (⬎10%) from AI (Ojima and Takayanagi, 2004), AII, AES, and ED (Fig. 8D). The labeling encircled dorsal and caudal zones of AI and P, much like that from injections in AAF and AES. In contrast to other nontonotopic regions, DZ has dominant dorsal areal affiliations (Fig. 9B).
Multisensory areas
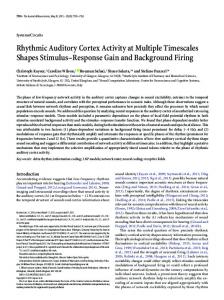
Second auditory cortex (AII). This area received the largest array of extrinsic connections, with modest and unexpectedly widespread input from most tonotopic regions (Fig. 3). In five experiments with AII deposits, areal origins abutted the tonotopic core areas (Fig. 3A). Injections in rostrodorsal AII (Fig. 3A) labeled many anterior ED neurons (Fig. 3B), a projection that was not reciprocated by injections in ED (Figs. 4A, 5A, 11A). The ventral auditory area (Ve) had strong input (⬎15%) to
Posterior ectosylvian gyrus (EP). This enormous 20 ⫻ 8 mm expanse contains auditory and visual subregions (Bowman and Olson, 1988a). Ten EP experiments were available, and the regions labeled included auditory and visual areas, with near-complete omission of the tonotopic areas. However, dorsal EP (ED) received stronger input from dorsal visual areas 7, LLS, MLS, 21 (Figs. 4, 5), whereas ventral EP (EV) was a
Fig. 2. Corticocortical projections to fields P and VP. A: Areal labeling after injection of CTG in P (blue circles) and CT in VP (red circles). The masses of segregated labeling were clustered spatially, as were the thalamic (Lee and Winer, 2008a) and commissural (Lee and Winer, 2008b) projections, and suggest that the injections were in different isofrequency contours. Field P input was more focal and in adjacent tonotopic regions (AI, Ve, VP), while that to VP had tonotopic and nontonotopic origins. Much input was clustered, with lesser, scattered In and Te projections (⬍5%). Double labeling (green dots) was ⬍1%. B: The proportion of extrinsic input to areas P (blue bars) and VP (red bars) resembled that for AI and AAF (Fig. 2), with major projections from other tonotopic regions, although VP had more nontonotopic input (AII, AES, DZ). C: Areas P (blue bars) and VP (red bars) had different laminar sources for their cross-projections and
from AII and DZ, despite similar areal inputs. D–I: Coronal view of projections to areas P (blue dots) and VP (red dots) at levels shown in A. D: Many cells in the posterior ectosylvian sulcus project to P and VP, with infragranular ED origins and bilaminar EI and EV sources. E: Injections in the caudal banks of the posterior ectosylvian sulcus (pes) were ⬍1 mm in diameter, with strong intrinsic labeling. AI had robust bilaminar input to P and VP. F: Topographically segregated Ve projections had bilaminar or infragranular P and VP projections, respectively. G: VP had bilaminar input from nontonotopic areas DZ and AII. H: More diffuse clusters arose in areas Te and In, with concentrated bilaminar projections from rostral AI. I: Rostrally, AAF had sparse, supragranular input to both fields. Black dots, areal borders.
The Journal of Comparative Neurology
1926
C.C. LEE AND J.A. WINER
Figure 3
The Journal of Comparative Neurology
CORTICOCORTICAL CONNECTIONS OF AUDITORY CORTEX
1927
cortical areas, with extrinsic projections ⬎10% from nearby areas EI, Te, and VP (Fig. 6A), from visual area 20b (Fig. 6D), and from the parahippocampal gyrus (Fig. 6E, F). Moderate input (5–10%) from tonotopic (P), nontonotopic (AII), multisensory (ED), and limbic (In) regions (Fig. 6B) recalled the pattern from area Te injections (Fig. 7). Another substantial input was of perirhinal origin (Fig. 6F). Each projection formed discrete topographic clusters, e.g., caudal sectors in areas EI, EV, and In projected preferentially to rostral zones of AII and Te (Figs. 6A, 7A). Some projections were more continuous (Fig. 6D: area 20b). This projection topography between such regions resembled the frequencymatched connectivity of the tonotopic regions, with similar topographic organizing principles in nontonotopic, multisensory, and limbic and primary regions (Lee and Winer, 2005). Area EV had fewer dorsal tier perivisual and association regions (LLS, MLS, 7) projections than ED but, interestingly, shared many areal sources with tonotopic area VP, including input from areas EI and P (Fig. 6A). Although EV was highly interconnected with other multisensory and limbic regions, it had stronger links with other ventral tonotopic and nontonotopic sources (Fig. 10F).
target of areas AII and Te cortex (Fig. 6). Although ED and EV were interconnected, projections from the other AC areas often outweighed these more local inputs (Fig. 11A). The intermediate area (EI) had transitional connections, resembling those to ED, and projected heavily to common EV targets (Fig. 11A). All EP regions are heavily connected with insular cortex (Fig. 5). Dorsal posterior ectosylvian gyrus (ED). This area received convergent input from a wide range of areas. Four experiments in different parts of ED yielded similar results (Figs. 4, 5). The strongest extrinsic input (⬎15%) arose from adjacent areas EI and the perivisual lateral suprasylvian sulcal areas LLS and MLS (Figs. 4A, 5A), bordering the rostral and caudal tonotopic regions. The LLS and MLS projections clustered on the lower sulcal banks and were segregated topographically from DZ input, whose moderate (⬇10%) projection otherwise targeted nontonotopic regions such as AES (Fig. 4A). ED received ⬎5% input from limbic region areas Te and In (Figs. 4B, 5B), and had proportional, reciprocal projections (Fig. 11A). The cingulate cortex (Cg) and visual area (CVA) had input comparable to that from area In (Fig. 5E,H). The distinction between multisensory and limbic areas and nontonotopic regions was clearest after deposits in areas ED and AES, which produced segregated foci of retrograde labeling (Fig. 4E,H); this contrasted with deposits in multisensory (ED) and limbic (In) regions, respectively, which were separated by some 14 mm, and from which similar areal patterns of labeling resulted (Fig. 4B). Whereas projections to areas In and ED had similar areal origins, they were segregated topographically (Fig. 4A). ED has strong connections with limbic, multisensory, and higher visual areas, and little tonotopic and nontonotopic input (Fig. 10E). Intermediate posterior ectosylvian cortex (EI). This area (data not shown) had inputs resembling those of ED (Fig. 11A). In three experiments, EI afferents arose from other multisensory and limbic regions, much like in ED. However, area EI was distinguished by stronger projections from ventral areas such as EV and Te (Figs. 6, 11A). The similarity of its inputs to those of ED and its output with those of EV contrasted with its more distinct thalamic (Lee and Winer, 2008a) and commissural inputs (Lee and Winer, 2008b). Ventral posterior ectosylvian cortex (EV). The projection pattern here included many tonotopic and nontonotopic sources but otherwise resembled that in ED and EI. Injections in central EV (Fig. 6) labeled ventral
Insular cortex (In). Input to this area arose chiefly from other limbic and nonprimary regions, resembling the pattern for ED (Fig. 5A). Five experiments had similar areal distributions of labeling, which formed topographic clusters in each area. The largest extrinsic input came from area Te (⬎20%) (Fig. 5B), in its rostral part. Smaller, focal projection zones (5–10%) arose in the posterior ectosylvian (ED, EI, EV) and dorsal auditory zone (DZ) areas (Fig. 5B), and after injections in the anterior sylvian part of area In (Clasca´ et al., 2000). The labeling resembled projections to ED, arising from areas bordering AC, but without the extrastriate visual input (areas 7, 20, Ps) to area ED (Fig. 10D,E). Temporal cortex (Te). Area Te received limbic and multisensory projections as well as adjacent tonotopic and nontonotopic input (Fig. 7), originating primarily in ventral AC, similar to EV (Fig. 6A). Despite a similar global input pattern, areas Te and EV differ in their principal projections (Fig. 13I,L). Input to Te concentrated in ventral AC, with prominent labeling (⬇10 – 20%) in areas EI, EV, AII, Ve, and In (Fig. 10C), near the ventral tonotopic core (Fig. 7A). Sparser projections in dorsal ED were still clustered (Fig. 7B). All input to
Fig. 3. Comparison of projections to AI and AII. A: Areal labeling after deposits of wheat-germ apo-horseradish peroxidase goldconjugate (WAHG) in AI (blue circles) and CT in AII (red circles) was segregated. Many auditory cortex areas were labeled, with clustered AI projections (blue dots) concentrated in other tonotopic regions (AAF, P, VP). AII (red dots) input was equally clustered and originated in nontonotopic areas (ED, In, Te). Physiologically similar regions thus were highly interconnected, with weaker (⬍5%) nontonotopic projections. Double labeling (green dots) was ⬇1%. B: Projections to AI (blue bars) and AII (red bars) differed, with only Ve sending comparable input (⬎10%) to both. Strong input (⬎15%) from other sources to one area correlated with weak (⬍5%) input to the other. C: Laminar inputs to AI (blue bars) and AII (red bars)
differed, AI having largely infragranular and AII a bilaminar pattern. D–I: Coronal sections of AI (blue dots) and AII (red dots) projections (A). D: Posterior ectosylvian areas (ED, EI, EV) afferents to AII were bilaminar, whereas both AI and AII had infragranular area 35 and 36 input. E: Tonotopic areas P and VP had infragranular input to AI. F: Conversely, areas P and VP had weaker supragranular input to AII, and strong bilaminar ED input to AII. Areal origin of projections to AI and AII differed. G: AI injections produce strong intrinsic bilaminar labeling and weaker, infragranular AII input. H: AII injections ⬍1 mm in diameter produced strong intrinsic labeling and extrinsic AES and Te projections. I: Rostrally, AAF and In had major bilaminar inputs to AI and AII, respectively.
Limbic areas
The Journal of Comparative Neurology
1928
C.C. LEE AND J.A. WINER
Figure 4
The Journal of Comparative Neurology
CORTICOCORTICAL CONNECTIONS OF AUDITORY CORTEX Te was clustered topographically since deposits at different rostrocaudal loci labeled specific foci in areas EI, EV, AII, and In (Fig. 7A). These subregions were reciprocally interconnected, as deposits in areas EV (Fig. 6), In (Fig. 5), AII (Figs. 3A,G, 8B) and ED (Figs. 4, 5) show. Moreover, projections from tonotopic area Ve were topographic from the rostral bank of the posterior ectosylvian sulcus (Fig. 7G).
Laminar origins
1929
projections (Fig. 11A). By comparison, Te inputs were bilaminar (Fig. 7C), except for a moderate parahippocampal infragranular projection (⬇5%).
Divergent projections The maximal divergence (⬇2%) was from injections less than 2 mm apart in the same area, e.g., Te and In (Fig. 12B). Tonotopic areas had the fewest divergent projections, as demonstrated by comparing deposits at similar separations (Fig. 12B: AI, AAF). Injections in AI and AAF at matched frequency loci, experiments designed to maximize the amount of double labeling, never exceeded 2% double labeling, a value that was statistically indistinguishable from nonphysiological injections in tonotopic and nontonotopic areas (analysis of variance [ANOVA], P ⬎ 0.05) (Fig. 12B) (Lee et al., 2004a). Injections almost 14 mm apart in areas In and ED double-labeled few cells (⬇0.1%).
Extrinsic input was primarily from infragranular sources, with some areas receiving more bilaminar and supragranular input (Fig. 11). Extrinsic laminar input was compared from all sources (Fig. 11B; see Materials and Methods). Tonotopic areas received mainly infragranular input, while nontonotopic and limbic areas had more bilaminar and supragranular origins (Fig. 11B). No area received preponderantly supragranular projections. Tonotopic areas AI and AAF were the most stereotyped, receiving almost entirely infragranular projections. Areas VP and Ve had more complex patterns, with more bilaminar projections from many sources (Fig. 11). In VP the laminar origin was heterogeneous even among related areas. Nontonotopic areas received more bilaminar and supragranular extrinsic input than the tonotopic regions. Thus, area AII had the most bilaminar input (0.6) (Fig. 11B), and tonotopic areas AI and AAF the least (0.1). AII received bilaminar input from nontonotopic (Fig. 3H,I), multisensory and limbic (Fig. 3D,G) regions, and supragranular input from tonotopic sources (Fig. 3C). DZ also received tonotopic supragranular input, and infragranular nontonotopic and limbic input (Fig. 11A). AES had more homogeneous laminar input sources than AII and DZ, and many bilaminar sources (Fig. 4C). Multisensory areas had laminar ranges (0.2– 0.5) intermediate to tonotopic (0.1– 0.3) and nontonotopic (0.3– 0.6) areas (Fig. 11B). Most input to ED was infragranular, especially in ventral areas EV (Fig. 5E), Te (Fig. 5H), and 35/36 (Fig. 5E); in contrast, visual-related input from areas 21 (Fig. 5D), Ps (Fig. 5D), LLS (Fig. 5G,H), and 7 (Fig. 5E) was bilaminar. Afferents to areas EI and EV had still stronger bilaminar origins. EI had the most stereotyped projection profile, receiving largely bilaminar input (Fig. 11A). EV received more infragranular afferents from areas ED (Fig. 6E) and In (Fig. 6I). Among the limbic areas, insular cortex received infragranular ventral auditory input from areas EV (Fig. 5E), 35/36 (Fig. 5F), and Te (Fig. 5H), and some bilaminar
This study found that AC corticocortical connections are more extensive than in prior studies (Imig and Reale, 1980; Bowman and Olson, 1988a; Clarey and Irvine, 1990b; Rouiller et al., 1991), yet ordered by several principles. The major input (⬎50%) to all areas arises from intrinsic sources. The extrinsic corticocortical connections link familial areal groups (Fig. 14), of which the individual areas are distinguished by the strength and patterns of their individual principal inputs (Fig. 13). Thus, the families of tonotopic regions (AI, AAF, P, VP, and Ve), nontonotopic fields (AII, DZ, AES), multisensory (ED, EI, EV) areas, and limbic (Te, In) territories each have preferential connections. The major extrinsic connections to each area arose from multiple areas (Fig. 13) and were equally topographic for every familial affiliation. The tonotopic areas (Fig. 13A–E) have the strongest within-family affiliations; the nontonotopic areas (Fig. 14B), multisensory (Fig. 14C), and limbic (Fig. 14D) areas receive little input from the tonotopic areas (Fig. 12A). Exceptions to this rule, such as the area AI and P projections to DZ (Fig. 12H), may reflect problems with injecting this relatively small area. There is ample reason for accepting the present, widespread projections as valid. First, the thalamocortical (Lee and Winer, 2008a) and commissural (Lee and Winer, 2008b) labeling from the same experiments is remarkably focal and highly restricted. Second, despite the breadth of the projections, the primary foci are highly constrained, often abutting the immediate area
Fig. 4. Retrograde labeling after deposits in ED and AES. A: Areal projections after injections of CT in ED (red circles) and CTG in AES (blue circle) were segregated. ED afferents (red dots) were in limbic and multisensory areas (EI, EV, In, Te), with sparse tonotopic input and significant higher-order visual projections (areas Ps, 7, 21). In contrast, prominent projections to caudal AES arose in DZ, In, and AAF, with weaker VP, Ve, and AII input. Most labeling was focal, with double labeling ⬍0.1% (green circles). B: Input to AES (blue bars) and ED (red bars) differed. AES received robust (⬎15%) AAF and DZ input, while ED had strong DZ, In, EI, and EV projections, and strong extrastriate visual and cingulate cortex input (Fig. 6B).
C: The laminar origin of AES (blue bars) and ED (red bars) projections differed. D–I: Coronal sections of AES (blue dots) and ED (red dots) origins (A). D: The ED injections abutted, causing significant intrinsic labeling and strong EI and EV input. E: ED also received strong bilaminar input from the posterior LLS, while AES received weak area EI input. F: Unlike ED, area AES received bilaminar tonotopic (Ve) input. G: The AES deposit had little diffusion, and strong intrinsic labeling. AES also had ⬎15% bilaminar DZ input; this was topographically segregated from the LLS projection to ED. H,I: ED had a robust bilaminar area In projection, while AES received strong bilaminar input from nearby AAF and DZ.
DISCUSSION
The Journal of Comparative Neurology
1930
C.C. LEE AND J.A. WINER
Figure 5
The Journal of Comparative Neurology
CORTICOCORTICAL CONNECTIONS OF AUDITORY CORTEX
1931
Intrinsic connections. The chief input to each area is intrinsic, comprising more than half of the total cortical projection and usually originating from about onethird of the total area (Table 1). This implies that the functional profile of cortical neurons is shaped largely by local and remote cortical influences and that the impact of thalamic and interhemispheric pathways is comparatively much smaller and perhaps, by analogy, more limited and functionally specific. Extrinsic projections. Each area received extrinsic input from more areal sources than previously observed (Imig and Reale, 1980; Bowman and Olson, 1988a; Clarey and Irvine, 1990b; Rouiller et al., 1991). An area can receive projections from up to 12 other regions, and these inputs differ widely in the number of neurons projecting. This confirms their anatomical independence and helps to establish the functional identity of areas, which remain to be analyzed in detail physiologically in many regions (e.g., areas EV, VP, etc.). Areas such as insular and temporal cortex, which share common affiliations and might therefore be construed as one area, are distinguished by their specific corticocortical areal and laminar inputs (Figs. 13I,J, 14D). This strategy may also enable the recognition of new areas (BrettGreen et al., 2003). A second conclusion is that the major sources of input identify and demarcate functionally related groups (tonotopic, nontonotopic, multisensory, and limbic) based on the strength and pattern of their connections (Fig. 14). The tonotopic regions (AI, AAF, P, VP, and Ve) form one such highly interconnected group (Fig. 14A), with major projections originating from tonotopically appropriate loci in each area. This is consistent with prior studies of connectivity among physiologically identified loci (Imig and Reale, 1980; Rouiller et al., 1991; Lee et al., 2004a). Imig and Reale (1980) reported maximal anterograde labeling between adjacent tonotopic areas
and elongated along the corresponding isofrequency axes in each area. The areal distribution of anterogradely labeled boutons they reported corresponds closely with the organization of retrogradely labeled neurons found in the present study, and underscores the reciprocal connectivity of matched isofrequency regions. However, such reciprocity may not be preserved on a laminar basis, as Rouiller et al. (1991) found that laminar origins and terminations do not always coincide. Intrinsic areal processing may modify isofrequencyspecific input before returning it to the sources. Notably, we also found significant heterotopic projections from outside the isofrequency domain (Lee et al., 2004b), and in areas far beyond the predicted tonotopic core. These heterotopic projections have not previously been noted, likely due to the lack of sensitivity of tracers employed. The functional salience of the smaller projections is obscure. The nontonotopic regions are equally highly interconnected. The connectivity principles pertaining in the tonotopic regions, such as topography, dispersion, and clustering, apply equally to the nontonotopic regions (Lee and Winer, 2005). Area AII, for example, is without an ordered representation of characteristic frequency (Schreiner and Cynader, 1984), yet has topographic connections with adjoining fields, such as areas AES, In, and Te, which have not previously been observed (Imig and Reale, 1980; Rouiller et al., 1991; Izumi and Nakamura, 1998). Izumi and Nakamura (1998) found anterograde projections from AII in these surrounding regions that were not topographic, but noted an unexpected convergence with terminals from AAF in fields P and VP. Whether this absence of anterograde topography reflects a disjunction in areal reciprocity is unclear, but, like the tonotopic regions, reciprocity is not always preserved on a laminar basis (Rouiller et al., 1991; Izumi and Nakamura, 1998). The distribution of AII terminals in tonotopic fields is consistent with the present results of tonotopic inputs to and projections from AII. It supports the view that, while areas within groups are strongly interconnected, they are neither isolated nor do they act alone. The other nontonotopic regions, areas AES and DZ, likewise have strong connections with one another and with AII and weaker connections with other areal groups. Area AES is complex functionally, as it contains multiple, modality-specific subregions (Clarey and Irvine, 1990a; Meredith et al., 2006). Clarey and Irvine (1990a,b) described the auditory sector in AES along the caudal sulcal
Fig. 5. Cortical input to areas In and ED. A: Area In (CTG; blue circles) and ED (CT; red circles) input arose in nontonotopic, multisensory, and limbic areas, particularly EI, EV, and DZ, with sparser tonotopic input. Areas projecting to both In and ED had topographic, interdigitated labeled clusters. ED received strong input from secondary visual areas (LLS, MLS, 7, 20, Ps), while In has stronger affiliations with neighboring areas (Te, AES). Double labeling (green dots) was ⬍0.5%, greater than in other unrelated pairs, e.g., ED and AES (Fig. 4). B: Afferents to areas In (blue bars) and ED (red bars) arose from shared sources in areas DZ, EI, EV, 35 and 36. Tonotopic contributions were ⬍5% of extrinsic input (Fig. 10D,E), and are omitted. ED had more visual input (LS, 7, 20, Ps), while area In received more AES and Te afferents. Each area projects significantly (⬇10%) to the other. C: Areas In (blue bars) and ED (red bars) received laminar
infragranular or bilaminar input, as did many regions projecting to both. D–I: Sources of input to areas In (blue dots) and ED (red dots). D: ED had strong bilaminar input from visual areas 21 and PS. E: ED injections had marked intrinsic labeling and significant input from the cingulate visual area (CVA), areas 35 and 36, and posterior ectosylvian sulcus (EI, EV). These extrinsic sources had segregated area In projections from similar laminar sources. F: Rostral ED had significant bilaminar input to area In. Tonotopic regions projected sparsely to both areas. G: The middle ectosylvian sulcus input was strong and topographic. Area In projections extended high in the DZ sulcal bank. ED projections extended from the ventral bank in LLS to the dorsal bank in MLS. H: Area In had a major infragranular Te input. The anterior cingulate cortex had minor projections to both areas. I: Intrinsic area In labeling reached its rostral border.
injected (e.g., Fig. 13G,H) but just as often remote (Fig. 13F), or a combination of nearby and remote sources (Fig. 13J). Third, the projections follow a functional logic, such that areas related by their physiology share the densest interconnections (Fig. 14). Finally, the projection patterns depicted were seen repeatedly, in both mapped and unmapped experiments, and could always be related to their patterns of commissural and thalamocortical connectivity.
Comparison with prior studies
The Journal of Comparative Neurology
1932
C.C. LEE AND J.A. WINER
Figure 6
The Journal of Comparative Neurology
CORTICOCORTICAL CONNECTIONS OF AUDITORY CORTEX
1933
bank, and whose retrogradely labeled cells of origin match the strong extrinsic inputs from rostral sectors of areas AII, AAF, DZ, and In (Fig. 13G). Connections with other nonauditory regions were not seen in our experiments, such as the somatosensory connectivity found by Meredith et al. (2006); however, our injections were restricted to the auditory caudal bank and, thus, may have been outside these other modality-specific subregions. Interestingly, the above average ratio of intrinsic-to-extrinsic connectivity in the present study suggests a substrate for polymodal integration in AES. By comparison, area DZ is more closely aligned with adjacent auditory areas, and thus to integrating specific auditory information. Ojima and Takayanagi (2004) found convergent projections to DZ from multiple isofrequency domains in AI, inputs which may underlie its broader tuning characteristics (He et al., 1997). Our findings extend this picture, such that DZ must integrate this frequency-specific information with equally large, and functionally mixed, inputs from (nontonotopic) areas AES and AII, and from (tonotopic) area P. Thus, as a group, the nontonotopic regions are connectionally poised to influence multiple areas, and across a wide array of functional subdomains, to reach other groups. This suggests that they have a higher role in any prospective hierarchical scheme. The multisensory regions of the posterior ectosylvian sulcus (EP) constitute another group of highly connected areas (Fig. 14C). Projections to EP have many auditory and visual origins caudorostrally along the sulcus, suggesting further areal and regional distinctions in this large territory. Bowman and Olson (1998a) described auditory projections originating rostrally along EP, while visual-related inputs prevail more caudally. We find a further, dorsoventral auditory and visual segregation, with dorsal EP receiving stronger perivisual corticocortical input than ventral EP, which, in turn, has stronger connections with ventral tonotopic and limbic regions. Common to both dorsal and ventral regions of EP are the prominent connections with limbic areas Te and In, suggesting a substrate for relating autonomic and emotive valence to multisensory processes. The functional affiliations of the dorsoventral and rostrocaudal connectional axes in EP are less clear, although, as Bowman and Olson (1998a) suggest, the caudal visual domain may dominate in more dorsal regions. However, the parcellation of EP remains incomplete. The limbic regions comprise a further group of areas, with areas Te and In sharing topographic and reciprocal connections. These regions are at the extremes of auditory cortical functional affiliation (Colavita, 1979), as their role in acoustic processing is arguably indirect, yet
they are directly connected with areas fundamental to hearing. Clasca´ et al. (2000) defined several closely apposed subregions within the insular cortex whose connections originate in olfactory, frontal, somatosensory, and auditory cortex, respectively. Their anterior sylvian sector (AS) is most closely associated with auditory cortex, and has the strongest auditory connections with areas AII and Te, and weaker connections with multisensory regions in ED. The present deposits in area In are most closely aligned with their AS results, but we find that ED and In relations are stronger than previously suggested, a conclusion that is supported by their shared thalamic (Lee and Winer, 2008a) and commissural (Lee and Winer, 2008b) connections. By contrast, the Te connections are more closely aligned with EV, suggesting specific, limbic-related circuitry differentially influencing the multisensory processes within EP. Divergent input. Sparse divergent corticocortical projections (⬍2%) are present in all fields (Figs. 12B), even in physiologically matched regions (Lee et al., 2004a) or after tracer deposits less than 2 mm apart, where such input might be greatest. These results resemble those in the thalamocortical (Lee and Winer, 2008a) and commissural (Lee and Winer, 2008b) systems, and suggest that few cortical processes are contingent on the convergence of single neurons (Lee and Winer, 2008a). In the visual system, divergent projections between retinotopically matched regions were ⬎15% (Bullier, 1984), suggesting that the coordination of frequency information among regions is more segregated in AC or that variations in tracer efficacy and sensitivity contribute to the apparent differences. Comparison with monkey auditory cortex. The multiple areas of the cat auditory cortex are related on the basis of their cortical and subcortical connections (Lee and Winer, 2008a,b), which constitute distinct areal families (Fig. 14). This scheme resembles that proposed in the monkey (Kaas and Hackett, 2000), where auditory areas representing core, belt, and parabelt regions have been defined based on their connections and cytoarchitecture. From a comparative standpoint, relating the present results to those in other species is useful for assessing potential interspecific homologs (Stiebler et al., 1997; Fitzpatrick et al., 1998; Budinger et al., 2000; Doron et al., 2002; Bizley et al., 2005), and for deriving ontological and evolutionary perspectives on auditory cortex. Can this organizational scheme be extended to the cat? On a global level, the cat tonotopic, nontonotopic, and multisensory regions correspond approximately to the core, belt, and parabelt regions, respectively. Kaas and Hackett (2000) describe the three principal tonotopic re-
Fig. 6. Cortical input to areas EV and VP. A: Labeling after deposits of CTG into EV (blue circles) and CT into VP (red circles) was segregated topographically. EV input (blue dots) concentrated in ventral auditory and visual regions, and was focal and clustered in areas Te, In, AII, 20, and Ps. In contrast, VP input was from tonotopic and nontonotopic regions and favored adjacent areas (Ve, EI, EV). Double labeling (green dots) was ⬇0.5%. B: The extrinsic input to EV (blue bars) and VP (red bars) differed. EV received afferents from nearby areas VP, EI, Te, and 35/36. VP shared ED, EI, and Te input, and had more tonotopic input (Ve). Input from the visual areas is
omitted. C: Both areas had infragranular and bilaminar cells of origin. D–I: Coronal views of areas EV (blue dots) and In (red dots) projections (A). D: EV had significant infragranular input from areas 20a and 20b. E: ED and EI input to both areas was infragranular and bilaminar. F: Both injections were ⬍1 mm in diameter, with significant intrinsic labeling, and infragranular areas 35 and 36 projections. G: VP had ⬎15% input from area Ve, with bilaminar origins. H: Areas AII and Te had more bilaminar projections to EV than to VP, which received more AI and DZ input. I: Projections at the AI/AAF border to VP were consistent with the tonotopic organization of each area.
The Journal of Comparative Neurology
1934
C.C. LEE AND J.A. WINER
Figure 7
Fig. 8. Cortical projections to areas Ve, AII, In, and DZ. A: Input to Ve resembled the pattern after injections in VP. Labeling is focused in the posterior ectosylvian sulcal areas and in other tonotopic regions (AI, AAF, P), but with large inputs from AII and Te. B: The AII pattern contrasted with that in the adjacent areas Ve (A) and In (C), largely avoiding the tonotopic regions and strongly labeling all other areas.
C: The area In pattern resembled that in AII, but lies more rostrally, and labels DZ more weakly. D: Area DZ received projections largely from other dorsal auditory regions, with prominent inputs bordering AI rostrally and P caudally. For clarity, injections in one area only are depicted in each case.
Fig. 7. Cortical projections to area Te. A: Retrograde CT (red circles) and CTG labeling (blue circles) after Te deposits. Te had robust input from nearby AII, Ve, In, and strong EI, EV, and 35/36 input. Other than Ve, tonotopic regions largely avoided Te. Double labeling (green dots) was ⬇1.2%, perhaps because of injection proximity. B: Rostral (blue boxes) and caudal (red boxes) Te received similar input from AII, Ve, In and EI, EV. C: Projections to rostral (blue boxes) and caudal (red boxes) Te were bilaminar, except for the infragranular area 35 and 36 input. D–I: Input to rostral (blue dots) and caudal (red dots) Te (A). D: Rostral
Te received bilaminar input from the caudal posterior ectosylvian gyrus. E: Conversely, rostral EI and EV have bilaminar projections to caudal Te. F: All labeling was focal and clustered. Areas 35 and 36 had prominent infragranular projections. G: Tonotopic area Ve had strong, topographically segregated input. H: Deposits elicited focal intrinsic labeling, and topographically segregated, bilaminar AII labeling. I: Nearby area In had strong input to different parts of Te from segregated, bilaminar sources.
The Journal of Comparative Neurology
1936
Fig. 9. Graphical summary of convergent input (see also Fig. 10). Each panel represents the relative proportion of convergent input to an area (large black circle). Projection strengths are indicated by dot sizes and line thicknesses: large dots/thick lines (⬎15%), medium
C.C. LEE AND J.A. WINER
dots/bold lines (5–15%), small dots/thin lines (⬍5%). Colors, areal groups: red (tonotopic), green (nontonotopic), blue (multisensory), purple (limbic). A: AI. B: AAF. C: P. D: VP. E: Ve. F: AII.
The Journal of Comparative Neurology
CORTICOCORTICAL CONNECTIONS OF AUDITORY CORTEX
Fig. 10. Convergent input summarized graphically (see also Fig. 9). Each panel is the relative proportion of convergent input to an area (large black circle). Projection strengths are shown by dot sizes and line thicknesses: large dots/thick lines (⬎15%), medium dots/bold
1937
lines (5–15%), small dots/thin lines (⬍5%). Colors, areal groups: red (tonotopic), green (nontonotopic), blue (multisensory), purple (limbic), yellow (visual). A: AES. B: DZ. C: Te. D: In. E: ED. F: EV.
The Journal of Comparative Neurology
1938
C.C. LEE AND J.A. WINER
Fig. 11. Summary of cat laminar corticocortical cells of origin in 13 auditory areas. A: Laminar profiles for the mean of all areal deposits classified as supra- (S) or infragranular (I) if ⬎70% of the labeling was so distributed (see Materials and Methods). Within groups there was laminar input heterogeneity. Thus, VP and Ve received more bilaminar input than other tonotopic areas. Each area also had differential
projections to other regions, e.g., AII had infragranular input to AI, AAF, and P, and bilaminar input elsewhere. B: The global laminar average weights of all input to an area: infragranular (0), bilaminar (0.5), supragranular (1). Bilaminar or infragranular input predominates, and no area was dominated by supragranular input.
gions in monkey auditory core (areas AI, R, RT) which are intensely and selectively defined by several cytoarchitectonic markers, notably parvalbumin. These areas are interconnected densely with neighboring core and belt regions, but avoid the parabelt. Their principal thalamic input is from the medial geniculate body ventral division (de la Mothe et al., 2006). In the cat, the tonotopic areas AI, AAF, P, VP, and Ve are heavily interconnected, but unlike the monkey also receive minor multisensory and limbic projections (present results). However, the cat tonotopic areas appear to outnumber the monkey core regions, although several primate belt regions (CL, ML, and AL)
also have tonotopic gradients (Kaas and Hackett, 2000). Thus, equating cat tonotopic areas with their prospective homologs in the monkey may be impractical due to areal (and/or functional) nonequivalence. For example, cat AAF has strong connections with DZ, a nontonotopic region, and receives more medial geniculate body rostral pole input (Lee et al., 2004a). It is thus aligned more closely with monkey belt areas CL and CM rather than those of the core areas R and RT, whose connections better match them with cat areas P/Ve and VP, respectively. The monkey belt regions (areas CL, ML, AL, RTL, CM, MM, RM, RTM) form a massive ensemble of areas
The Journal of Comparative Neurology
CORTICOCORTICAL CONNECTIONS OF AUDITORY CORTEX
Fig. 12. Summary of the areal distribution of cortical projections and branched input to each area. A: Relative strength of extrinsic cortical projections. Dot sizes, the proportion of the extrinsic projection, and the average values of all injections/area. The auditory cortex has massively divergent interconnections, most forming ⬍5% of the total. A pattern of strong (⬎15%) and medium (5–15%) projections was unique for each area, with similarities within groups that denote tonotopic (AI, AAF, P, VP, Ve), nontonotopic (AII, AES, DZ), multisensory (ED, EI, EV), and limbic (Te, In) areas which are intercon-
1939
nected preferentially within class, with weaker intergroup projections. Laminar distributions: infragranular (yellow), bilaminar (black), supragranular (purple). B: The proportion of double-labeled cells related to tracer separation. Double labeling was ⬍2% and maximal when both injections were in an area, e.g., Te/Te or In/In. Interareal divergence averaged ⬍0.5% for all injected areas, even at 10 –14 mm intervals. Branching was maximal in limbic areas (⬇1.5%) and minimal in tonotopic regions (⬍0.5%).
The Journal of Comparative Neurology
1940
C.C. LEE AND J.A. WINER
Fig. 13. Graphical summary of the three largest inputs to each area. Projection strengths are indicated by dot sizes and line thicknesses. Colors, areal groupings: red (tonotopic), green (nontonotopic), blue (multisensory), purple (limbic). A: AI. B: AAF. C: P. D: VP. E: Ve. F: AII. G: AES. H: DZ I: ED. J: EV. K: Te. L: In.
encircling the core regions (Kaas and Hackett, 2000). Their principal thalamic input is from the dorsal and medial nuclei of the medial geniculate body (MGd, MGm, SG, Lim) (Hackett et al., 1998; de la Mothe et al., 2006), and these areas are heavily connected with ad-
jacent cortical core and belt areas. The cat nontonotopic regions (AII, DZ, AES) share many of the same types of thalamic (Lee and Winer, 2008a) and cortical connections (Fig. 11A), and thus are considered belt-like. The cat posterior ectosylvian gyrus (EP) also contains puta-
The Journal of Comparative Neurology
CORTICOCORTICAL CONNECTIONS OF AUDITORY CORTEX
Fig. 14. Graphical summary of the major input to each area within a group. Dots indicate origin of projection and arrowhead indicates termination. A: Tonotopic areas (AI, AAF, P, VP, Ve). B: Nontonotopic areas (AII, AES, DZ). C: Multisensory areas (ED, EI, EV). D: Limbic areas (Te, In).
1941
The Journal of Comparative Neurology
1942
C.C. LEE AND J.A. WINER
TABLE 1. Areal Comparison of Intrinsic vs. Extrinsic Projection Origins in Cat Auditory Cortex Area1 AI AAF P VP Ve AII AES DZ Te In ED EI EV Avg. SD.
Intrinsic2
Extrinsic2
68.3 67.3 56.9 49.5 42.9 48.3 73.6 49.6 42.0 62.8 48.9 55.4 57.3 55.6 9.9
31.7 32.7 43.1 50.5 57.1 51.7 26.4 50.4 58.0 37.2 51.1 44.6 42.7 44.4 9.9
Principal extrinsic inputs3 AAF (45) AI (48) AI (26) AI (16) P (22) Te (20) AAF (30) AI (20) EV (19) Te (26) EI (19) EV (15) EI (22)
VP (13) P (11) VP (22) VE (14) Al (12) In (15) DZ (25) P (19) In (19) ED (14) LS (16) In (9) VP (18)
P (10) VP (7) Ve (14) EI (13) VP (10) P (15) In (14) AES (16) AII (16) AES (12) In (13) DZ (7) Te (15)
Proportion of intrinsic and extrinsic projections for each area. Intrinsic projections averaged 56% of the total cortical input to an area. The three principal extrinsic inputs often arose from other areas within the same group (tonotopic, nontonotopic, multisensory, and limbic), or from outside the group. 1 Auditory cortical area. 2 Average percent of total cortical input. 3 Average percent of extrinsic input.
tive belt regions. Bowman and Olsen (1988a) found a rostrocaudal organization in EP, in which the rostral strip of EP receives more auditory thalamic and cortical projections. In contrast, the caudal EP strip, whose inputs are furthest removed from auditory areas, resembles the monkey parabelt, which receives no cortical input from the core regions but, rather, is connected preferentially with the temporal and frontal lobes (Kaas and Hackett, 2000). Thus, many features of the core, belt, and parabelt organization are found in the cat, although precise areal homologies will require a more refined neuroanatomical, neurochemical, evolutionary, and developmental analysis. In this exposition, we preferred functional rather than territorial denominations since the former are indifferent to the location of particular areas with respect to one another.
ACKNOWLEDGMENTS We thank Drs. Christoph Schreiner and Kazuo Imaizumi for the physiological mapping and for their generosity in sharing data from these experiments, David Larue and Tania Bettis for their histological expertise, and Dawn Sung, Richard Lee, Kristen Adams, Haleh Badakoobehi, and Esther Yoon for assistance with plotting.
LITERATURE CITED Bizley JK, Nodal FR, Nelken I, King AJ. 2005. Functional organization of ferret auditory cortex. Cereb Cortex 15:1637–1653. Bowman EM, Olson CR. 1988a. Visual and auditory association areas of the cat’s posterior ectosylvian gyrus: cortical afferents. J Comp Neurol 272:30 – 42. Bowman EM, Olson CR. 1988b. Visual and auditory association areas of the cat’s posterior ectosylvian gyrus: thalamic afferents. J Comp Neurol 272:15–29. Brett-Green B, Fifkova´ E, Larue DT, Winer JA, Barth DS. 2003. A multisensory zone in rat parietotemporal cortex: intra- and extracellular physiology and thalamocortical connections. J Comp Neurol 460:223– 237. Budinger E, Heil P, Scheich H. 2000. Functional organization of auditory cortex in the Mongolian gerbil (Meriones unguiculatus). IV. Connec-
tions with anatomically characterized subcortical structures. Eur J Neurosci 12:2452–2474. Bullier J. 1984. Axonal bifurcation in the afferents to cortical areas of the visual system. In: Pettigrew JD, Sanderson KJ, Levick WR, editors. Visual neuroscience. London: Cambridge University Press. p 239 –259. Clarey JC, Irvine DRF. 1990a. The anterior ectosylvian sulcal auditory field in the cat: I. An electrophysiological study of its relation to surrounding auditory cortical fields. J Comp Neurol 301:289 –303. Clarey JC, Irvine DRF. 1990b. The anterior ectosylvian sulcal auditory field in the cat: II. A horseradish peroxidase study of its thalamic and cortical connections. J Comp Neurol 301:304 –324. Clasca´ F, Llamas A, Reinoso-Sua´rez F. 1997. Insular cortex and neighboring fields in the cat: a redefinition based on cortical microarchitecture and connections with the thalamus. J Comp Neurol 384:456 – 482. Clasca´ F, Llamas A, Reinoso-Sua´rez F. 2000. Cortical connections of the insular and adjacent parieto-temporal fields in the cat. Cereb Cortex 10:371–399. Colavita F. 1979. Temporal pattern discrimination in cats with insulartemporal lesions. Physiol Behav 18:513–521. de la Mothe LA, Blumell S, Kajikawa Y, Hackett TA. 2006. Thalamic connections of the auditory cortex in marmoset monkeys: core and medial belt regions. J Comp Neurol 496:72–96. Doron NN, LeDoux JE, Semple MN. 2002. Redefining the tonotopic core of rat auditory cortex: physiological evidence for a posterior field. J Comp Neurol 453:345–360. Fitzpatrick DC, Olsen JF, Suga N. 1998. Connections among functional areas in the mustached bat auditory cortex. J Comp Neurol 391:366 – 396. Hackett TA, Stepniewska I, Kaas JH. 1998. Thalamocortical connections of the parabelt auditory cortex in macaque monkeys. J Comp Neurol 400:271–286. He J, Hashikawa T, Ojima H, Kinouchi Y. 1997. Temporal integration and duration tuning in the dorsal zone of cat auditory cortex. J Neurosci 17:2615–2625. Imig TJ, Reale RA. 1980. Patterns of cortico-cortical connections related to tonotopic maps in cat auditory cortex. J Comp Neurol 192:293–332. Imaizumi K, Priebe NJ, Crum PAC, Bedenbaugh PH, Cheung SW, Schreiner CE. 2004. Modular functional organization of cat anterior auditory field. J Neurophysiol 92:444 – 457. Izumi M, Nakamura Y. 1998. The organization of ipsilateral corticocortical projections of the middle sylvian gyrus (AII) in the cat cerebral cortex: an anterograde and retrograde tracing study. Brain Res Bull 47:141– 149. Kaas JH, Hackett TA. 2000. Subdivisions of auditory cortex and processing streams in primates. Proc Natl Acad Sci U S A 97:11793–11799. Lee CC, Winer JA. 2005. Principles governing auditory cortex connections. Cereb Cortex 15:1804 –1814. Lee CC, Winer JA. 2008a. Connections of cat auditory cortex: I. Thalamocortical system. J Comp Neurol 507:1879 –1900. Lee CC, Winer JA. 2008b. Connections of cat auditory cortex: II. Commissural system. J Comp Neurol 507:1901–1919. Lee CC, Imaizumi K, Schreiner CE, Winer JA. 2004a. Concurrent tonotopic processing streams in auditory cortex. Cereb Cortex 14:441– 451. Lee CC, Schreiner CE, Imaizumi K, Winer JA. 2004b. Tonotopic and heterotopic projection systems in physiologically defined auditory cortex. Neuroscience 128:871– 887. Loftus WC, Sutter ML. 2001. Spectrotemporal organization of excitatory and inhibitory receptive fields of cat posterior auditory field neurons. J Neurophysiol 86:475– 491. Meredith MA, Keniston LR, Dehner LR, Clemo HR. 2006. Crossmodal projections from somatosensory area SIV to the anterior ectosylvian sulcus (FAES) in cat: further evidence for subthreshold forms of multisensory processing. Exp Brain Res 172:472– 484. Merzenich MM, Knight PL, Roth GL. 1973. Cochleotopic organization of primary auditory cortex in the cat. Brain Res 63:343–346. Ojima H, Takayanagi M. 2004. Cortical convergence from different frequency domains in the cat primary auditory cortex. Neuroscience 126: 203–212. Reale RA, Imig TJ. 1980. Tonotopic organization in auditory cortex of the cat. J Comp Neurol 182:265–291. Rouiller EM, Simm GM, Villa AEP, de Ribaupierre Y, de Ribaupierre F. 1991. Auditory corticocortical interconnections in the cat: evidence for
The Journal of Comparative Neurology
CORTICOCORTICAL CONNECTIONS OF AUDITORY CORTEX parallel and hierarchical arrangement of the auditory cortical areas. Exp Brain Res 86:483–505. Schreiner CE, Cynader MS. 1984. Basic functional organization of second auditory cortical field (AII) of the cat. J Neurophysiol 51:1284 –1305. Schreiner CE, Winer JA. 2007. Auditory cortex mapmaking: principles, projections, and plasticity. Neuron 56:356 –365. Shinonaga Y, Takada M, Mizuno N. 1994. Direct projections from the non-laminated divisions of the medial geniculate nucleus to the temporal polar cortex and amygdala in the cat. J Comp Neurol 340:405– 426.
1943
Stiebler I, Neulist R, Fichtel I, Ehret G. 1997. The auditory cortex of the house mouse: left-right differences, tonotopic organization and quantitative analysis of frequency representation. J Comp Physiol [A] 181: 559 –571. Winer JA, Lee CC. 2007. The distributed auditory cortex. Hear Res 229: 3–13. Woolsey CN. 1960. Organization of cortical auditory system: a review and synthesis. In: Rasmussen GL, Windle WF, editors. Neural mechanisms of the auditory and vestibular systems. Springfield, IL: Charles C Thomas. p 165–180.