MATEC Web of Conferences 115, 02011 (2017)
DOI: 10.1051/ matecconf/20171150201 1
STS-33
Effect of blowing/suction through porous surfaces on boundary layer at supersonic Mach numbers Pavel Polivanov1,* 1
Khristianovich Institute of Theoretical and Applied Mechanics SB RAS 630090, Institutskaya, 4/1, Novosibirsk, Russia
Abstract. The effect of blowing/suction through perforated surfaces on the turbulent boundary layer was studied experimentally at Mach number M = 1.4. In the experiments, several different porous surfaces were investigated in a wide range of the blowing/suction mass flow rate. The distributions of the integral parameters of boundary layer were obtained depending on the type of porosity and mass flow rate. The integral effect from shock waves on boundary layer depends on set of parameters, which makes search of optimal parameters of porosity difficult.
1 Introduction Blowing/suction of the gas through the porous surface can be used for various applications, e.g., the laminarization of transonic airfoil and control of flow separation, wall cooling or injection of fuel etc. Many experimental and theoretical studies investigated the effect of blowing/suction through porous surfaces, but mostly for subsonic speeds [1]. Studies performed at Mach numbers M> 1 are usually more complex, so they are rarer and more difficult to systematized. For example in paper [2] the blowing/suction through porous surfaces was used to control of separation flows, but a detailed analysis of the effect of porosity geometry was not performed. In paper [3] the dimensionless dependences of mass flow rate through a porous surface for a wide range of diferent parameters were found. But the absence the data of the effect of the porous geometry on the boundary layers makes compicate the design of optimal control devices for supersonic cases. Modern numerical methods (LES/DNS) allow calculating such flows [4], but they require a lot of computational time. RANS methods are more accessible but require data for verification. It was decided to perform a parametric study of the effect of gas blowing or suction on the supersonic boundary layer, developed on the plate for different porous geometries.
2 Experimental setup and results The experiments were performed in wind tunnel T-327b (ITAM SB RAS) for Mach number M∞ = 1.4, T0 = 298 K and P0 = 1.01105 Pa (Re1 = 15.1106 m-1). The width of wind *
Corresponding author:
[email protected]
© The Authors, published by EDP Sciences. This is an open access article distributed under the terms of the Creative Commons Attribution License 4.0 (http://creativecommons.org/licenses/by/4.0/).
MATEC Web of Conferences 115, 02011 (2017)
DOI: 10.1051/ matecconf/20171150201 1
STS-33
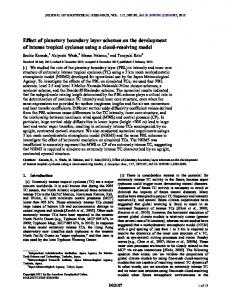
tunnel test section is 57 mm, the length is 370 mm, and to compensate the growth of the boundary layer thickness the height of the working part increases from 19 up to 23 mm. The main measurement technique was PIV. The random error of velocity vector measurements was no greater than 1–2%. The porous insert is placed on the wall in the zone of turbulent boundary layer (Fig. 1). CFD RANS (Reynolds-averaged Navier-Stokes) simulation allow to accelerate the process of designing of flow control devices. But for the correct choice of parameters of the semi-empirical turbulent model the experimental data with simplified geometry are required for verification. To simplify the geometry of porous inserts it was decided to use perforated plates with different geometry. The parameters of the porous insert can be found in Table 1, where d is the diameter of the hole, h is the distance between the holes, and E is the angle between the normal to the surface and the axis of the hole. For each perforated surface the flow characteristics were measured at the following fixed mass flow rate of blowing/suction: 3.23, -1.91, -1.21, -0.56, -0.26, 0, 0.26, 0.56, 1.21, 1.91 g/s (sign "-" corresponds to the suction). The maximum mass flow rate was chosen so that for the insert #1 (with a min. total hole area), the velocity of flow through the holes was about the speed of sound. The wind tunnel mass flow rate was |210 g/s.
Fig. 1. The draft and photo of wind tunnel Table 1. Parameters of porous surface #
d, mm
h, mm
Number of holes
Total square of holes, mm2
Angle of deviation from the normal
Open area
1
0.8
3.2
9x9
40.7
E=0q
0.05
2
0.8
2.4
11x11
60.8
E=0q
0.09
3
0.8
1.9
14x14
98.5
E=0q
0.14
4
0.8
1.6
16x16
128.7
E=0q
0.20
5
1.0
2.0
14x14
153.9
E=0q
0.20
6
1.4
2.8
10x10
153.9
E=0q
0.20
7
2.0
4.0
7x7
153.9
E=0q
0.20
8, 9
1.0
2.0
14x13
147.9
E=15q (blowing in the reverse and direction of flow)
0.20
Figure 2 shows the velocity fields for the porous insert #4. For a zero mass flow rate, the thickness of the turbulent boundary layer is 3 mm (velocity distribution corresponds to equilibrium turbulence) and almost does not change in the zone of measurement. Blowing leads to an increase in the boundary layer thickness and significant reduces the fullness of boundary layer. The non-uniformity of the flow in the zone of inviscid flow appears, and the flow velocity in the wind tunnel decreases. The reason for this is the shock wave, generated at the leading edge of the porous surface due to the growing displacement
2
MATEC Web of Conferences 115, 02011 (2017)
DOI: 10.1051/ matecconf/20171150201 1
STS-33
thickness. Suction, on the contrary, leads to an acceleration of the flow. In the zone of porous surface there are periodic wavy structures with a period corresponding to a distance between the holes. Wavelike nature of displacement thickness leads to the generation of periodic compression-expansion waves, which can significantly change the flow pattern. One may clearly see the increase of non-uniformity of the mean flow with an increase in the size of the holes (Figure 3, porous insert #7) as compared with the porous insert # 4. For suction, this is explained by a more rapid change of the boundary layer thickness near the holes. This leads to the generation of more powerful compression waves (which generate shock waves) and expansion waves. But for the case of blowing, no periodic structures are found. This can be explained by the increase of the "head" shock wave arising near the beginning of porous surface.
Fig. 2. Velocity fields for case #4, left – blowing at 1.91 g/s, right – suction 1.91 g/s
Fig. 3. Velocity fields (case #7) , left – blowing at 1.91 g/s, right – suction 1.91 g/s (Near the coordinate X = 200 mm the perforated part is ends) 10
10
400
80 8
350
Y, mm
Y, mm
8 6
300 4
60
6 4
40
2
20
250 2 200 -3
a)
-2
-1 0 R, g/s
1
-3
b)
-2
-1 0 R, g/s
1
Fig. 4. Distribution of a) mean velocity profiles [m/s] and b) RMS pulsation of velocity [m/s] for various mass flow rate through a porous surface for case #4 at X=215 mm
In Figure 4a one may see the distribution of the velocity profile for porous insert #4 measured behind the porous insert. There is a monotonous variation of the boundary layer thickness with the growing mass flow rate. It is interesting to note that the distribution of pulsations the monotonicity of the data is not maintained especially in the point of zero mass flow rate (Figure 4b). The blowing and suction lead to an increase of pulsations which means that the turbulent boundary layer becomes nonequilibrium behind the porous insert. This should be taken into account when designing devices using a distributed blowing/suction.
3
MATEC Web of Conferences 115, 02011 (2017)
DOI: 10.1051/ matecconf/20171150201 1
STS-33
Figure 5 shows the distribution of the momentum thickness for all porous surfaces and entire range of mass flow rate through it. The numbering of porous surfaces is selected so that from #1 up to #4 (Table 1) the open areas grow at fixed of diameter of holes. Further from #4 to #7 the hole diameter is increased at a constant value of the open area of porous surface. Case #8 and #9 show the influence of the slope of holes on the parameters of the boundary layer. It is clearly seen that for each porous surface the distribution of momentum thickness is approximately monotonic. But at constant mass flow rate, a variation of one of the porosity parameters demonstrated a significant non-monotonicity of the momentum thickness, which is strongly dependent on the mass flow rate. For example, at strong suction and when the open area is varied (#1-#4) the minimum momentum thickness was found for case #2. This can be explained by the effect of several phenomena on the strength of shock waves, generated near the holes. At low mass flow rate the most important is the size of the holes. But an increase of the mass flow rate leads to a significant distortion of the local flow, which should lead to increased strength of the shock wave. 9
9 0.55
8
0.45
#porous surf.
#porous surf.
7
6 0.4 5 0.35 4 0.3 3
1
-2
-1 0 R, g/s
5
0.4
4 0.3
2
0.2 -3
0.5
6
3
0.25
2
0.6
8
0.5
7
1
1
X=192 mm
0.2 -3
-2
-1 0 R, g/s
1
X=215.5 mm
Fig. 5. Distribution of the momentum thickness [mm] for all cases of porosities at various mass flow rate through a porous surface
An experimental study has shown that distributions of integral parameters of the boundary layer for blowing/suction through porous surfaces are non-monotonic. This substantially complicates determination of empirical dependencies. The use of dimensionless data did not allow finding some regularity. The results of the work demonstrate the complexity of the problem, which means that additional experimental and numerical research is needed. The work was supported by the Grant of President of the Russian Federation for State support of young Russian scientist – Candidate of sciences No Mk- 6682.2016.1.
References 1. V.I. Kornilov, Progress in Aerospace Sciences 76 1 (2015) 2. Drag Reduction by Shock and Boundary Layer Control: Results of the Project EUROSHOCK II / ed. Egon Stanewsky. Springer-Verlag Berlin Heidelberg. (2002). 3. R.A. Baurle, A.T. Norris, A Source-Term Based Boundary Layer Bleed/Effusion Model for Passive Shock Control. 58th JANNAF Propulsion Meeting, Arlington, VA, USA, P.1-26 (2011). 4. S. Ghosh, J.-I. Choi, J.R. Edwards, AIAA Paper 2009-1330 (2009).
4