IEEE TRANSACTIONS ON RELIABILITY, VOL. 50, NO. 2, JUNE 2001
165
Effect of Code Coverage on Software Reliability Measurement Mei-Hwa Chen, Michael R. Lyu, Senior Member, IEEE, and W. Eric Wong
Abstract—Summary & Conclusions—Existing software reliability-growth models often over-estimate the reliability of a given program. Empirical studies suggest that the over-estimations exist because the models do not account for the nature of the testing. Every testing technique has a limit to its ability to reveal faults in a given system. Thus, as testing continues in its region of saturation, no more faults are discovered and inaccurate reliability-growth phenomena are predicted from the models. This paper presents a technique intended to solve this Problem, using both time & code coverage measures for the prediction of software failures in operation. Coverage information collected during testing is used only to consider the effective portion of the test data. Execution time between test cases, which neither increases code coverage nor causes a failure, is reduced by a parameterized factor. Experiments were conducted to evaluate this technique, on a program created in a simulated environment with simulated faults, and on two industrial systems that contained tenths of ordinary faults. Two well-known reliability models, Goel-Okumoto and Musa-Okumoto, were applied to both the raw data and to the data adjusted using this technique. Results show that overestimation of reliability is properly corrected in the cases studied. This new approach has potential, not only to achieve more accurate applications of software reliability models, but to reveal effective ways of conducting software testing. Index Terms—Coverage measures, software reliability estimation, software testing.
cumulative test-time after executing cumulative failures after executing cumulative block coverage after executing : data collected after executing processed , using the coverage adjustment
, if otherwise
number of test cases compression ratio for parallel (for vectors) ASSUMPTIONS 1) All times are CPU time. 2) Times between failures are -independent. 3) All inputs are generated using a pre-defined operational profile, for both testing and reliability measurement phases. 4) No new faults are introduced during debugging. 5) Fault repair is instantaneous: as soon as a failure is observed. 6) Each failure is caused by a single fault.
ACRONYMS1 SRGM G-O M-O G-O M-O
software reliability growth model Goel-Okumoto NHPP model Musa-Okumoto logarithmic Poisson model G-O using adjusted data M-O using adjusted data random flow graph generated for the simulation experiment application program NOTATION test case
Manuscript received May 16, 1997; revised May 24, 2000. The work in this paper was partially supported by a grant from the Research Grants Council of the Hong Kong Special Administrative Region (Project no. CUHK4193/00E), and partially supported by France/Hong Kong Joint Research Scheme. Responsible Editor: M.A. Vouk Mei-Hwa Chen is with the Dept. of Computer Science, SUNY Albany, Albany, NY 12222 USA (e-mail:
[email protected]). Michael R. Lyu is with the Computer Science & Engineering Dept., The Chinese Univ. of Hong Kong, Shatin, Hong Kong (e-mail:
[email protected]). W. Eric Wong is with the Telcordia Technologies, Morristown, NJ 07960 USA (e-mail:
[email protected]). Publisher Item Identifier S 0018-9529(01)09552-5. 1The
singular & plural of an acronym are always spelled the same.
I. INTRODUCTION
T
HE reliability of a program is often defined as the probability that the program does not fail in a given environment, during a specified exposure time interval [13]. Since the late 1960s, several analytic models have been proposed for software reliability estimation [16]. The time-domain models, also called SRGM, have been the most popular as well as most widely studied for the past two decades. These models use the failure history, obtained during testing, to predict the field behavior of the program, under the assumption that testing is performed in accordance with a given operational profile [9]. However, there are some fundamental difficulties with this approach, e.g., the saturation effect of the testing process [3], and the difficulty in obtaining an actual operational profile. To cope with this, sensitivity analyzes of usage profile have to be provided for appropriate test-case selection and accurate reliability assessment [19]. Our observations, from both empirical & analytic studies, show that predictions made by the SRGM tend to be too optimistic [3], [6]. Many attempts have been made to improve the SRGM estimation. Some propose that the test data must be pre-processed before they can be used by the SRGM [3], [8], [11], [17]. Others postulate that coverage information should
0018-9529/01$10.00 © 2001 IEEE
166
IEEE TRANSACTIONS ON RELIABILITY, VOL. 50, NO. 2, JUNE 2001
be used, instead of test time, to overcome the difficulty of obtaining an operational profile of the given program [12], [15], [18]. However, the relation between test-coverage and defectcoverage (and consequently the improvement of software reliability) can be very complex [1]. There is no formal description in the literature regarding how coverage information should be used in reliability measurement. This paper presents a technique that models the failure rate with respect to both code-coverage and test-time. The rationale behind this approach is given in this paragraph. When a program is tested successfully against a suite of test cases, the software might continue test, using the same or similar test suite, without any failures. If the time between failures is the only consideration in the reliability estimation process, then obviously, the program reliability might be overestimated, since in practice the operational profile can differ from that implied by the test suite. To overcome this problem, our technique uses code coverage to adjust the failure rate before it is applied to an SRGM. The time intervals between failures are adjusted for any testing effort that is redundant with respect to a chosen coverage criterion, e.g., repeating the same test cases, or not increasing block coverage with new test cases. We applied this approach to G-O [7] and M-O [14] and observed an improvement in the accurate estimation for both models. Section II describes the technique. Section III describes the experiments & results. Section IV discusses possible future directions.
II. METHODOLOGY The relationship between coverage and software-reliability has been studied by many researchers. Empirical studies show that fault-detectability -correlates with code coverage [20], [21]. Consequently, software reliability can also -correlate with code coverage [5]. This experimental evidence strengthens our belief that code-coverage information should be considered in reliability estimation. SRGM rely on time-dependent failure data. As testing proceeds, and faults are revealed, the test cases generated in the later phases are less likely to cause the program to fail than those generated in the earlier phases. Therefore, the time between failures increases, as do the reliability estimates made by the SRGM. However, the reliability of the software usually increases when the number of faults in the software is reduced. Therefore, the more redundant a testing effort is, the greater is the chance that reliability will be overestimated. To reduce these overestimates, one needs to determine which test cases are redundant and how much of the test effort is considered effective. In our model, the coverage information is used to determine the effectiveness of a given test effort. A test case that does not ‘increase coverage of the program’ and does not ‘cause a failure’ is considered noneffective. The execution time of such a test case is reduced by using a compression ratio which is based on both execution-time and code-coverage. Section II-A describes the method that applies coverage-information to extract the effective portion of the test data.
A. Coverage-Enhanced Data Processing Technique A
is considered to be noneffective if: and ; in other words, is noneffective if it neither increases the coverage nor causes the program to fail on execution. The vector describes the change in the number of failures with respect to test-time regardless of coverage (it is a discrete partial differential of failures with respect to time), while the vector describes the change in the number of failures with respect to coverage regardless of time (it is a discrete partial differential of failures with respect to coverage). We believe that both time & coverage are crucial factors in predicting failures; thus we combine them to extract the effective test efforts. is noneffective, the is reduced using . Therefore, If , is to be used the extracted execution time of by the SRGM. Appendix A derives . The remainder of this paragraph illustrates the approach. Let represent a noneffective test case : its execution has not increased either the coverage nor the number of failures observed. Let this triplet be projected onto the plane formed by the previous and the and . The two difference-vectors are orthogonal to each other and they indicate partial rates of change in failures with respect the two exposure parameters as they were . Together with the estimated after completion of test case triplet, they define a ‘no-coverage and no-failure test case change’ plane at that instance of testing. For a noneffective test case , the only actual change occurred in the direction of the ‘no-coverage time axis. Projecting this point onto the no-failure’ plane gives an idea of how far in this space we would have moved. Projecting this projected point onto the time axis gives the new or reduced exposure time. The ratio between the new and the reduced time is , the compression ratio. indicates the effective portion of the execution time The of , if is noneffective. This compression ratio differs from the compression factor, defined in [13], which is the ratio of execution time required in the operational phase to execution time required in the test phase to cover the input space of the program. Fig.1 depicts the geometrical interpretation of the projection, and are test data, where: are the compressed data. The adjusted data , , can be used by the SRGM, where is the adjusted execution time of . The computation of is: given: (1) then (2) (3) and given that (4) then if otherwise
(5)
CHEN et al.: EFFECT OF CODE COVERAGE ON SOFTWARE RELIABILITY MEASUREMENT
167
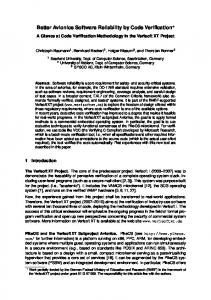
Fig. 2. Reliability observed, and reliability estimates from the G-O & M-O models for a flow-graph with 1000 nodes. Fig. 1.
Coverage-enhanced data-processing technique.
The projection process (Appendix A) yields: if
is effective
otherwise (6) & as shown in (6). The value of is computed from In practice, the and parameter values are usually scaled to get their numerical values in the range of interest to be of roughly the same magnitude. This numerically stabilizes computation of . The coverage measure is usually scaled to the range that is closest to the average execution time of one test case. The scaling can be adjusted at various phases of testing. The scaled values of are used in computing . In the reliability estimation, the raw values and the values are adjusted using the compression ratios. Scaling of the execution time does not affect the reliability estimation process. B. Simulation This section describes an experiment which was conducted under the simulation environment, T RSE [4]. M-O [13] & G-O [7] are models for reliability estimation. The procedure used in our study is listed here. Begin Procedure 1) Generate a program flow graph with 1000 nodes. 2) Annotate with faults by assigning fault infection probability and fault propagation probability to each node. 3) Test by using the random testing technique with respect to a uniform profile. Faults causing failures are removed during the debugging. 4) Apply the data collected in step 3 to SRGM and obtain reliability estimates. 5) Use the coverage-enhanced technique to exclude noneffective testing efforts in step 3; then apply such extracted failure data to the models for reliability estimation.
6) Compute reliability by simulating the execution of with respect to the same profile used in step 3. End Procedure Fig.2 shows the reliability estimates obtained by applying the original data to the G-O & M-O models, and by applying the extracted data to both models (G-O & M-O ). The estimates were compared with the reliability computed in step 6 (labeled ). The results show that at 270 000 units of test-time our technique reduces the overestimate of the G-O model from 0.23 (33.7%) to 0.00 (0.0%), M-O model from 0.083 (12.17%) to 0.004 (0.55%). Similarly, at test-time of 300 000 units, the overestimate is reduced from 0.205 (29.3%) to 0.02 (2.86%), and from 0.087 (12.4%) to 0.01 (1.43%), respectively, for the G-O and M-O models. The reliability overestimates made by G-O & M-O can be appreciably reduced by considering the effective testing efforts.
III. APPLICATIONS To demonstrate our technique in real applications, we conducted experiments on two programs: autopilot and orecolo. A. autopilot Project The autopilot project was developed by multiple independent teams at the University of Iowa and the Rockwell/Collins Avionics Division [10]. The application program is an ‘automatic flight control function for the landing of commercial airliners’ that has been implemented by the avionics industry. It has five redundant yet independently developed program versions for a total of 7000 lines of code (4200 executable statements) and 30 natural faults. 1) Testing and Debugging: Flight simulation testing of autopilot represents various execution scenarios in a feed-back loop, where different flight modes are entered & exercised. The sequence of testing & debugging is:
168
IEEE TRANSACTIONS ON RELIABILITY, VOL. 50, NO. 2, JUNE 2001
TABLE I RELIABILITY OBSERVED, AND RELIABILITY ESTIMATES FROM THE G-O & M-O MODELS FOR autopilot.
Fig. 3. Reliability observed, and reliability estimates from the G-O & M-O models for autopilot.
Sequence 1. Generate a test pool 2. Set the flag TEST REPEAT to false 3. If (TEST REPEAT is false) Then a. Select a test case
from
according to a
uniform distribution profile Else b. Re-use the test case
saved in 5d
End If against
4. Test the program 5. If (
fails on
)
Then a. Find the fault which is responsible for the failure b. Remove the fault detected in 5a c. Set the flag TEST REPEAT to true d. Save
for re-use in 3b
Else Set the flag TEST REPEAT to false End If 6. Go to 3
End Sequence An important characteristic of this testing & debugging process is that can be executed against the same more than once. For example, let the first execution of on fail at time . After the fault responsible for this failure is removed, . then is executed again on . Let it fail at time Because the simulation is not yet completed, is re-executed after debugging. This process continues until against succeeds on . 2) Reliability Estimation: Table I and Fig. 3 show the reliability estimates obtained by applying the original data, collected from the testing & debugging process in Section III-A1, and the adjusted data, processed by using the coverage-enhanced technique, to the G-O & M-O models. The exposure time used in the estimation process is the maximum flight time: 265 seconds. The reliability estimates obtained from the G-O & M-O models using the original data are labeled G-O and M-O, respectively.
Similarly, G-O and M-O denote the reliability estimates obtained from the G-O and the M-O models using the adjusted data. The , measured as the ratio of the number of successful executions to the total number of executions, were computed for the test-times of 5153.60, 6538.75, 8025.10 seconds. These 3 points represent 3 fault-correction activities in the 3 phases of the test. To estimate , the program was executed against inputs based on the same operational profile as used in the test process. The process of reliability measurement was repeated until the reliability measure converged to a 95% -confidence interval. In applying the coverage-enhanced technique, we used block coverage measurement. To compute the compression ratio, the coverage measure and the execution time were scaled by multiplying each of them by a constant factor. These constant scaling factors were set, beginning at the test-time 5153.60 seconds, the time when reliability measurement of our interest began. For the G-O, the differences between the reliability and its esto 0.45 ( % to 100.0%); with the timates ranged from to 0.38 coverage-enhanced technique, they ranged from % to 84.4%). For the M-O, these differences ranged from ( to 0.36 ( % to 80.0%); with the coverage-enhanced to 0.29 ( % to 64.4%). technique, they ranged from This study shows that by adjusting the testing efforts using the coverage-enhanced technique, the reliability estimates made by the SRGM are much closer to the actual reliability. However, the improvement of the two models is not as large as that obtained from the simulation experiment in Section II-B, because the reliability was compared in the later phase of the testing while there were very few faults remaining in the program. B. The orecolo Program The orecolo program, was developed for the European Space Agency, to provide a language-oriented user interface that allows the user to describe the configuration of an array of antennas by using a high level language [2]. The application consists of about 10 000 lines of code (6 100 executable lines) and 33 natural faults.
CHEN et al.: EFFECT OF CODE COVERAGE ON SOFTWARE RELIABILITY MEASUREMENT
TABLE II RELIABILITY OBSERVED, AND RELIABILITY ESTIMATES OBTAINED FROM THE G-O & M-O MODELS FOR orecolo.
Fig. 4. Reliability observed, and reliability estimates obtained from the G-O & M-O models for the orecolo project.
1) Testing and Debugging: Testing is performed by using the input generator, Copia, which produces input test cases based on a pre-defined operational profile. The output of the faulty program is compared with the output of the correct version. If they differ, the debugging process proceeds and the corresponding faults are removed. 2) Reliability Estimation: The results obtained from this experiment are in Table II and Fig.4. The execution unit is measured as the number of test cases, instead of the execution time, due to the nature of the application program. Similarly, the exposure time used in the estimation process is one test execution. The were computed at the completion of 132, 156, 230, and 599 test cases. Table III shows that, for G-O the differences between the reliability and its estimates ranged from 3.1% to 12.4%; for the coverage-enhanced technique, they ranged from 0.0% to 2.1%. For M-O, the differences ranged from 2.1% to 7.9%; for the cov% to 0.0%. At erage-enhanced technique, they ranged from the end of the testing process, overestimates made by G-O were reduced from 3.1% to 2.1%, and those made by M-O were reduced from 2.1% to 1.0%. The improvement of the estimation for orecolo was not as large as that for autopilot.
TABLE III RELIABILITY OVER-ESTIMATES OBTAINED FROM MODELS FOR orecolo.
THE
G-O & M-O
a better understanding of the software quality, and helps the developer conduct a more effective testing scheme. It indicates to the tester when: • a testing technique becomes ineffective and should be switched to another one, • to stop testing without overestimating the achieved reliability. Our experiments conducted by a simulated program and two real-world projects suggest the advantages of this technique. To investigate the relation between the ‘strength of the coverage criteria used’ and the ‘improvement of the estimation made by this technique’, we plan to apply stronger coverage measurements like ‘branch, all-uses, and mutation coverage’, for more empirical studies of this technique on industrial projects. While reliabilities measured by SRGM are somewhat insensitive to the fluctuations in the operational profiles, the actual reliabilities are sensitive, and our technique captures such a phenomenon. We plan to formulate this relationship quantitatively by a sensitivity study. We also hope to establish the criteria that will meet a reliability threshold specified for an ultra high reliable software system by applying this technique to avoid redundant test efforts. APPENDIX Assuming Plane
is formed by
Point Vector
(A-1) Let the projection of Point
on
be
Then, (A-2) (A-3)
IV. FUTURE PLANS Our technique measures test-coverage in the estimation of software reliability. This technique appears to improve the applicability & accuracy of G-O & M-O. This should give the user
169
Given (A-3) , then (A-4)
170
IEEE TRANSACTIONS ON RELIABILITY, VOL. 50, NO. 2, JUNE 2001
Given
then (A-5) Given (A-2) & (A-5) then (A-6) From (A-6), the compression ratio is computed:
(A-7) ACKNOWLEDGMENT The model proposed in this paper was initially developed while Dr. Chen was a Ph.D. student at Purdure University under the supervision of Dr. Mathur & Dr. Rego. The concept of using coverage to enhance reliability measurement was originated from these supervisors’ research. Due to the limitation on the listed number of authors, we did not include them as coauthors. We are especially pleased to thank them here for their valuable contributions to this work. We are also pleased to thank Dr. J. R. Horgan at Telcordia Technologies for his valuable comments on this work, and Dr. A. Pasquini for providing the orecolo program. We are pleased to thank Dr. M. Vouk for many constructive suggestions in making this paper more precise & readable. REFERENCES [1] L. Briand and D. Pfahl, “Using simulation for assessing the real impact of test coverage on defect coverage,” Proc. 10th IEEE Int’l. Symp. Software Reliability Engineering, pp. 124–157, Nov. 1999. [2] A. Cancellieri and A. Giorgi, “Array Preprocessor User Manual,” IDS, Technical Report IDS-RT94/052, 1994. [3] M. H. Chen, J. R. Horgan, A. P. Mathur, and V. J. Rego, “A Time/Structure Based Model for Estimating Software Reliability,” Purdue Univ., Technical Report SERC-TR-117-P, July 1992. [4] M. H. Chen, M. K. Jones, A. P. Mathur, and V. J. Rego, “TE RSE: A tool for evaluating software reliability estimation,” in Proc. 4th Int’l. Symp. Software Reliability Engineering, 1993, pp. 274–283. [5] M. H. Chen, M. R. Lyu, and E. Wong, “An empirical study of the correlation between code coverage and reliability estimation,” Proc. IEEE METRICS’96, pp. 133–141, Mar. 1996. [6] M. H. Chen, A. P. Mathur, and V. J. Rego, “Effect of testing techniques on software reliability estimates obtained using time-domain models,” IEEE Trans. Reliability, vol. 44, no. 1, pp. 97–103, Mar. 1995. [7] A. L. Goel and K. Okumoto, “Time-dependent error-detection rate model for software reliability and other performance measures,” IEEE Trans. Reliability, vol. R-28, no. 3, pp. 206–211, 1979. [8] N. Li and Y. K. Malayia, “Enhancing accuracy of software reliability prediction,” in Proc. 4th Int’l. Symp. Software Reliability Engineering, 1993, pp. 71–79. [9] Handbook of Software Reliability Engineering, M. R. Lyu, Ed., McGraw-Hill and IEEE Computer Society Press, 1996. [10] M. R. Lyu and Y. He, “Improving the -version programming process through the evolution of a design paradigm,” IEEE Trans. Reliability, vol. 42, no. 2, pp. 179–189, June 1993. [11] M. R. Lyu and A. Nikora, “Applying reliability models more effectively,” IEEE Software, pp. 43–52, July 1992.
N
[12] Y. K. Malayia, N. Li, and J. Bieman et al., “The relationship between test coverage and reliability,” in Proc. 5th Int’l. Symp. Software Reliability Engineering, 1994, pp. 186–195. [13] J. D. Musa, A. Iannino, and K. Okumoto, Software Reliability: Measurement, Prediction, Application: McGraw-Hill, 1987. [14] J. D. Musa and K. Okumoto, “A logarithmic Poisson execution-time model for software reliability measurement,” in Proc. 7th Int’l. Conf. Software Engineering, 1984, pp. 230–238. [15] P. Piwowarski, M. Ohba, and J. Caruso, “Coverage measurement experience during function test,” in Proc. 15th Int’l. Conf. Software Engineering, 1993, pp. 287–300. [16] C. V. Ramamoorthy and F. B. Bastani, “Software reliability—Status and perspectives,” IEEE Trans. Software Engineering, vol. SE-8, no. 4, pp. 354–371, 1982. [17] N. F. Schneidewind, “Optimal selection of failure data for predicting failure counts,” in Proc. 4th Int’l. Symp. Software Reliability Engineering, 1993, pp. 142–149. [18] M. A. Vouk, “Using reliability models during testing with nonoperational profile,” in Proc. 2nd Bellcore/Purdue Symp. Issues in Software Reliability Estimation, 1993, pp. 103–110. [19] A. Wesslen, P. Runeson, and B. Regnell, “Assessing the sensitivity to usage profile changes in test planning,” in Proc. 11th Int’l. Symp. Software Reliability Engineering, 2000, pp. 317–326. [20] W. E. Wong, J. R. Horgan, S. London, and A. P. Mathur, “Effect of test set size and block coverage on fault detection effectiveness,” Proc. 5th IEEE Int’l. Symp. Software Reliability Engineering, pp. 230–238, Nov. 1994. , “Effect of test set minimization on fault detection effectiveness,” [21] Software-Practice and Experience, vol. 28, no. 4, pp. 347–369, Apr. 1998.
Mei-Hwa Chen is an Associate Professor of Computer Science at SUNY Albany. Her research interests include software reliability modeling, software architecture, design metrics, software testing, and component-based software engineering. Dr. Chen is a member of the IEEE and the Association of Computing Machinery.
Michael R. Lyu received the B.S. (1981) in electrical engineering from the National Taiwan University, the M.S. (1985) in computer engineering from the University of California, Santa Barbara, and Ph.D. (1988) in computer science from University of California, Los Angeles. He is an Associate Professor at the Computer Science & Engineering Dept. of the Chinese University of Hong Kong. He worked at the Jet Propulsion Laboratory, Bellcore (now Telcordia) and Bell Labs, and taught at the University of Iowa. His current research interests include software reliability engineering, distributed systems, fault-tolerant computing, web technologies, web-based multimedia systems, and wireless communications. He has published over 100 refereed journal & conference papers in these areas. Dr. Lyu initiated (1990) the first Intl. Symposium on Software Reliability Engineering (ISSRE). He was the program chair for ISSRE’1996, PRDC’1999, and WWW10, and has served on program committees for numerous international conferences, including ISSRE, SRDS, HASE, ICECCS, ISIT, FTCS, ICDSN, EUROMICRO, APSEC, PRDC, PSAM, and ICCCN. He also serves as General Chair for ISSRE’2001. He is the editor for two books: Software Fault Tolerance, 1995, published by Wiley, and the Handbook of Software Reliability Engineering, 1996, published by IEEE & McGraw-Hill. He is on the editorial board for IEEE Trans. Knowledge & Data Engineering, IEEE Trans. Reliability, and J. Information Science & Engineering.
W. Eric Wong is a Senior Research Scientist in Applied Research at Telcordia Technologies. He received his B.S. in computer science from Eastern Michigan University, and his M.S. and Ph.D. in computer science from Purdue University. His primary research interests involve creating technologies for programand architecture-based assessment and diagnosis to reduce the cost of software production and improving software dependability, reliability as well as quality at the same time. He is also a principal investigator at Telcordia responsible for developing a set of metrics for evaluating the overall quality of highly complex telecommunication systems. In 1997, Dr. Wong received the Quality Assurance Special Achievement Award from Johnson Space Center, NASA.