Original Article
International Journal of Food, Nutrition and Dietetics 15 Volume 4 Number 1, January - April 2016 http://dx.doi.org/10.21088/ijfnd.2322.0775.4116.3
Effect of Different Pre-Processing Methods on the Extruded Products and Its Resultant Effect on Nutritional Properties and Health
Shivani Gupta*, S. Nikhil Gupta**, Naveen Gupta*** Abstract The study concludes that the buckwheat flour had high antinutritional properties (TPC & TFC) while white sorghum flour had high functional properties (WHC, WAI & WSI). Various processings like puffing, drying and roasting results in decreasing antinutritonal properties while increasing functional properties in all the three flours. It also concluded in the case of Red sorghum flour, different treatments results in decreasing the moisture and ash content. It has been observed that due to puffing there is increase in functional properties of product of red and white sorghum as compared to flour. In case of buckwheat product due to all the three treatments (puffing, drying and roasting) there is increase in functional properties and decreases in anti-nutritional properties as compare to flour. Roasting plays key role in product development of all the three flours as roasting results in increase in WAI & WHC, but decreases the anti-nutritional properties like TPC and TFC. In the physical properties, buck wheat product has high bulk density. In the white and red sorghum there is increase in expansion ratio due to roasting and drying respectively. Keywords: Antinutritonal Properties; Extrusion; Porosity; Proteins; Lahaul and Spiti.
Introduction India is the one of the leading countries worldwide, blessed with rich and diverse heritage of cultural traditions and wealth of tradition knowledge system of plant species (Pant et al; 2009). Himalaya has great wealth of medicinal plants and traditional knowledge (Rawat et al; 2010). One of such vegetable plant Buckwheat (Fagopyrum esculentum, Moench), an herbaceous plant of the polygonaceae family adapted to high elevations and short growing season where as if we look about Sorghum (Sorghum bicolor), it contributes to the food security of many of the world’s poorest most food insecure agro –ecological zones (FAO and ICRISAT,1996). Author’s Affiliation: *B.Tech (Food Tech), MBA (P), LM Thapar University, Dera Bassi-Panjab, **District AIDS Program Officer, Chief Medical Officer Office, Department of Health and Family Welfare, Kangra at Dharamshala-Himachal Pradesh, India. ***Freelance researcher in Epidemiology and Ayurveda, Kangra, Himachal Pradesh, India. Corresponding Author: Dr. S. Nikhil Gupta, District AIDS Program Officer, Chief Medical Officer office, Department of Health and Family Welfare, Kangra at Dharamshala-Himachal Pradesh, India. E-mail:
[email protected]
Area of Cultivation Sorghum is fifth most important cereal crop grown in the world and important food crop in South Asia, Central America and Africa. Nigeria is the world largest producer of grain sorghum (ICRISAT, 2007). The main producers of Buck wheat are China, Russian6 Federations, Ukraine and Kazakhstan (Li and Zhang, 2001; Bonafaccia et al, 2003). Two buckwheat speciesare commonly cultivated: common buckwheat (F.esculentum) and tartary buckwheat (F. tartaricum)(Krkoskova and Mrazova, 2005). Physico-Chemical Properties Sorghum is rich in thiamine, riboflavin, niacin and trace minerals such as iron, phosphorus and potassium. The colour of sorghum varies from white to red to black, and the bran of dark-coloured varieties is rich in compounds called phenolic acids, tannins, anthocyanins and policosanols (USDA,2007), whereas buck wheat is rich in anti oxidant such as tocopherols, reduced glutathione, inositol phosphates and melatonin (Zielinski et al. 2006). Among various flavonoids, rutin is reported to be the most abundant one in buckwheat seeds (Kreft et al, 1999) and is recognized as the most health protective and has also
International of Food, and Dietetics / Volume 4 Number 1/ January - April 2016 © Red FlowerJournal Publication Pvt.Nutrition Ltd.
16
Shivani Gupta et. al. / Effect of Different Pre-Processing Methods on the Extruded Products and Its Resultant Effect on Nutritional Properties and Health
been proven to be anti-inflammatory and anticarcinogenic (Peng et al,2008). Both buck wheat and sorghum are gluten free, thus they provide an important alternative nutritious food for people with celiac disease, (Alvarez-Jubete, Arendt and Gallagher, 2009). Buck wheat can be added to various food products as a supplement to extend and broaden its consumption, to provide beneficial health effects and to prevent food from oxidizing during processing (Dietrych- Szostak, 1999). Nutritional Composition Sorghum is a good source of fibre, mainly the insoluble (86.2%) fibre. The insoluble dietary fibre of sorghum may decrease transit time and prevent gastrointestinal problems, The protein content of sorghum is usually 11-13% but sometimes higher values are reported (David A.V. Dendy, 1995). Prolamins (kafirins) constitute the major protein fractions in sorghum. Sorghum is an important source of B vitamins except B 12, and good source of tocopherols. Sorghum is grown from traditional hybrid seeds and does not contain biotechnology traits, making it non-transgenic or non-GMO, in case of buck wheat the protein content of buckwheat grains has been reported to range from 12% to 18.9%, the starch content of the buck wheat varies from 59% to 70%, fluctuations may occur at the time of variable climatic and cultivation conditions (Qian and Kuhn, 1999). Buckwheat grains contain from 1.5% to 4% of total lipids (Steadman et al. 2001). Extruded Products Extrusion cooking is used worldwide for the production of expanded snack foods, modified
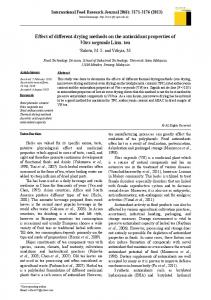
starches, ready to eat cereal foods, pet foods and porridge (Smith, 1996; Pelembe, 2002; Jeff, 2012). This unit operation consists of converting biopolymerbased raw materials into viscoelasticmelts, that is, the transport mechanism through the extruder changes along the screw from solid flow to fluid flow. As a consequence of the pressure built up during fluid flow, high shear stresses are developed, which cause structural transformations in the material. Starch dextrinization (Gomez, 1984) and amylopectin breakdown due to mechanical shear (Davidson, 1984) have been observed during low moisture, high shear single screwextrusion. Starch solubilisation (Mercier, 1975; Sopade, 2010) macromolecular degradation of amylose and amylopectin (Colonna, 1983) and reduction of high molecular weight polysaccharide (Wen, 1990) were reported during twin screw extrusion. The extrusion cooking was carried out using Brabender Single Screw Extruder (Model No. 823500, Germany), having a screw with a compression ratio of 2:1 and L/D ratio of 20:1. The samples were ground to coarse size and were subjected to conditioning by addition of water to obtain desired moisture equilibrium in feed material. The processing conditions like feed moisture, die temperature, screw rpm and feed rate were varied over five levels. The feed moisture was varied from 12% to 16%, die temperature from 150 °C to 190 °C, screw speed from 150 to 210 rpm and feed rate from 50 to 70 g min-1. Finally, the extrudate were dried for a period of 2 h at 50 °C to the desired moisture content of 4% and the effect of these conditions on physical properties of extrudate were determined. Extrusion Manufacturing Process of Extruded Products The extrusion-cooking of cereal-based products has been extensively studied during the last three decades.Product quality can vary considerably
International Journal of Food, Nutrition and Dietetics / Volume 4 Number 1/ January - April 2016
Shivani Gupta et. al. / Effect of Different Pre-Processing Methods on the Extruded Products and Its Resultant Effect on Nutritional Properties and Health
Pre-mixing
Ingredient storage
Secondary Proportioning
Ingredient Feeding
17
Extrusion
Coating
Drying
Packaging
depending on the extruder type, screw configuration, feed moisture and temperature profile in the barrel section, screw speed and feed rate (Fletcher, 1985). Various studies have been done on the extrusion of corn, rice, wheat, barley, amaranth, chick pea, and their combinations. But our idea is to explore the utilization of uncommon cereal for the development of extruded snacks as per following ways.
moisture equilibrium in feed material. The processing conditions like feed moisture, die temperature, screw rpm and feed rate were set to optimum. The extruded product were come out at die end and cut into small pieces. The prepared product was dried in hot air oven at 60oC for 15 min. Then packed in airtight bags and place in cool and dry place for further analysis Analysis of Flour and Extruded Products
The Objective of this Research is 1.
To explore the possibilities of sorghum (red and white) and buckwheat grain for the development of extruded products.
2.
To study the effect of extrusion conditions on structural and functional properties of developed extrudates.
The sorghum (red and white) and buckwheat was pre-processed as per flow sheet 1 and 2 were further used for development of extruded snacks. All raw, pre-processed flours and its prepared extruded products were analyzed as per the standards methods. Determination of Ash
Materials and Methods Materials The red and white sorghum grains were procured from local market of Himachal Pradesh and buckwheat grains were procured from the market of Lahaul and Spiti area of western Himalayan region. The procured raw material were cleaned and stored for further use. Thesegrains were roasted, dried, puffed and further grind to powder in order to study the effect of processing treatment on the development of extruded snacks.
Two porcelain crucibles were washed and dried in an oven to a constant weight at 100ºC for 10min. They were allowed to cool in a desiccators, then labelled A and B and weighed. 2.0 g of each sample were weighed into each of the previously weighed porcelain crucibles and reweighed. The crucibles containing the samples were transferred into a furnace, which was set at 550ºC for 8 hr to ensure proper ashing. They were then removed and allowed to cool in the desiccators then finally weighed (AOAC.1980). % ash= weight of ash*100 Weight of sample
Methods Extrusion Process The extrusion cooking was carried out using single screw extruder (Model No. KE19, Brabender, Germany) having a screw with a compression ratio of 2:1 and L/D ratio of 20:1. The different feed materials from sorghum and buckwheat were ground to coarse size and were subjected to conditioning by addition of water to obtain desired
Determination of Moisture Two petriplates were properly washed and allowed to dry in an air oven at 110ºC for 10 min to a constant weight. The petriplates were allowed to cooled in a desiccators for 30 min, then labelled A and B and weighed. 2.0 g of each sample was accurately weighed into the previously labelled petriplates and reweighed. The petriplates containing
International Journal of Food, Nutrition and Dietetics / Volume 4 Number 1/ January - April 2016
18
Shivani Gupta et. al. / Effect of Different Pre-Processing Methods on the Extruded Products and Its Resultant Effect on Nutritional Properties and Health
Flow sheet 1: Formation of extruded product from sorghum
Sorghum
Red Sorghum
White Sorghum
Pre - Processing Methods 1. Raw Sorghum 2. Roasting
Grind Cooling
Flour. Grind
3. Soaking (10 min) and drying (4-5 hrs) 4. Puffing
Cooling
Grind
Flour. Cooling
Grind
Flour
Flour.
Flour
Compositional Analysis
Extruded Product
Analysis of Product International Journal of Food, Nutrition and Dietetics / Volume 4 Number 1/ January - April 2016
Shivani Gupta et. al. / Effect of Different Pre-Processing Methods on the Extruded Products and Its Resultant Effect on Nutritional Properties and Health
19
Flow sheet 2: Formation of extruded product from buckwheat
Buck Wheat
Pre-Processing Methods 1. Raw Buck wheat
Grind
2. Roasting Buck Wheat 3. Soaking and drying 4. Puf? ng
Flour.
Cooling Cooling
Cooling
Grind Grind
Grind
Flour. Flour.
Flour.
Flour
Compositional Analysis
Extruded Product
Analysis of Product the samples were placed in an oven maintained at 100ºC till constant weight came. They were removed and transferred to desiccators to cooled, finally weighed(AOAC, 1980). % moisture content = (W1-W2) * 100 W1-W Where W1 is weight of sample and petriplates before drying W2 is weight of sample and petriplates after drying. W is weight of empty petriplates. Determination of Water Absorption Index WAI can be determined by the method of Anderson (1982), here 2g of sample along with 20 ml of distilled water was taken in pre- weighed centrifuge tubes. Stir it for 5 minutes and further heat at 85°C for 10 minutes. Cool it and centrifuge it at 3500 rpm for 15
minutes. Supernatant was decanted in pre- weighed centrifuge tubes and dried at 100°C for determination of its solid content and sediment was weighed. WAI was calculated as weight of sediment or gel obtained after supernatant removal per unit weight of original solids. Water Absorption Index = weight of sediment/ weight of dry solids. Determination of Water Solubility Index WSI can be determined by the method of Anderson (1982), here 2g of sample along with 20 ml of distilled water was taken in pre- weighed centrifuge tubes. Stir it for 5 minutes and further heat at 85°C for 10 minutes. Cool it and centrifuge it at 3500 rpm for 15 minutes. Supernatant was decanted in pre weighed centrifuge tubes and dried at 100°C for determination of its solid content and sediment was weighed. WSI can be calculated as weight of dry solids in the
International Journal of Food, Nutrition and Dietetics / Volume 4 Number 1/ January - April 2016
20
Shivani Gupta et. al. / Effect of Different Pre-Processing Methods on the Extruded Products and Its Resultant Effect on Nutritional Properties and Health
supernatant expressed as % of original sample weight on dry basis. Water Solubility Index = weight of dissolved solids in supernatant/ weight of dry solids *100 Determination of Water Holding Capacity 2g of Buck wheat and sorghum sample were weighed and allowed to rehydration overnight in excess water (20ml) after draining , it was reweighed and WHC was calculated as: Water Holding Capacity = weight of wet extrudates powder- weight of dry extrudate powder/ weight of dry extrudates powder * 100 Determination of Protein by Lowry’s Method Protein content was estimated by using Lowry’s Met hod. T he phenolic group Tyr osine and Tryptophan residues in a protein will produce a blue colour complex, with maximum absorption in the region of 660 nm wavelength. With FolinCiocalteu reagent which consists of sodium tungstate molybdate and phosphate. Intensity of colour depends on the amount of these aromatic amino acids present and will thus vary for different proteins. Most protein estimation techniques use Bovine Serum Albumin (BSA) universally as a standard protein, because of its low cost, high purity and readily availability. The method is sensitive down to about 10µg/ml and probably most widely used protein assay despite its being only a relative method. Determination of Bulk Density Bulk Density was determined by weighing the quantity of 5-cm long pieces required to fill a 100 ml beaker (Hood- Niefer and Tyler 2010). The extrudate pieces are randomly added to container and container was shaken several times during filling. Bulk density was calculated by: Bulk Density (g/cm3) = M/V Where, M is mass (g).V is the volume of the beaker in cm3. Determination of Expansion Ratio For determination of expansion ratio, the cross sectional diameter of the extrudate was measured by using vernier calliper. The expansion ratio was calculated as the cross sectional diameter of the extrudates divided by the diameter of the die opening (Ding etal, 2005).
Determination of Porosity Porosity can be calculated according to Wang et al (1999) using the following calculations: Porosity (%) = Particle density- Bulk Density*100 Particle Density Particle density was calculated according to the method of Gujska and Khan (1990). Individual cylindrical extrudate rods were weighed individually; the diameter and length were measured by using Vernier Calliper: Particle density (g/cm3) = 4m/π2L Where m and L are rod mass (g) and length (cm) respectively of cooled extrudates with diameter d (cm). The particle density values were calculated as average of twenty measurements for each replicate. Determination of Colour Measurements Colour value (L*, a* and b*) analysis was performed using a reflectance colorimeter Minolta, ChromaMeter C1-200, according to method CIE (1971). L* value is the brightness of the colour in the range of values from 0 (black) to 100 (white); the higher the values, the brighter the colour. The value of a* indicates the redness of sample namely (green) to + (red). The value b* value indicates the yellowness of the sample namely (blue) to + (yellow). Each sample individually measured in triplicate. Determination of Total Phenolic Content Total phenolic content of both the sample and the product were determined. Plant polyphenols, a diverse group of phenolic compounds (Flavanols, anthocyanins, phenolic acids, etc.) posses an ideal structural chemistry for free radical scavenging activity. Ant oxidative properties of polyphenol arise from their high reactivity as hydrogen or electron donors from the ability of the poly phenol derived radical to stabilize and delocalize the unpaired electron (chain breaking function) and from their potential to chelate metal ions (termination of the Fenton reaction) (Rice-Evans et al., 1997). (McDonald et al, 2001) FolinCiocateu reagent method 0.5 ml of extract and 0.1 ml of Folin- Ciocateu reagent (0.5N) are mixed and incubate at room temperature for 15 minutes. Take 2.5 ml of saturated sodium carbonate was added and further incubated for 30 minutes at room temperature and absorbance measured at 760nm. Determination of Total Flavonoids Content Total flavonoids content was determined in both
International Journal of Food, Nutrition and Dietetics / Volume 4 Number 1/ January - April 2016
Shivani Gupta et. al. / Effect of Different Pre-Processing Methods on the Extruded Products and Its Resultant Effect on Nutritional Properties and Health
sample and product, the antioxidative properties of flavonoids were due to several mechanisms, such as scavenging of free radicals, chelation of metal ions, such as iron and copper and inhibition of enzymes responsible for free radical generation (BenaventeGarcia, 1997). (Chang et al, 2003) aluminium chloride method 1 ml of extract 0.5 ml of 1.2% aluminium chloride and 0.5 ml of 120 mM potassium acetate were mixed and incubate for 30 minutes at room temperature, and then absorbance measured at 415nm. Determination of Water Activity Water activity of sample was analyzed by Aqualab dew point water activity meter 4TE. Weigh 2.0 g of sample, place sample in small plastic containers and then open the drawer of the water activity meter, insert your sample, close and turn the knob to the read position allow sample to equilibrate read aw.
21
sample is contained in a porous thimble that allows the solvent to completely cover the sample. Thimble is contained in an extraction apparatus that enables the solvent and the sample and allow it to dissolve all the fat contained in the sample. Weigh 5g of sample in a thimble, insert the thimble into a Soxhlet liquid/extract, accurately weigh a clean, dry 250 ml round bottom flask and put about 1150 ml of hexane in the flask. Heat the solvent in the flask until it boils. Adjust the heat source so that solvent drips from the condenser into the sample, chamber at the rate of about 6 drops per second. Continue the extraction for 6 hours, remove the extraction until from the heat source and detach the extractor and condenser. Replace the flask on heat source and evaporate off the solvent. The solvent may be distilled and recovered. Place the flask in an oven at 102°C and dry the solvent until a constant weight is reached (1-2 hours). Cool the flask in desiccators and weigh the flask and container. % Crude Fat = W2-W1*100
Determination of Fat
S
Fat content of sample were determined by using Soxhlet method, crude fat content is determined by extracting the fat from the sample using a solvent, then determining the weight of the fat recovered. The
Where weight of empty flask (g) = W1 Weight of flask and extracted fat = W2 Weight of sample = S
Table 3.1: Analysis of red sorghum flour
Sample
M
A
WAI
WHC
WSI
TPC
TFC
P
aw
CI
BD
Fat
Raw
12 ± 0.14 4± 0.14 6± 0.14 4± 0.14
1± 0.14 1± 0.14 0.5 ±0.07 0.5 ± 0.07
3.63 ± 0.042 4.18 ± 0.07 3.54 ± 0.056 4.63 ± 0.056
272.72 ± 0.07 318.18 ± 0.07 227.27 ± 0.14 372.72 ± 0.14
81.57 ± 0.07 98.21 ± 0.14 98.27 ± 0.14 96.07 ± 0.07
0.693 ± 0.07 0.4052 ± 0.056 0.1536 ± 0.052 0.1616 ± 0.056
1.784 ± 0.014 0.413 ± 0.07 0.1924 ± 0.14 0.399 ± 0.056
0.45 ± 0.07 0.158 ± 0.14 0.179 ± 0.07 0.145 ± 0.07
0.588
16.55
0.646
2
0.1976
12.41
0.59
2
0.2381
13.71
0.56
2
0.1737
9.78
0.35
2
Roasted Dried Puff
Table 3.2: Analysis of white sorghum flour Sample
M
A
WAI
WHC
WSI
TPC
TFC
P
CI
aw
BD
Fat
Raw
1± 0.14
0.1993
2.1
10.91
0.6
0.7824
1.9
4 ± 0.14
1 ± 0.14
0.419 ± 0.07 0.135 ± 0.056 0.159 ± 0.056 0.132 ± 0.056
0.53
Puff
1.778 ± 0.07 0.219 ± 0.07 0.1924 ± 0.07 0.401 ± 0.07
6.97
1 ± 0.14
0.6631 ± 0.056 0.3096 ± 0.07 0.133 ± 0.056 0.1936 ± 0.14
1.9
7 ± 0.14
88.88 ± 0.07 98.07 ± 0.14 94.75 ± 0.14 96.08 ± 0.14
0.5434
Dried
320 ± 0.14 377.77 ± 0.07 350 ± 0.07 372.72 ± 0.07
0.5
1 ± 0.14
4.5 ± 0.056 5± 0.042 4.8 ± 0.056 4.72 ± 0.042
8.87
Roasted
12 ± 0.14 8 ± 0.14
6.76
0.43
0.1581
2.0
Results and Discussions The present research was undertaken to study the various physico-c hemical properties of extruded products prepared from sorghum and buckwheat. The results obtained in the present investigation are presented and discussed under suitable headings.
Physico-Chemical Analysis of Raw Buck wheat and Sorghum Here M- Moisture. , A- Ash, WAI- Water absorption index, WHC- water holding capacity, WSI- water solubility index, P- protein, CI- colour index, aw-water activity, BD- bulk density, Por- Porosity, ERexpansion ratio. The moisture content of raw red sorghum flour is
International Journal of Food, Nutrition and Dietetics / Volume 4 Number 1/ January - April 2016
22
Shivani Gupta et. al. / Effect of Different Pre-Processing Methods on the Extruded Products and Its Resultant Effect on Nutritional Properties and Health
higher (12 ± 0.14) than that of roasted and puff flour (4 ± 0.14). The ash content came out to be same in raw and roasted flours (1 ± 0.14) and same in dried and puff flour (0.5 ± 0.07). The WAI means that how much water had been absorbed by the sample results in higher in case of puff flour (4.63 ± 0.056) and lower in case of dried flour (3.54 ± 0.056). The WHC represents about the how much water had been hold by the flour which came out to be higher in Puff flour (372.72 ± 0.14) and lower in dried flour (227.27 ± 0.14), the TPC and TFC represents the antioxidant activities of the sample where TPC content is high in raw flour (0.693 ± 0.07) and low in dried flour (0.161 ± 0.056) and that of TFC content came out to be higher in raw flour (1.784 ± 0.14) and low in puff flour (0.399 ± 0.056) , the protein content of raw flour (0.45 ± 0.07) is higher than that of puff flour (0.145 ± 0.07), the aw and colour index of raw flour is higher (aw- 0.588 and colour index is 16.55) and that of puff flour is lower ( aw – 0.1737 and colour index is 9.78). Bulk density came out to be 0.646 in raw flour and that of 0.35 in puff flour. Here M- Moisture. , A- Ash, WAI- Water absorption index, WHC- water holding capacity, WSI- water solubility index, P- protein, CI- colour index, aw-water
activity, BD- bulk density, Por- Porosity, ERexpansion ratio. The moisture content of raw white sorghum flour is higher (12 ± 0.14) than that of puff flour (4 ± 0.14). The ash content came out to be same in all preprocessing flours (1 ± 0.14) The WAI means that how much water had been absorbed by the sample results in higher in case of puff flour (4.72 ± 0.056) and lower in case of raw flour (4.5 ± 0.056). The WHC represents about the how much water had been hold by the flour which came out to be higher in Roasted flour (372.72 ± 0.14) and lower in raw flour (320.27 ± 0.14), the TPC and TFC represents the antioxidant activities of the sample where TPC content is high in raw flour (0.663 ± 0.07) and low in dried flour (0.133 ± 0.056) and that of TFC content came out to be higher in raw flour (1.778 ± 0.14) and low in dried flour (0.1924 ± 0.056) , the protein content of raw flour (0.419 ± 0.07) is higher than that of puff flour (0.139 ± 0.056), the aw and colour index of dried flour is higher (aw- 0.7824 and colour index is 10.91) and that of puff flour is lower ( aw– 0.132 and colour index is 6.76). Bulk density came out to be 0.6 in dried flour and that of 0.43 in puff flour.
Table 3.3: Analysis of buckwheat flour Sample
M
A
WAI
WHC
WSI
TPC
TFC
P
aw
CI
BD
Fat
Raw
10 ± 0.14
1 ± 0.14
3.74
0.64
2.5
0.3408
8.15
0.59
2.5
Puff
4 ± 0.14
0.632 ± 0.07 0.456 ± 0.07 0.237 ± 0.14 0.137 ± 0.056
0.1558
10 ± 0.14
1.878 ± 0.14 0.552 ± 0.07 0.8052 ± 0.14 0.509 ± 0.07
2
Dried
0.7836 ± 0.056 0.6096 ± 0.07 0.1616 ± 0.07 0.2056 ± 0.056
0.5
0.5 ± 0.07 1 ± 0.14
95.31 ± 0.14 96.22 ± 0.14 93.41 ± 0.07 97.43 ± 0.07
7.7
8 ± 0.14
280 ± 0.056 410 ± 0.07 254.54 ± 0.056 481.81 ± 0.07
0.5096
Roasted
3.6 ± 0.07 5± 0.042 3.36 ± 0.056 5.54 ± 0.042
0.2796
10.28
0.38
2
0.5 ± 0.07
Table 3.4: Analysis of buckwheat extruded product Sample
M
A
WAI
WHC
WSI
TPC
TFC
P
aw
CI
BD
Por
ER
Fat
Raw
4.02 ±
1.01 ±
7.01 ±
742.35
99.42
0.7857
0.6883
0.1793
0.474
11.77
0.208
92.53
0.93
5.2
0.01
0.02
0.042
± 0.17
± 0.07
± 0.056
± 0.14
± 0.07
2
Roasted
4.01 ±
1.01 ±
7.18 ±
759. 94
99.41
0.3761
0.6734
0.178 ±
0.128
10.36
0.208
94.07
1.46
5
0.07
0.02
0.07
± 0.17
± 0.14
± 0.14
± 0.14
0.14
2
3.09 ±
1±
7.23 ±
701.66
99.44
0.4251
0.5682
0.1881
0.303
12.49
0.208
94.07
1.43
10
0.07
0.02
0.07
± 0.17
± 0.14
± 0.07
± 0.14
± 0.07
2
3.01 ±
1.01 ±
7.2 ±
720.66
98.73
0.4163
0.5182
0.1774
0.136
12.36
0.208
92.57
0.93
4.5
0.02
0.14
0.07
± 0.17
± 0.07
± 0.07
± 0.14
± 0.07
2
Dried
Puff
Here M- Moisture. , A- Ash, WAI- Water absorption index, WHC- water holding capacity, WSI- water solubility index, P- protein, CI- colour index, aw-water activity, BD- bulk density, Por- Porosity, ERexpansion ratio. The moisture content of raw and dried Buck Wheat flour are higher (10 ± 0.14) than that of puff flour (4 ± 0.14). The ash content came out to be same in raw and
dried flours (1 ± 0.14) and different in roasted and puff flours (0.5 ± 0.14). The WAI means that how much water had been absorbed by the sample results in higher in case of puff flour (5.54 ± 0.056) and lower in case of dried flour (3.36 ± 0.056). The WHC represents about the how much water had been hold by the flour which came out to be higher in Puff flour (481.81 ± 0.07) and lower in raw flour (254.54 ± 0.056),
International Journal of Food, Nutrition and Dietetics / Volume 4 Number 1/ January - April 2016
Shivani Gupta et. al. / Effect of Different Pre-Processing Methods on the Extruded Products and Its Resultant Effect on Nutritional Properties and Health
the TPC and TFC represents the antioxidant activities of the sample where TPC content is high in raw flour (0.7836 ± 0.056) and low in dried flour (0.1616 ± 0.07) and that of TFC content came out to be higher in raw flour (1.878 ± 0.14) and low in puff flour (0.509 ± 0.07), the protein content of raw flour (0.632 ± 0.07) is higher than that of puff flour (0.137 ± 0.056), the aw of raw flour is higher and colour index of puff flour (aw0.5096 and colour index is 10.28) and aw of roasted flour is lower and colour index of roasted flour is even lower ( aw – 0.1558 and colour index is 3.74). Bulk density came out to be 0.64 in roasted flour and that of 0.38 in puff flour
23
by the sample results in higher in case of dried extruded product (7.23 ± 0.07) and lower in case of raw extruded (7.01 ± 0.042). The WHC represents about the how much water had been hold by the product which came out to be higher in Roasted extruded product (754.94 ± 0.14) and lower in dried extruded product (701.66 ± 0.17), the TPC and TFC represents the antioxidant activities of the sample where TPC content is high in raw extruded product (0.7857 ± 0.07) and low in puff extruded product (0.4163 ± 0.056) and that of TFC content came out to be higher in raw extruded product (0.6883 ± 0.14) and low in puff extruded product (0.5182 ± 0.14) , the protein content of dried extruded product (0.1881 ± 0.07) is higher than that of puff extruded product (0.1774 ± 0.056) which is lower, the aw of roasted extruded product is higher and colour index of dried extruded product is higher (aw- 0.4742 and colour index is 12.49) and that of roasted extruded product is lower (aw – 0.1282 and colour index is 10.36). Bulk density came out to be 0.208 for all samples. Expansion Ratio is higher in case of roasted extruded product (1.46) and lower in case of dried product (1.43). Porosity came out to be higher in roasted and dried extruded product (94.07) and low in case of raw extruded product (92.57).
Here M- Moisture. , A- Ash, WAI- Water absorption index, WHC- water holding capacity, WSI- water solubility index, P- protein, CI- colour index, aw-water activity, BD- bulk density, Por- Porosity, ERexpansion ratio. The moisture content of raw Buck Wheat extruded product is higher (4.01 ± 0.01) than that of puff extruded product (3.01 ± 0.02). The ash content came out to be same in raw, roasted and puff (1.01 ± 0.02) and different in dried extruded product (1 ± 0.02). The WAI means that how much water had been absorbed Table 3.5: Analysis of red sorghum extruded product Sample
M
A
WAI
WHC
WSI
TPC
TFC
P
aw
CI
BD
Por
ER
Raw
2.7 ± 0.07 2.62 ± 0.14 3.4 ± 0.42 3.68 ± 0.42
1± 0.14 0.9 ± 0.02 1± 0.14 0.9 ± 0.02
5.03 ± 0.042 6.54 ± 0.07 6.12 ± 0.056 6.49 ± 0.042
696.3 ± 0.07 754.45 ± 0.056 612.3 ± 0.07 690.9 ± 0.07
96.42 ± 0.07 88.32 ± 0.07 94.12 ± 0.07 98.22 ± 0.07
0.168 ± 0.07 0.1359 ± 0.14 0.1691 ± 0.14 0.1483 ± 0.056
0.2391 ± 0.07 0.2241 ± 0.14 0.2031 ± 0.14 0.1939 ± 0.14
0.0288 ± 0.07 0.0272 ± 0.14 0.0239 ± 0.14 0.0179 ± 0.14
0.544
9.71
0.178
95.87
1.36
0.1876
10.77 0.178
99.03
1.23
0.2272
7.96
0.178
94.06
1.53
0.1673
10.24 0.178
94.08
1.33
Roasted Dried Puff
Fat
Table 3.6: Analysis of white sorghum extruded product Sample
M
A
WAI
WHC
WSI
TPC
TFC
P
aw
CI
BD
Por
ER
Raw
2.26 ± 0.084 2.08 ± 0. 07 2.48 ± 0.07 2.04 ± 0.42
1.01 ± 0.02 1± 0.14 1± 0.14 0.92 ± 0.02
6.78 ± 0.056 6.4 ± 0.042 6.61 ± 0.042 6.85 ± 0.042
710.88 ± 0.056 726.16 ± 0.056 690.51 ± 0.14 725.57 ± 0.056
97.45 ± 0.14 95.6 ± 0.14 99.32 ± 0.07 99.13 ± 0.14
0.0747 ± 0.056 0.0732 ± 0.14 0.0899 ± 0.056 0.0699 ± 0.14
0.2494 ± 0.056 0.2092 ± 0.07 0.2465 ± 0.14 0.1883 ± 0.14
0.0269 ± 0.14 0.0252 ± 0.14 0.0216 ± 0.14 0.018 ± 0.056
0.5018
3.95
0.178
91.3
1.36
0.1552
2.88
0.178
94.03
1.43
0.5315
5.29
0.178
94.08
1
0.1417
6.34
0.178
99.04
1.36
Roasted Dried Puff
Here M- Moisture. , A- Ash, WAI- Water absorption index, WHC- water holding capacity, WSI- water solubility index, P- protein, CI- colour index, aw-water activity, BD- bulk density, Por- Porosity, ERexpansion ratio The moisture content of puff Red Sorghum extruded product is higher (3.68 ± 0.42) than that of roasted extruded product (2.62 ± 0.14). The ash content came out to be same in raw and dried extruded
Fat
product (1 ± 0.14) and different in roasted and puff extruded product (0.9 ± 0.02). The WAI means that how much water had been absorbed by the sample results in higher in case of roasted extruded product(6.54 ± 0.07) and lower in case of raw extruded (5.03 ± 0.042). The WHC represents about the how much water had been hold by the product which came out to be higher in Roasted extruded product (754.45 ± 0.14) and lower in dried extruded product (612.3 ±
International Journal of Food, Nutrition and Dietetics / Volume 4 Number 1/ January - April 2016
24
Shivani Gupta et. al. / Effect of Different Pre-Processing Methods on the Extruded Products and Its Resultant Effect on Nutritional Properties and Health
0.07), the TPC and TFC represents the antioxidant activities of the sample where TPC content is high in dried extruded product (0.1691 ± 0.14) and low in roasted extruded product (0.1359 ± 0.14) and that of TFC content came out to be higher in raw extruded product (0.2391 ± 0.07) and low in puff extruded product (0.1939 ± 0.14) , the protein content of raw extruded product (0.0288 ± 0.07) is higher than that of puff extruded product (0.0179 ± 0.14) which is lower, the aw of raw extruded product is 0(aw - 0.544) and colour index of roasted extruded product is higher ( Colour index is 10.77) and water activity of puff extruded product is ( aw -0.1673) and that of colour index which is lower in case of dried extruded product (Colour index- 7.96). Bulk density came out to be 0.178 for all samples. Expansion Ratio is higher in case of dried extruded product (1.53) and lower in case of roasted product (1.23). Porosity came out to be higher in roasted extruded product (99.03) and low in case of dried extruded product (94.06).
Here M- Moisture. , A- Ash, WAI- Water absorption index, WHC- water holding capacity, WSI- water solubility index, P- protein, CI- colour index, aw-water activity, BD- bulk density, Por- Porosity, ERexpansion ratio The moisture content of dried White Sorghum extruded product is higher (2.48 ± 0.07) than that of puff extruded product (2.04 ± 0.042). The ash content came out to be higher in raw (1.01 ± 0.02) and lower in puff extruded product (0.92 ± 0.02). The WAI means that how much water had been absorbed by the sample results in higher in case of puff extruded product (6.85 ± 0.042) and lower in case of roasted extruded (6.4 ± 0.042). The WHC represents about the how much water had been hold by the product which came out to be higher in Roasted extruded product (726.16 ± 0.056) and lower in dried extruded product (690.51 ± 0.14), the TPC and TFC represents the antioxidant activities of the sample where TPC content is high in dried extruded product (0.0899 ± 0.056) and low in
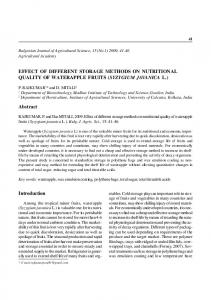
Fig. 3.1: Figure showing raw extruded product prepared from buck wheat & sorghum
Fig. 3.2: Figure showing roasted extruded product prepared from buck wheat & sorghum
Fig 3.3: Figure showing dried extruded product prepared from buck wheat & sorghum International Journal of Food, Nutrition and Dietetics / Volume 4 Number 1/ January - April 2016
Shivani Gupta et. al. / Effect of Different Pre-Processing Methods on the Extruded Products and Its Resultant Effect on Nutritional Properties and Health
25
Fig 3.4: Figure showing puffed extruded product prepared from buck wheat & sorghum
puff extruded product (0.0699 ± 0.014) and that of TFC content came out to be higher in raw extruded product (0.2494 ± 0.056) and low in puff extruded product (0.1883 ± 0.14) , the protein content of raw extruded product (0.0269 ± 0.14) is higher than that of puff extruded product (0.018 ± 0.056) which is lower, the aw of dried extruded product is higher and colour index of puff extruded product is higher (aw0.5315 and colour index is 6.34) and that of puff extruded product water activity is lower and colour index of raw extruded product is lower (aw – 0.1552 and colour index is 2.88). Bulk density came out to be 0.178 for all samples. Expansion Ratio is higher in case of roasted extruded product (1.43) and lower in case of dried product (1.00). Porosity came out to be higher in puff extruded product (99.04) and low in case of raw extruded product (91.3). Acknowledgement Our loyal and venerable thanks are due to advisor of the project Dr. Mahesh Gupta (Scientist) for his inspiring guidance, technical suggestions and pain taking efforts which helped me at every stage for improving and enriching the scientific document. He has been an esteemed guide and moving spirit behind this uphill task. Without his able guidance and pain taking efforts, and encouragement, the work would not have been what it is. His visionary ideas, enthusiastic approach, analytical vigour and swift execution have led to accomplishment of this work. We are extremely thankful to all the members of the Food and Nutraceutical for the cooperation and encouragement extended during the preparation of the project report. References 1.
AS; Andersson H; Amado R; Schlemmer H; SerraF. (eds), Bioactive Inositol Phosphates and Phytosterolsin Food. Cost 916. Office for Official Publications of theEuropean Communities,
Luxemburg: 69–72., Czech Journal of Food Science. Vol. 26, No. (3): 153–162 2.
Alvarez-Jubete L; Arendt EK; Gallagher E. Nutritive value and chemical composition of pseudo cereals as gluten free ingredients. International Journal of Food Science nutrition. 2009; (60): 240-257.
3.
AOAC (Association of Official Analytical Chemists, 1990), Official methods of analysis, volume 2.
4.
Bonafaccia G; Marocchini M; Kreft I. Composition and technological properties of the flour and bran from common and tartary buckwheat. Food Chemistry. 2003; (80): 9–15.
5.
Chang WS; Lin CC; Chuang HC, Superoxide anion scavenging effect of coumarins. American Journal of Chinese Medicine. 1996; (24): 11-17.
6.
Colonna P; Doublier J.L; Melcion J.P; Monredon F; Mercier C. Extrusion cooking and drum drying of wheat starch: I. Physical and macromolecular modifications, Cereal Chemistry 1984; 61(6): 538-543.
7.
Colonna P; Mercier C., Macromolecular modifications of manoic starch components by extrusion cooking with and without lipids, Carbohydrate Polymers. 1983; (3): 87-108.
8.
Dietrych-Szostak D; Oleszek W. Effect of processing on the flavonoid content in buckwheat (Fagopyrum esculentum Moench) grain. Journal of Agricultural and Food Chemistry. 1999; (47): 4383–4387.
9.
Davidson VJ; Paton D; Diosady LL; Larocque G. Degradation of wheat starch in a single screw extruder: Characteristics of extruded starch polymers, Journal of Food Science. 1984; 49: 453-458.
10. “FAOSTAT”. Food and agriculture organization of the united nations. Retrieved 2010-05-21. 11. Gomez M.H; Aguilera J.M. Changes in the starch fraction during extrusion cooking of corn, Journal of Food Science. 1983; 48: 378-381. 12. Gomez M.H; Aguilera J.M. A physicochemical model for extrusion of corn starch, Journal of Food Science. 1984: (49): 40-49. 13. ICRISAT, “Medium-Term Plan 1994-1998,” International Crops Research Institute for the Semi-Arid Tropics, Patancheru, 1992. 14. Kreft I; Plestenjak A; Golob T; Skrabanja V; Rudolf M; Draslar K. (1999a), Functional value of buckwheat
International Journal of Food, Nutrition and Dietetics / Volume 4 Number 1/ January - April 2016
26
Shivani Gupta et. al. / Effect of Different Pre-Processing Methods on the Extruded Products and Its Resultant Effect on Nutritional Properties and Health
as affected by the content of inositol, phosphate, minerals, dietary fiber and protein. In: Sanberg 161 15. Krkoskova B; Mrazova Z. Prophylactic components of buckwheat. Food Research International. 2005; (38): 561–568. 16. Li, S. Q; Zhang, Q.H. Advances in the development of functional food from buckwheat. Critical Reviews in Food Science Nutrition. 2001; (41): 451-464. 17. Mahasukhonthachat K; Sopade PA; Gidley MJ. Kinetics of starch digestion in sorghum as affected by particle size, Journal of Food Engineering. 2010; 96: 18-28. 18. McDonald S; Prenzler PD; Antolovich M; Robards K. Phenolic content and antioxidant activity of olive extracts. Food Chemistry. 2001; 73: 73-84.
process, Lebensm-Wiss.U. Technol. 2002; 35: 120-127. 23. Peng, X; Zheng, Z; Cheng, K-W; Shan, F; Ren, G- X., Chen, F; Wang, M. Inhibitory effect of mung bean extract and its constituents vitexin and isovitexin on the formation of advanced glycation end products. Food Chemistry. 2008; 106: 475-481. 24. Qian J; Kuhn M. Physical properties of buckwheat starches from various origins. Starch/Starke. 1999; 51: 81–85. 25. Rawat, V.S; Rawat, Y.S; Shah, S. Indigenous knowledge and sustainable development in the tones valley of Garhwal Himalaya Journal of Medicinal Plants Research. 2010; 19(4): 2043-2047. 26. Smith AC; Singh N. New applications of extrusion technology, Indian Food Industry, 1996; 15: 14-23.
19. Mercier C; Feillet P. Modification of carbohydrate component by extrusion cooking of cereal product, Cereal Chemistry. 1975; 52: 283-297.
27. Singh N; Cairns P; Morris V.J; Smith A.C. Physical properties of extruded wheat starch-additive mixtures, Cereal Chemistry. 1998; 75: 325-330
20. Mesa-Stonestreet N.J; Sajid A; JeffG. Extrusionenzyme liquefaction as a method for producing sorghum protein concentrates, Journal of FoodEngineering. 2012; 108(2): 365-375.
28. Steadman K.J; Burgoon M.S; Lewis B.A; Edwardson S.E; Obendorf R.L. Buckwheat seed milling fraction: description, macronutrient composition and dietary fibre. Journal of Cereal Science. 2001; 33: 271–278.
21. Pant, S; Samant, S.S. and Arya, S.C. Diversity and indigenous household remedies of the inhabitants surrounding Mornaula reserve forest in west Himalaya, Indian Journal of Traditional Knowledge. 2009; 8(4): 606-610.
29. Wen L.F; Rodis P; Wasserman B.P. Starch fragmentation and protein insolubilization during twin screw extrusion of corn meal, Cereal Chemistry 1990; 67(3): 268-275.
22. Pelembe L.A.M; ErasmusC; Taylor J.R.N. Development of a protein-rich composite sorghumcowpea instant porridge by extrusion cooking
30. Zieliñski H; Koz³owska H. Antioxidant activity and total phenolics in selected cereal grains and their different morphological fractions. Journal of Agricultural and Food Chemistry. 2000; 48: 2008–2016.
International Journal of Food, Nutrition and Dietetics / Volume 4 Number 1/ January - April 2016