PHYSICAL REVIEW B 85, 035412 (2012)
Effect of elastic deformation on frictional properties of few-layer graphene A. Smolyanitsky,* J. P. Killgore, and V. K. Tewary Materials Reliability Division, National Institute of Standards and Technology, Boulder, Colorado 80305, USA (Received 8 November 2011; published 9 January 2012) We describe the results of Brownian dynamics (BD) simulations of an atomic force microscope (AFM) tip scanned on locally suspended few-layer graphene. The effects of surface compliance and sample relaxation are directly related to the observed friction force. We demonstrate that the experimentally observed reduction of friction with an increasing number of graphene layers in case of a narrow scanning tip can be a result of decreased sample deformation energy due to increased local contact stiffness under the scanning tip. Simulations with varying scan rates indicate that surface relaxation at a given temperature can affect the frictional characteristics of atomically thin sheets in a manner not explained by conventional thermally activated models. DOI: 10.1103/PhysRevB.85.035412
PACS number(s): 81.05.ue, 62.20.Qp
I. INTRODUCTION
Frictional mechanisms in atomically thin layers are unclear, despite graphene’s suggested promise as a possibly revolutionary solid-state lubricant. There have only been a few works investigating the frictional characteristics of such systems. Filleter et al.1 studied the frictional properties of monolayer and bilayer graphene on a SiC(0001) substrate, reporting an approximately linear relationship between friction force and applied load, with measured friction coefficients of ∼0.004 and ∼0.001 for monolayer and bilayer samples, respectively.1 Lee et al.2 used atomic force microscope (AFM) to study frictional properties of various free-standing atomically thin layers and reported a friction force that decreased with an increased number of layers. A mechanism involving sheet “puckering” in front of the scanning tip was proposed to explain the observation. In contrast to the results in Refs. 1 and 2, Shin et al.3 observed no difference in the friction coefficient between monolayer, bilayer, and trilayer exfoliated graphene on a SiO2 substrate. The apparent discrepancy may be related to the presence and magnitude of graphene-substrate adhesion. Liu and Zhang4 performed a set of adiabatic molecular dynamics (MD) simulations of a carbon nanotube (CNT) tip scanning on few-layer graphene. Despite their use of simulation methodology poorly suited for a dissipative process, as indicated by the steadily rising temperature in their system, their results qualitatively reproduce some of the experimental trends in Refs. 1–3. In this work we use an appropriately designed atomistic simulation to elucidate the underlying mechanism governing the relationship between the number of suspended graphene layers, scan velocity, and the observed frictional characteristics. Atomistic simulations of nanoscale friction have been relatively rare, mainly due to their limited timescale. As a result, MD-simulated AFM tip velocities may reach meters per second,5–7 whereas experimental scanning rates are typically nanometers to micrometers per second.1,2 Given such a difference in the scanning rates, the simulation results can differ from those obtained experimentally. This can be due to thermally activated friction7 and numerical artifacts associated with MD temperature control.8,9 Here, we use Brownian dynamics (BD) as a strongly damped alternative to MD,10 as we find it to be more appropriate for atomically thin layers, as explained later. BD describes the quasistatic nature 1098-0121/2012/85(3)/035412(6)
of an experimental AFM scan, while modeling, much more realistically than in Ref. 4, the local temperature variations and elastic response due to a moving contact.
II. SYSTEM DESCRIPTION AND COMPUTATIONAL METHOD
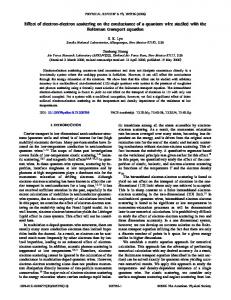
The atomic systems simulated in this work consisted of a single-wall, capped CNT AFM tip, a section of one- to four-layer suspended graphene, and a supported five-layer sample. The supported system is representative of a threedimensional (3D) material, with all atoms in the lowest layer restrained against displacement (further discussion available in supplementary material11 and Ref. 12 therein). Shown in Fig. 1 is an assembly for the four-layer suspended sample with relevant boundary conditions labeled. To reproduce AFM scanning, the upper half of the atoms along the height of the CNT were harmonically restrained and rigidly translated at a prescribed velocity. The remaining half of the atoms was allowed to interact freely with their neighbors and thus follow the translated upper part of the tip, while also interacting with the sample. The graphene sheets (dimensions 5.5 × 6.2 nm) in the multilayer assemblies were stacked in the graphite (ABAB) order. The height and diameter of the nanotube were 2.3 and 1.2 nm, respectively. The graphene atoms along the X-boundaries were harmonically restrained to their initial positions, as shown in Fig. 1. Periodic boundary conditions (PBC) were imposed on the atoms at the Y-boundaries. The tip is scanned in the Y-direction. This setup mimics a periodically spaced infinite array of AFM tips scanning along an infinitely long sample suspended over a trench. All atomic motions in the simulated systems were resolved with BD10 with a damping constant of γ = 3.32 · 10−12 kg/s. The interatomic interactions included Tersoff-Brenner bond-order potential13 within the CNT or individual graphene sheet and van der Waals interactions (using a pairwise Lennard-Jones potential with ε = 0.03 eV ˚ 14 ) between molecules (tip-sheet and sheetand σ = 3.1 A ˚ sheet) with a cutoff radius of 7.0 A. All simulations were run for a duration of 1.0 ns unless stated otherwise. To simulate force-controlled contact-mode AFM scanning, a proportional feedback mechanism was implemented. The feedback control adjusts the Z-position of
035412-1
©2012 American Physical Society
A. SMOLYANITSKY, J. P. KILLGORE, AND V. K. TEWARY
PHYSICAL REVIEW B 85, 035412 (2012)
FIG. 1. (Color online) Four-layer suspended graphene assembly. The color of each atom is determined by its Z-position. FIG. 3. (Color online) Lateral force as a function of scan distance.
the restrained tip atoms to ensure constant total force, while minimizing unwanted tip vibrations. All simulations were thermostated at 300 K. Modeling methodology greatly affects the results of simulating friction at the nanoscale. Shown in Fig. 2(a) is the lateral force plotted as a function of the scan distance with constant contact force of 15 nN obtained with BD and MD (with Nos´e-Hoover thermostat) for a monolayer graphene sample. For MD, clear stick-slip events with a near-zero average friction were observed, in agreement with previous results for a nonthermostated MD.4 The result of BD also captures the stick-slip events but yields an observable average friction force. Also note that the peak-to-peak force variation is considerably higher in MD. We attribute this “amplified” stick-slip in MD to insufficient energy dissipation at the given scanning rate, resulting in underdamped out-of-plane surface vibrations and thus a poor contact. In Fig. 2(b) we plot the average kinetic energy of the graphene atoms at the contact (graphene atoms neighboring the atoms in the scanning tip, within the van der Waals cutoff radius). The
variation of energy in the case of MD reaches 25% of the average value and is attributed to the improperly dissipated oscillations described above. In contrast, the energy variation for BD did not exceed 3% of the corresponding average. Because BD yields appreciable friction and less evidence of unphysical oscillations at the contact, it was preferred to MD for all subsequent simulations. A more detailed discussion is provided in supplementary material; see the first section of Refs. 11 and 15 therein. III. FRICTION DEPENDENCE ON THE NUMBER OF LAYERS
Using the simulation approach described above, we investigated stick-slip behavior under a constant tip-sample contact force of 14.0 nN. The lateral force was calculated from the Y-component of the sum of all van der Waals forces acting upon the atoms of the tip. Shown in Fig. 3 are the force curves as a function of the scan distance. Atomically resolved
FIG. 2. (Color online) Lateral force in MD and BD simulation (a) and average kinetic energy at the contact (b) for monolayer graphene.
035412-2
EFFECT OF ELASTIC DEFORMATION ON FRICTIONAL . . .
PHYSICAL REVIEW B 85, 035412 (2012)
FIG. 4. (Color online) (a) Contact force vs friction force sweep curves and the corresponding friction coefficients (a) and contact force vs top layer deflection and the corresponding contact stiffness values. For scaling clarity, the inset in (b) shows the value for the supported sample as text.
stick-slip events can be observed for all numbers of layers, ˚ in good correspondence with average periodicity of 2.6 A, 2 ˚ and the 2.46 A ˚ lattice with the experimental value of ∼2.7 A constant of graphene. In order to obtain the relationship between the friction force Ff and the contact force Fc , contact force sweeps were performed in the range shown in Fig. 4(a). Friction force was calculated from the average of the lateral force for a given scan line. The friction coefficients μ = (d|Ff |/dFc ) were calculated as the slopes of fitted linear trends for each force sweep and are displayed in the inset of Fig. 4(a). In good qualitative agreement with experimental results,2 we observe a reduction in friction force and the corresponding friction coefficients in response to increasing the number of layers. The friction coefficient in Fig. 4(a) is approximately inversely proportional to the number of layers in the system. Note also that the calculated friction coefficient μ = 0.009 for monolayer graphene is within an order of magnitude of μ = 0.03 measured experimentally.3 The agreement is not a consequence of direct correspondence between the systems considered here and the substrate-bound graphene studied in Ref. 3, because sample size and scanning rate also play a role, as discussed later. Interestingly, we calculate the in-plane carbon-carbon friction coefficient of 0.003 for our supported sample, which is the same order of magnitude as experimental values reported for supported graphene layers.1 This is not surprising, due to the qualitative similarity. We also investigated the relationship between the outof-plane deflection δ and the contact force Fc , shown in Fig. 4(b). Although this relationship is expected to be generally nonlinear,16–19 given the low deflections and the relatively narrow Fc sweep range (compared to Refs. 16 and 17, we are effectively measuring the stiffness k = (dFc /dδ) in the vicinity of Fc = 13 nN), the near-linear trends in Fig. 4(b) are consistent with the experiment.20 There also appears to be a nearly linear correlation between contact stiffness and the number of layers n [inset of Fig 4(b)]. Given the relationship for μ vs n shown in the inset of Fig. 4(a), μ is approximated as inversely proportional to the contact stiffness k. Physically, this indicates that the deformation energy associated with
the sample deflection strongly dictates the amount of friction observed. The physical mechanism underlying the observed k vs μ relationship is of great interest, touching upon our fundamental understanding of friction in atomically thin layers. Given our data and that in Ref. 2, we suggest that the total friction force has two main contributions: one arising from the “conventional” sliding kinetic friction due to van der Waals adhesive contact21 and one due to the elastic deformation outside the immediate contact region, spatially redistributed during AFM scan. One can estimate the conventional friction contribution as follows. From our results for the supported sample in Fig. 4(a), the friction force is about three times lower than the friction force observed for a monolayer [Fig. 4(a)]. We compared the contact area A (details provided in supplementary material11 ) at different contact forces for the supported case and monolayer graphene and found that for all contact forces A was higher for monolayer graphene by 22% at the most. In this case, the contribution of sliding friction cannot account for more than 22% of that for the supported sample and thus fails to explain the threefold increase in friction for the monolayer in Fig. 4(a). The authors of Ref. 4 give contact area dependence as the primary factor in the observed friction difference, but they omit a quantitative analysis of the proposed area-friction correlation. For a capped CNT, the true contact area effectively saturates at relatively small deflections and thus is expected to exhibit only small variations with changes in contact force or bending stiffness. For a tip of larger radius, the conventional friction contribution can be more significant or even dominant. For instance, given the results in Ref. 2, where bulk friction is ∼50% that of the monolayer, a twofold increase in the contact area (plausible for a large radius tip) can explain the difference in friction between the bulk surface and the monolayer. Based on the experimental data and the results of a continuum simulation, the authors of Ref. 2 suggested the mechanism of sample “puckering” in front of the scanning tip, effectively increasing the contact area and, thus, the amount of friction. This can indeed be expected to strongly contribute to the observed differences in friction for a large spherical tip. If puckering is an effect of the finite time associated with
035412-3
A. SMOLYANITSKY, J. P. KILLGORE, AND V. K. TEWARY
PHYSICAL REVIEW B 85, 035412 (2012)
the sheet’s elastic relaxation in front of the tip, it is more likely to occur at highly simulated scan velocities. However, for the sharp tip used here (comparable in effective width-to-tip models used in prior atomistic AFM simulations4,5,7 ), no measurable puckering was observed. We therefore propose that more experimental studies should be performed in order to better understand the contribution of elastic deformation to friction in atomically thin layers, depending on the AFM tip dimensions. For our system, we propose that the amount of friction is dominated by the contribution of the out-of-plane deformation and is directly proportional to the sample deformation energy that must be spatially redistributed during the scan. Such a contribution can describe the friction coefficient and stiffness trends with the number of layers in the sample. Qualitatively, let us assume that for a narrow contact force sweep δ = Fc /kn , where kn is the contact stiffness of a n–layer sample. Then, 2 F2 according to our hypothesis, Ff ∼ kn2δ = 2kcn , which implies dF
the trend μ = dFfc ∼ k1n , consistent with the results in the insets in Figs. 4(a) and 4(b). The dissipative mechanism is as follows: when scanning, the atoms in the sheet behind the tip’s center (with respect to scan direction) move upwards, and the atoms in front of the tip move downwards, corresponding to the constant loss and gain of elastically stored deformation energy, respectively. Although the net change in the deformation energy is zero, the atomic kinetic energies associated with elastic asperity displacement are converted into lattice vibrations and eventually dissipated via mechanisms described in Ref. 1, represented in sum by the simulator’s thermostat. To test the proposed friction mechanism, we simulated scans of multilayer samples ˚ for the with a constant out-of-plane deflection δ = 2.5 A top layer. This ensured a nearly constant tip-sample contact area. Given only conventional sliding friction and equal deformations, the Ff /Fc ratio should be nearly constant (the subsurface layers will not contribute more than 10% of the total van der Waals energy). However, if the elastic contribution to friction is dominant, assuming that all layers in a multilayer sample deflect equally, the total strain energy and thus the amount of observed friction should be nearly proportional to n. Further, the friction coefficient should decrease with additional layers, as observed earlier. The results in Fig. 5 are in reasonable support of the elastic contribution hypothesis. It is not surprising that the contact force does not scale exactly with the number of layers, because the contact force contributions of additional subsurface sheets cannot be exactly viewed as identical springs connected in parallel. For instance, Fc,bilayer ∼ 3.5 and is not 2, consistent with Ref. 18. Fc,monolayer
FIG. 5. Friction and contact forces as a function of the number of ˚ layers at a constant δ = 2.5 A.
the range from 0.1 m/s to 5.0 m/s. Scans at 0.1, 0.2, and 0.5 m/s were simulated for 10, 5, and 2 ns, respectively. The results for the supported sample (Fig. 6) reveal a nearlinear dependence of friction force on ln(v), consistent with Tomlinson-type thermally activated friction.22 However, for monolayer graphene, strong nonlinearity is evident, resulting in a considerably steeper friction increase. It is very important to note that, given the Stokesian type of damping used by
IV. DEPENDENCE OF FRICTION ON THE SCAN RATE AND SAMPLE SIZE
We investigated the dependence of friction and energy dissipation on the scanning velocity, which was also observed experimentally at nanometers per second scan velocities in Ref. 2. We performed simulations of the two extreme cases, the monolayer graphene and supported five-layer sample, at a constant load of 15 nN. The scanning velocity v was swept in
FIG. 6. (Color online) Average friction force vs logarithm of scanning velocity in the range between 0.1 and 5.0 m/s (v0 = 0.1 m/s). The inset compares friction between a monolayer of four times the area (subscript × 4) with the monolayer data in Fig. 4(a) (subscript × 1).
035412-4
EFFECT OF ELASTIC DEFORMATION ON FRICTIONAL . . .
PHYSICAL REVIEW B 85, 035412 (2012)
the Langevin thermostat in BD (or Nos´e-Hoover thermostat in conventional MD), a linear dependence between scanning rate and the frictional force is built into the simulation. The authors of Ref. 7 observe similar “athermal” effects in a MD simulation for a 3D material and explain it as a dissipative artifact of the simulation. On the other hand, given the fact that we observe negligible athermal effects in our supported sample, one could argue that the athermal effect is not an omnipresent numerical artifact, and the Stokesian response of monolayer graphene may indeed be physical. As mentioned earlier, given the finite relaxation rate of deflected monolayer graphene in front of the scanning tip, increasing the scanning velocity can lead to a an effect analogous to viscoelasticity. This produces an asperity that is less yielding to the moving tip. In addition, the thermal contribution, described by the classical Tomlinson model23 for 3D materials, can be considerably different for an atomically thin sheet. It is not surprising then that the described effects are suppressed for the supported case. Given this discussion, it is our hope to encourage further experimental and theoretical effort investigating the details of the effect of scanning velocity and contact temperature on friction in suspended atomically thin layers, including graphene. Finally, we emphasize once again the relationship between our model (similar in size to many other atomistic models of AFM) and the experimentally studied systems. We see in Fig. 6 that at lower scan velocities the difference in friction between the monolayer and supported sample decreases. This is in contrast with the results presented in Fig. 4(a) for v = 5.0 m/s, which were in good qualitative agreement with Ref. 2. As mentioned in the previous section, the effect of sample deformation will strongly depend on the sample stiffness, which decreases with increased sample size.16,24 We demonstrate the effect of sample size in the inset of Fig. 6, where we compare the results obtained for monolayer in Fig. 4(a) with those for a monolayer with identical aspect ratio but four times larger in area. As shown, the friction coefficient for the larger sample increases 2.27 ± 0.54 times, while the contact stiffness
We performed extensive atomistic BD simulations of friction between a CNT scanning tip and few-layer graphene, as well as a supported multilayer graphene sample scanned in the basal plane, at room temperature. In good qualitative agreement with experimental data,2 friction was reduced when the number of layers was increased. An energy dissipation mechanism based on the amount of sample deformation elastic energy has been proposed. It demonstrates that for AFM-like scans of a graphene surface with a sharp tip, a substantial increase in the tip-sample contact area, as in the postulated cases of puckering2 or symmetric deformation,4 is not a requisite to explain the variations in friction with the number of layers. As a result of the finite relaxation rate associated with redistributing the atoms of the tip-sample region during the scanning action, we also calculate a nonlinear friction dependence on the logarithm of the scanning rate, in violation to the Tomlinson model.23 This suggests fundamental differences in friction between atomically thin sheets and the surfaces of 3D materials.
*
10
[email protected] T. Filleter, J. L. McChesney, A. Bostwick, E. Rotenberg, K. V. Emtsev, Th. Seyller, K. Horn, and R. Bennewitz, Phys. Rev. Lett. 102, 086102 (2009). 2 C. Lee, Q. Li, W. Kalb, X.-Z. Liu, H. Berger, R. W. Carpick, and J. Hone, Science 328, 76 (2010). 3 Y. J. Shin, R. Stromberg, R. Nay, H. Huang, A. T. S. Wee, H. Yang, and C. S. Bhatia, Carbon 49, 4070 (2011). 4 P. Liu and Y. W. Zhang, Carbon 49, 3687 (2011). 5 M. R. Sorensen, K. W. Jacobsen, and P. Stoltze, Phys. Rev. B 53, 2101 (1996). 6 M. Chandross, C. D. Lorenz, M. J. Stevens, and G. S. Grest, Langmuir 24, 1240 (2008). 7 Q. Li, Y. Dong, D. Perez, A. Martini, and R. W. Carpick, Phys. Rev. Lett. 106, 126101 (2011). 8 S. Nos´e, J. Phys. Chem. 81, 511 (1984). 9 H. J. C. Berendsen, J. P. M. Postma, W. F. van Gunsteren, A. DiNola, and J. R. Haak, J. Phys. Chem. 81, 3684 (1984). 1
decreases 1.72 times. Currently, a computationally reasonable particle-based model will inherently involve nanometer-long samples scanned at high velocities, while the experimental data is obtained for micron-wide suspended regions2,16 scanned at low velocity. Our ability to reproduce experimental friction behavior is then attributed to the tradeoff between sample size and scan velocity. V. CONCLUSIONS
ACKNOWLEDGMENTS
This research was performed while A.S. held an National Research Council (NRC) Postdoctoral Research Associateship at the National Institute of Standards and Technology (NIST), an agency of the United States government. This article is a contribution of NIST and not subject to copyright in the USA. The authors thank David T. Read for invaluable discussions.
P. Turq, F. Lantelme, and H. L. Friedman, J. Chem. Phys. 66, 3039 (1977). 11 See Supplemental Material at http://link.aps.org/supplemental/ 10.1103/PhysRevB.85.035412 for detailed discussion of thermostatics, effects of supported sample stiffness, and notes on contact area calculations. 12 J. Cho, J. J. Luo, and I. M. Daniel, Compos. Sci. Technol. 67, 2399 (2007). 13 D. W. Brenner, Phys. Rev. B 42, 9458 (1990). 14 B.-J. Lee and J. W. Lee, Calphad 29, 7 (2005). 15 L. Xu, T.-B. Ma, Y.-Z. Hu, and H. Wang, Nanotechnology 22, 285708 (2011). 16 C. Lee, X. Wei, J. W. Kysar, and J. Hone, Science 321, 385 (2008). 17 M. Poot and H. S. J. van der Zant, Appl. Phys. Lett. 92, 063111 (2008). 18 M. Neek-Amal and F. M. Peeters, Phys. Rev. B 81, 235421 (2010).
035412-5
A. SMOLYANITSKY, J. P. KILLGORE, AND V. K. TEWARY 19
PHYSICAL REVIEW B 85, 035412 (2012)
W. H. Duan and C. M. Wang, Nanotechnology 20, 075702 (2009). 20 I. W. Frank, D. M. Tanenbaum, A. M. v. d. Zande, and P. L. Mceuen, J. Vac. Sci. Technol. B 25, 2558 (2007). 21 K. L. Johnson, Contact Mechanics (Cambridge University Press, Cambridge, 1985), pp. 125–132.
22
E. Gnecco, R. Bennewitz, T. Gyalog, C. Loppacher, M. Bammerlin, E. Meyer, and H.-J. G¨untherodt, Phys. Rev. Lett. 84, 1172 (2000). 23 G. A. Tomlinson, Philos. Mag. 7, 905 (1929). 24 U. Komaragiri, M. R. Begley, and J. G. Simmonds, J. Appl. Mech. 72, 203 (2004).
035412-6