[5] B. E. A. Saleh and M. C. Teich, Fundamentals of Photonics, New York, John Wiley,. 1991, pp. 351, 444-449. [6] R. H. Fowler and L. W. Nordheim, Proc. R. Soc ...
14th International Symposium on Space Terahertz Technology
Effect of Finite Spectral Width on Photomixing In Resonant Laser-Assisted Field Emission Mark J. Hagmann Deseret Electronics Research Corporation, North Salt Lake, Utah
Abstract Resonant Laser-Assisted Field Emission is a new technology for wide-band tunable and pulsed terahertz sources. Simulations are made to determine the effect of laser linewidth on photomixing with this technique. The results show that single mode tunable laser diodes may be used in early prototypes.
Argument for unusually high bandwidth with this New Technology Photomixing with low-temperature-grown GaAs generates 1 1.1W at 1 THz, rolling off as lie at higher frequencies_ve from finite carrier lifetime in the semiconductor and 1/f2 from capacitive shunting [1]. Photomixing in laser-assisted scanning tunneling microscopy (STM) has a roll-off of only 1/f2 because the tip is closely coupled to the sample but there is no semiconductor [2]. It is reasonable to suppose that by moving the sample away from the tip in a STM, for laser-assisted field emission, the capacitive shunting of the tunneling junction would be eliminated so there would be no inherent roll-off of power with increasing frequency. This conclusion is supported by quantum simulations [3,4].
Advantages of THz sources using the new technology In addition to the potential for large bandwidth, simulations also suggest that output powers at the mW level are possible. Furthermore, field emission is insensitive to environmental temperature, ionizing radiation, and electrostatic discharge (ESD).
Method for the simulations allowing for finite spectral width We simulate photomixing as a stationary stochastic process in which the frequencies and phases of two sources of optical radiation are random variables changing at the ends of their respective periods of coherence. Lorentzian and Gaussian line shapes are modeled, to simulate different mechanisms for line broadening [5]. The center wavelength (X 0 ), linewidth (FWHM) and power flux density (P) for each radiation source are specified, and the coherence times are calculated. The metal for the field emitter tip and the applied static field are specified. The waveform of the field emission current is sampled with 5 points per cycle at the highest frequency in the incident radiation to exceed the Nyquist criterion at the second harmonics. An adiabatic solution of the Schrôdinger Equation is used to obtain these sample points [4], in which the FowlerNordheim expression for the potential barrier [6,7] is modified by superimposing the instantaneous value of the radiation field. Pseudorandom deviates are used to change the frequencies and phases of the two radiation sources as random variables at the ends of their respective periods of coherence. The one-sided power spectral density of the current
481
14th International Symposium on Space Terahertz Technology
is calculated with the current vs. time data partitioned into K seements, each with 21\ consecutive samples, for a total of K x 2 1\ points with no overlapping. Square windowing is applied to the data and the FFT is used to produce a periodogram estimate for each segment. Finally, the K periodogram estimates are averaged at each frequency to reduce the variance of the estimate [8]. Routines for the periodogram estimates are from [9]. The normalized current densities, which are reported, may be integrated over a frequency interval and multiplied by the DC current density to give the RMS current density in that frequency interval. Presentation of the data The first four figures show the normalized current density for photomixing with a 12 wim2 tungsten tip having an applied static field of 5 V/nm when each laser has P = 10 In each case the simulated period exceeds 100 times each coherence time. In Figs. la and lb, X0 = 670.00 and 668.51 nm, and FWHM = 0.1 nm. In these calculations K = 20 and N = 18 for 5,242,880 sample points to simulate 2.34 ns of the waveform. In Figs. 2a and 2b, Xo = 670.00 and 655.35 nm, and FWHM = 1.0 nm. In these calculations K = 40 and N = 17 for 5,242,880 sample points to simulate 2.29 ns of the waveform. Figure 2A shows peaks for the two lasers, the mixer (difference) frequency, the second harmonics for each laser, and the sum frequency. Each of these features is also present in the data for Fig. 1A, although some of the peaks are too close to be seen in the figure.
t: Frequency, Tilt
Fig. lb
Fig. la
Fig. 2b
Fig. 2a
482
14th International Symposium on Space Terahertz Technology
A series of simulations like those shown on the previous page was made to determine the linewidth for either 1 THz or 10 THz mixer outputs using radiation sources having different values of linewidth. In each case one source had a center wavelength of 670 nm, and the second was shifted to obtain the chosen mixer frequency. The results are shown as solid squares in Figs. 3 and 4. An analytical solution for mixing with a quadratic law device when the sources have Gaussian line shapes shows that the spectral a,m2 = Gi 2 + G22. The widths of the two input signals and the mixer output are related by solid line in each figure shows this result, marked as a "Semiclassical Approximation".
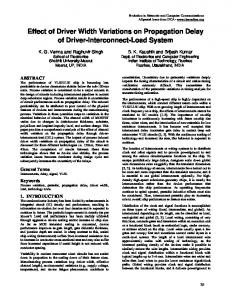
A ppfoxiination
PAIHM of eaQh uturce. nm
Fig. 4. Mixer output at 10 THz.
Fig. 3. Mixer output at 1 THz.
Discussion and conclusions The "semiclassical" relation for the linewidth is consistent with the simulations. We find no significant difference in the relation between the linewidth of the mixer output to the linewidths of the two radiation sources when Lorentzian or Gaussian line shapes are used consistently in the simulations. The adiabatic approximation used in the simulations may be corrected by a frequency-dependent multiplier increasing these values by as much as 40 dB [3,4]. We have not included the effects of instabilities and noise in these simulations. References: [1] E. R. Brown, F. W. Smith and K. A. McIntosh, J. Appl. Phys. 73 (1993) 1480. [2] L. Arnold, W. Krieger and H. Walther, J. Vac. Sci. Technol. A, 6 (1988) 466-469. [3] M. J. Hagmann, J. Vac. Sci. Technol. B13 (1995) 1348. [4] M. J. Hagmann, Ultramicroscopy 79 (1999) 115. [5] B. E. A. Saleh and M. C. Teich, Fundamentals of Photonics, New York, John Wiley, 1991, pp. 351, 444-449. [6] R. H. Fowler and L. W. Nordheim, Proc. R. Soc. London A 119 (1928) 173. [7] L. W. Nordheim, Proc. R. Soc. London A 121 (1928) 626. [8] P. M. T. Boersen, IEEE Trans. Instrum. Meas. 49 (2000) 766. [9] W. H. Press, S. A. Teukoisky, W. T. Vefterling and B. P. Flannery, Numerical Recipes in FORTRA N, New York, Cambridge University Press, 2 nd ed., 1992, pp. 269280, 542-551.
483