Effect of interparticle interaction on the low temperature oxidation of CO over size-selected Au nanocatalysts supported on ultrathin TiC films Luis K. Ono, Beatriz Roldán-Cuenya* Department of Physics, University of Central Florida, Orlando, FL 32816 E-mail:
[email protected]
Abstract
This work aims to get insight into the influence of interparticle interactions on catalysis. The low temperature CO oxidation is used as a model reaction. A strong dependence of the catalytic activity and stability of gold nanoparticles uniformly dispersed on polycrystalline TiC films was observed as a function of the interparticle distance. Two samples with similar height distributions (~2 nm), but with different average interparticle distances (~30 nm and ~80 nm), were synthesized using diblock copolymer encapsulation. Their chemical reactivity was investigated by temperature programmed desorption (TPD), and reactive coarsening and subsequent deactivation was observed for the sample with the smallest interparticle distance. The system with the largest average interparticle distance showed higher stability towards agglomeration and longer lifetime.
KEYWORDS: catalysis, Au nanoparticle, diblock copolymer, sintering, CO oxidation, interparticle interaction, size effects, XPS, TPD, AFM.
1
1. Introduction The heterogeneous catalytic chemistry of supported gold nanoparticles is a topical subject [1]. Haruta et al. demonstrated that the catalytic activity and selectivity of gold changes drastically when small nanoparticles are considered [2]. Highly dispersed Au nanoparticles were found to be excellent catalysts for a multitude of technological and environmentally important reactions including propene epoxidation [3], water-gas shift reactions [4], hydrogenation of CO2 and CO [5], the reduction of nitrogen oxides [6, 7], and other air purification applications [8, 9]. In the last two decades, considerable effort has been dedicated to the systematic investigation of the influence of the nanoparticle preparation method [10-19], size [2, 20], shape [2], and nanoparticle-metal oxide support interaction [2, 21] on catalytic performance. In order to get more in-depth knowledge of possible deactivation mechanisms [22-24], special attention has been devoted to the investigation of the dynamic character of a catalyst’s surface under “realworld” reaction conditions [25, 26]. Furthermore, the stability of catalysts has been systematically monitored by using differently spaced metal nanostructures and size- shapeconfining prefabricated supports [27-39]. In-situ scanning tunneling microscopy (STM) studies conducted in Goodman’s group [27] revealed modifications in the size and substrate distribution of gold and silver nanoparticles evaporated on TiO2(110) upon exposure to CO/O2 (2:1) and O2 at high pressure (13.33 mbar) and room temperature (RT). Because both gas dosing experiments resulted in Ostwald ripening and a comparable bimodal size distribution, the coarsening was attributed to Au-Au bond weakening induced by O2. It has been suggested that oxygen vacancies in the oxide support could play an important role in the reactivity of Au nanoparticles by facilitating the adsorption of molecular oxygen, thus promoting sintering [28]. Freund’s group [30] also identified structural
2
transformations when Au nanoparticles evaporated on FeO(111) films were exposed to CO/O2 and CO environments at elevated pressures (2 mbar). The authors concluded that CO exposure leads to the formation of mobile Au species by weakening the cluster-support bond. Work from Somorjai’s group [29, 31] demonstrated that neither the size, nor the interparticle distance of Pt nanoparticles (28 to 50 nm in diameter) produced by e-beam lithography on SiO2 and Al2O3 substrates were altered after the ethylene hydrogenation reaction. In addition, drastic cleaning procedures involving annealing at 573 K in NO2 (1×10⁻⁶ Torr) atmosphere and subsequent CO exposure (1×10⁻⁷ Torr) did not modify their morphology and substrate distribution [29, 31]. However, larger Pt nanoparticles (750 nm diameter) similarly prepared by Johansson et al. [32] showed disintegration upon exposure at 748 K to H2/O2 mixtures diluted in argon. Laurin et al. [33] also detected the formation of a ring of small nanoparticles around large (500 nm) Pd clusters supported on SiO2 upon exposure to O2 (~4×10⁻⁴ mbar) at 650 K and subsequent oxygen removal by CO. Our work intends to provide insight into whether the catalytic activity and stability of similarly-sized nanoparticles can be affected by interactions between the nanoparticles. Specifically, interactions that can be tuned by modifying the distance between the particles are here considered. In this study, we applied the method of micelle encapsulation in PS-P2VP diblock copolymers to the synthesis of hexagonally-ordered Au nanoparticle arrays [17, 18]. The main advantages of this preparation route are: i) in addition to excellent narrow size distributions, an outstanding control over the interparticle distance can be achieved, ii) due to the ordered cluster arrangement obtained, cluster mobility and chemically-induced coarsening processes can be monitored, iii) an homogenous substrate coverage over large surface areas can be obtained, iv) the active particles are not buried within the support, v) the residual chemicals from the
3
cluster synthesis method employed can be easily removed by a thermal or plasma treatment, minimizing thus poisoning of the catalyst. Samples containing gold nanoparticles with the same average height (and similar diameter) but different interparticle distances were synthesized by micelle encapsulation and deposited on ultrathin TiC films. Transition metal carbides such as TiC have great potential as catalytic supports in industrial applications [40] due to their high melting point, corrosion resistance [41], and proven reactivity with water, ethanol [42], methanol [43], and SO2 [42]. Furthermore, for certain chemical reactions, transition metal carbides have shown catalytic activities that are similar to those reported for Pt, Pd, Rh, and Ru [44]. Our temperature programmed desorption (TPD) results provide information on the influence of interparticle interactions on the catalytic activity of size-selected gold nanoparticles for low temperature CO oxidation. Insight into the influence of the cluster support on the morphological and reactivity changes observed is reported by comparing TiC and TiO2 substrates.
2. Experimental Gold nanoparticles were synthesized using polystyrene-block-poly(2-vynilpyridine) [PS(x)b-[P2VP](y), Polymer Source Inc.] as encapsulating agents, chloroauric acid (HAuCl4 ⋅3H2O) as metal seed, and toluene as solvent. The nanoparticle size can be tuned by changing the length of the polymer head (P2VP) and by modifying the concentration of the HAuCl4 salt. The interparticle distance is related to the length of the polymer tail (PS). A more detailed description of the preparation method can be found in Refs.[45-47]. Air-oxidized polycrystalline Ti films (15 nm-thick) e-beam evaporated on naturally oxidized n-Si(111) wafers were used as substrate. Substrate dip-coating into the gold polymeric solution at a speed of 1 µm/min resulted in a monolayer-thick film of monodispersed gold nanoparticles.
4
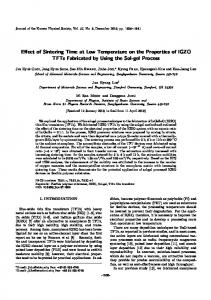
The ex-situ prepared samples were subsequently transferred into an ultrahigh vacuum system (UHV, SPECS GmbH) for electronic and chemical characterization. The UHV system is equipped with a scanning tunneling microscope (STM, Aarhus 150), a hemispherical electron energy analyzer and dual-anode (Al-Kα, 1486.6 eV and Ag-Lα, 2984.4 eV) monochromatic Xray source (SPECS, GmbH) for X-ray photoelectron spectroscopy (XPS), a differentiallypumped quadrupole mass spectrometer (QMS, Hiden Analytical, HAL 301/3F), and an electronbeam sample heating setup connected to a PID temperature controller (Eurotherm, 2048) for temperature programmed desorption (TPD) experiments. The TPD spectra were acquired using a linear heating ramp of β = 5 K/sec. The base pressure in this chamber is 1~2×10⁻¹⁰ mbar. The characterization of the sample morphology before and after polymer removal, as well as after TPD, was performed ex-situ by AFM in tapping-mode (Digital Instruments, Multimode). The encapsulating polymer was removed in-situ by annealing in UHV at 773 K for 30 min. This temperature is above the glass transition temperature of both PS (381 K) and P2VP (373 K) polymer blocks. A total of six different samples (four are shown here) containing nanoparticles with similar size (∼2nm) but two distinct interparticle distances were investigated. Two pairs of samples (with interparticle distances of ∼30 nm and ∼80 nm) were deposited on TiC, a third pair on TiO2. The synthesis parameters (molecular weights of the diblock copolymers used, relative metal to polymer core concentration ratios and annealing temperature) as well as the particle dimensions (height, diameter and interparticle distance) measured by AFM and STM are summarized in Table 1. The difference between the nanoparticle diameters measured by AFM and STM is attributed to tip-convolution effects present in the AFM images. In this work, the average nanoparticle height measured by AFM (and corroborated by STM) is used as the characteristic
5
size of the nanoparticles. It should be noted however, that our STM images (shown in Ref.[48]) provide evidence for non-spherical nanoparticle (pancake-like) shapes after the in-situ annealing.
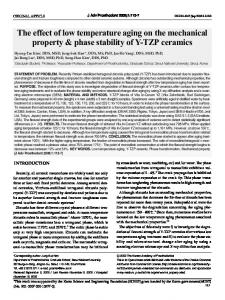
3. Results and discussion 3.1. Structural Characterization (AFM) Figure 1 displays AFM images from samples #1 (left column) and #2 (right column) before (a),(b) and after (c),(d) in-situ polymer removal. In both samples, the gold clusters were deposited on TiC films. Changes in the morphology of these samples after dosing with CO (0.6 L)/O2 (0.3 L) at low temperature (~95 K) and five (sample #1) and seventeen (sample #2) subsequent TPD cycles are shown in Fig. 1(e),(f), respectively. The AFM height and interparticle distance histograms obtained from the analysis of the images in Fig. 1(c),(d) (gold nanoparticles after polymer removal) are displayed in Fig. 2. After TPD, sample #1 shows reactive Ostwald ripening [Fig.1(e)], while neither the size nor the spatial distribution in sample #2 are significantly modified. The observed sintering cannot be exclusively attributed to thermal effects due to the reduced melting temperature [49-53] of our small nanoparticles (~600 K for 2 nm-large particles [54]), since the maximum TPD temperature (500 K) was below the annealing temperature used for polymer removal (773 K), where no agglomeration was observed, Fig. 1(c). Similar results were obtained in Goodman’s group when UHV-evaporated gold nanoparticles deposited on TiO2(110) were exposed to high pressure CO/O2 mixtures [27]. In previous studies, sintering was observed when the nanoclusters were exposed to high pressure gas mixtures at 300~450 K. However, our data demonstrate that similar drastic morphological changes can be obtained by dosing small Au-nanoparticle/TiC samples at low
6
temperature (95 K) with a low pressure mixture of CO/O2 (0.6 L/0.3 L, 10-8 mbar background pressure) and subsequent TPD annealing (β=5 K/s) to 500 K. The morphological changes observed for sample #1 might be related to the high sticking probability of CO [55] upon low temperature dosing. Interestingly, sample #2 which contains similarly sized nanoparticles but with larger interparticle distances (~80 nm versus ~30 nm for sample #1), did not show any sintering under the same TPD conditions. The reproducibility of our CO oxidation TPD results was tested on two additional samples prepared under identical conditions to samples #1 and #2 (same encapsulating polymers and metal salt/polymer core concentration ratio) and deposited on TiC. Here, in agreement with our previous observations, catalytic deactivation and coalescence was only observed in the sample where the interparticle distance was ~30 nm. In order to rule out gas-induced changes in the substrate’s chemical composition, morphology, and electronic structure as being responsible for the distinct coarsening behavior observed, additional CO oxidation experiments were conducted on two new samples (#3, #4), containing Au nanoparticles supported on ultrathin TiO2 films. The particles had similar sizes and interparticle distances as the ones described above (samples #1, #2, respectively), but the encapsulating polymer was removed by an in-situ O2 plasma treatment instead of high temperature annealing (773 K, see Table 1 for details). This treatment led to the oxidation of the polycrystalline Ti(15 nm)/Si(111) films used as substrate. The Au3+ compounds formed during the O2 plasma treatment were decomposed by annealing to 400 K. Figure 3 shows AFM images taken on these samples after the O2 plasma exposure [Fig.3 (a),(b)], and after subsequent CO oxidation [Fig.3 (c),(d)]. In analogy to our observations on the TiC-supported gold particles, CO/O2-induced cluster mobility and subsequent sintering was only detected in the Au/TiO2
7
sample with the smallest interparticle distance, Fig. 3(c). These results indicate that it is not the substrate, but rather the interparticle interactions, tunable by changing the interparticle distance, that are the key factors influencing the distinct coarsening behavior of both samples. To understand the observed behavior, two features need to be explained. First, sintering was detected after CO/O2 TPD experiments for samples with small interparticle spacing at temperatures well below 500 K. Since no sintering was observed after a previous cleaning step at a higher temperature (773 K), we conclude that the sintering is a chemically activated effect. Secondly, any proposed theory should account for the very different behavior observed for samples with identical particle size but different inter-particle spacing. The chemically activated coarsening observed could be due to Au-Au bond weakening upon CO interaction with subsequent diffusion of isolated Au atoms, or to the displacement of entire clusters along the substrate’s surface upon a chemically induced debilitation of the clustersupport bond. Different models have been proposed in the past to explain the mobility of small (< 20 atoms) and large (102 to 103 atoms, i.e. our case) 2D and 3D clusters. For small clusters, shortrange motion of single atoms from the periphery followed by cluster regrouping around the departed atoms is believed to be the dominant diffusion mechanism [56, 57]. Kellogg [58] also suggested that substrate surface atoms can play an active role in diffusion processes when it becomes energetically favorable for adatoms to displace substrate atoms from their lattice positions. For large 2D clusters supported on metallic substrates, a mechanism involving evaporation and condensation with a dynamic quasi-equilibrium of atoms leaving the cluster and reattaching to cluster edges has been suggested [59]. For Ag clusters supported on Ag(001), Wen
8
et al. [59] measured displacements as large as 10 nm over a period of several hours at room temperature. Based on the data shown in Fig. 1(e), it appears that the sintering in sample #1 (interparticle spacing ∼30 nm) involved significant mass transport over distances in excess of ten nanometers. This makes unlikely that CO/O2-induced adatom mobility could account for the observed migration. The gases only interact with gold atoms at the nanoparticle’s surface and perimeter sites, and those account for approximately 22 % of the total number of atoms present in a particle of our size (∼5361 in a 1.9 nm height and 7.8 nm diameter cluster) and shape (pancake-like). Furthermore, since significant bond weakening effects have been predicted upon CO exposure [60] only for atoms at steps and kinks (∼4.5 % of the total gold atoms in clusters of our dimensions), the formation of the large agglomerates observed here based on a model involving atom-by-atom diffusivity is unlikely. According to our experimental data, the option involving the movement of entire clusters upon detachment from the support seems to be the most plausible. Although our clusters are relatively large, and cluster mobility in general decreases with increasing cluster size, exceptions have been found [56, 61, 62]. In those cases, adding an extra atom to the cluster can strengthen the cluster bonds in detriment of the cluster-substrate bonds. A second observation that needs to be explained is the absence of sintering in the sample with large interparticle spacing (∼80 nm, sample #2). Since the average particle size in both samples was similar, the observed sintering cannot be explained by a ripening model that only considers the nanoparticle’s size. Because sample #1 appears to have undergone significant mass transport over distances in excess of 10 nm after five TPD cycles, it could be expected that seventeen successive TPD cycles on a sample with 80 nm interparticle spacing (sample #2)
9
would provide sufficient total displacement to result in agglomeration. However, no agglomeration was observed, showing that the longer required diffusion length alone does not explain the observations. These considerations lead us to conclude that the catalytic action in these samples is accompanied by significant interparticle interaction. Possible interactions include (a) a dynamic equilibrium with adatoms on the surface, where the concentration gradients are affected by the interparticle spacing, (b) having highly mobile and interacting CO molecules and chains actively involved in the transport of low coordinated gold atoms [63], (c) electrostatic interactions due to charge on the nanoparticles, (d) extended strain fields induced by lattice mismatch at the nanoparticle-substrate interface [64-67]. Based on the arguments given above, adatom mediated interactions are not expected to be sufficient to explain these observations. Further microscopic and theoretical studies are required to identify the mechanism of the coarsening demonstrated here for 2-nm large particles and its dependence on the interparticle distance.
3.2. Electronic characterization (XPS) The changes in the electronic and chemical composition of the nanoparticles and TiC support after UHV annealing and after CO oxidation were monitored by XPS. Figure 4(a) shows Au-4f core-level spectra of sample #1 as deposited (open circles), after annealing (solid line), and after TPD (dotted line). The XPS peaks at 86.2 eV and 89.9 eV measured before annealing were assigned to Au3+ (4f orbital) in AuCl4− [47]. After annealing in UHV, a doublet at binding energies (BE) of 84.8 eV and 88.5 eV was observed, indicating the complete reduction of the Au3+ complexes to Au0. The measured BEs are 0.8 eV larger than what is expected for bulk gold (84.0 eV and 87.7 eV). Such positive BE shifts are typical of small nanoparticles and are
10
commonly attributed to changes in the electronic structure of clusters with decreasing size (initial and final state effects) [46, 68, 69]. No change in the intensity of the Au signal was obtained after CO oxidation, indicating that Au has not been lost during the reaction. The small shift to lower BEs can be attributed to an increase in the nanoparticle size (reactive coarsening), in agreement with the AFM image in Figure 1(e). Figure 4(b) shows C-1s XPS spectra from the TiO2/Ti(15nm) substrate (top) and sample #1 (bottom) before and after annealing. The “as-transferred” substrate shows an adventitious carbon peak at about 285.3 eV (open circles). The intensity of this XPS feature decreases significantly after annealing (solid line) and a new peak appears at 281.8 eV, which is attributed to C-1s in TiC [70]. Before annealing, sample #1 shows a large peak at 285.6 eV, a BE close to a previously reported C-1s peak from P2VP (polymer head block) [71]. After annealing, the two peaks observed at 281.8 eV and 284.8 eV are attributed to the C-1s in TiC and PS (polymer tail), respectively [71]. Our XPS results indicate a stronger interaction of C atoms with Ti than with Au, and exclude the formation of gold carbide, in agreement with previous reports [70]. The oxidation state of the substrate before and after polymer removal by in-situ annealing was also monitored by XPS. Figure 4(c) contains data from the Ti-2p core levels of sample #1 (bottom) and the TiO2/Ti(15nm) substrate (top). Before any treatment (open circles), both samples show doublets corresponding to Ti0 (454 eV and 460 eV) and Ti4+ in TiO2 (459 eV and 464.7 eV) [40]. The presence of metallic Ti peaks indicates that only the top layers of the 15 nmthick Ti film used as substrate were oxidized during air exposure. After annealing to 773 K (solid lines), the BE shift observed is due to the formation of TiC (454.5 eV and 460.5 eV) [72]. This result is in agreement with the BE measured for the C-1s peak in Figure 4(b) indicating the
11
formation of TiC. Further quantitative analysis by integration of the Ti-2p and C-1s peaks provided evidence that TiC thin films have a 1:1 titanium-to-carbon surface stoichiometry. Cl/Au molar ratios as low as 0.0006 have been found to be poisonous in their effect on CO oxidation reactions [73]. Therefore, special attention has been paid to the possibility of residual chlorine in our samples. The XPS spectra show no detectable amounts of Cl-2s (270.0 eV) [47] from HAuCl4 after annealing. Our XPS results after the different sample treatments rule out sample contamination such as Cl from the HAuCl4 salt or N from the pyridine group in the P2VP polymer block as responsible for the dissimilar sintering behavior observed in our samples. Furthermore, no residual carbon was found in the O2-plasma treated samples, and a minimal residual C-signal (comparable for the two samples with different interparticle distance) was measured for the samples annealed in UHV, Fig. 4(b).
3.3. Chemical reactivity for low temperature CO oxidation (TPD) The reactivity of the gold nanoparticles for low temperature CO oxidation, and in particular the relationship between sample morphology (particle size and interparticle distance) and catalytic activity, was investigated by TPD. Figure 5 shows CO2 TPD data from samples #1 (a) and #2 (b) (~30 nm and ~80 nm interparticle distances, respectively). For cross-check comparison TPD data from two TiC ultrathin films are also provided. These films were prepared by dip-coating TiO2/Ti(15 nm) substrates into gold-free polymeric solutions PS(8200)P2VP(8300) for sample #1 and PS(81000)-P2VP(14200) for sample #2. Both samples were subsequently annealed in UHV to 773 K for 30 min.
12
The samples were dosed at ~95 K, first with CO (0.6 L) and subsequently with O2 (0.3 L), and several successive TPD measurements with a linear heating ramp of β = 5 K/s were carried out. In order to ensure that contamination coming from the sample-holder/sample assembly is not the origin of the CO2 desorption signals observed, a “dry” TPD cycle (sample annealing without gas dosing) was measured from 95 to 500 K. This TPD run provides our background CO2 signal. The TiC substrates were found to be poor catalysts for the oxidation of CO at low temperature, Fig. 5(a),(b)(solid lines). Additionally, no significant CO2 desorption was observed for samples #1 and #2 before gas dosing, Fig. 5(a),(b) (open circles). Upon CO/O2 exposure, the first TPD spectrum of both samples, Fig. 5 (a),(b)(solid circles), shows a distinct CO2 desorption peak at ~120 K. Subsequent CO oxidation reactions on sample #1, Figure 5(a) [squares (3rd) and triangles (5th)] show deactivation and a shift of the first CO2 production peak to a higher temperature (146 K). A second desorption feature at a temperature of ~150 K is also observed for sample #2. Because our XPS data reveal that gold has not been lost in the course of the reaction, the deactivation observed is attributed to the reactive coarsening displayed in Figure 1(e). Sample #2 did not show any deactivation up to at least seventeen cycles of CO oxidation, Fig. 5(b) [solid circles (1st), triangles (10th) and open squares (17th)], in accordance with the lack of agglomeration measured after the reaction by AFM, Figure 1(f). As previously reported by other authors [74-76], the first peak in the TPD spectra (~120 K) is assigned to CO adsorption and oxidation on kinks and step edges at the surface of the Au nanoparticles. The second peak (~150 K) is tentatively attributed to CO oxidation on gold atoms at the nanoparticle-support interface [74]. For sample #2, where the two TPD features were clearly separated, the relative contribution (area under the respective TPD peaks) of the first (step-kinks) versus the second (interface) desorption peak is about 3:1. Interestingly, this ratio is
13
in agreement with the relative concentration of gold atoms at steps/kinks (343) versus gold atoms at the perimeter (115), ∼3, of a model gold nanoparticle with a diameter of 10.5 nm (our STM value) and a height of 1.9 nm (AFM) containing a total of 9941 atoms. For this calculation, a truncated gold nanoparticle was considered with a flat (111) top terrace. Freund’s group previously demonstrated not just a size-dependency in the CO adsorption by Au nanoparticles supported on Al2O3, but also the existence of two different adsorption sites [75]. Similar conclusions were drawn by Yoon et al. based on a study of CO oxidation on Au8 clusters deposited on MgO(001) [74], where CO2 desorption temperatures of 140 K and 280 K were recorded. Here, the two desorption peaks observed were attributed to CO2 production from Au clusters having O2 bound either to the top facet of the cluster (140 K), or to the perimeter of the cluster (280 K) [74]. However, Gottfried et al. [76] observed three distinct desorption states for CO2 ( ρ1 = 67 K, ρ2 = 105 K, and ρ3 = 175 K) on an O(1.3 ML)-covered Au(110)-(1x2) crystal dosed with CO (1x10⁻⁶ mbar) at 28 K. According to this work, the two states that we observe may also originate exclusively from the Au ensemble. Apart from the deactivation behavior, another main difference between the TPD spectra obtained for both samples is the width (FWHM) of the first TPD peak observed at ~120 K. Sample #1 displayed a broader FWHM (22 K) compared to sample #2 (9 K). Additionally, an extra broad feature around 338 K is observed in the 1st ~ 3rd TPD spectra of sample #1. However, this peak does not appear in the subsequent spectra of the same sample, or on those of sample #2. For the last sample, whose structure/morphology has been proven to be stable (static), no significant changes in the successive TPD spectra were observed. Our work emphasizes the importance of considering dynamic modifications in the sample’s morphology for the correct interpretation of TPD spectra from highly dispersed nanoparticles.
14
4. Conclusions The present work provides insight into the influence of interparticle and nanoparticle-support interactions on catalysis using CO oxidation as a model reaction system. Our synergistic TPD, AFM, and XPS investigations revealed that the catalytic activity of similarly-sized (~2 nm) TiCsupported Au nanoparticles depends on the interparticle distance. Furthermore, reactive coarsening-mediated deactivation only occurs when the interparticle distance is small (~30 nm). Interestingly, morphological changes have been observed in our nanoparticle samples upon low pressure (~10-8 mbar) gas dosing at 95 K. The results obtained in this study emphasize the importance of taking into account not just the nanoparticle size, but also their distribution on the substrate surface in order to optimize activity and stability (lifetime) of the nanocatalysts.
Acknowledgements Acknowledgement is made to the National Science Foundation (NSF-CAREER award, 0448491) and the Donors of the American Chemical Society Petroleum Research Fund (PRF-G award, 42701-G5) for support of this research. The authors also thank Prof. Kader Kara for helpful scientific discussions, Karlo Kitanovski and David Clark for technical support.
15
References [1] S. Chretien and H. Metiu, Catal. Lett. 107 (2006) 143. [2] M. Haruta, Catal. Today 36 (1997) 153. [3] A.K. Sinha, S. Seelan, S. Tsubota and M. Haruta, Top. Catal. 29 (2004) 95. [4] Q. Fu, W.L. Deng, H. Saltsburg and M. Flytzani-Stephanopoulos, Appl. Catal., B 56 (2005) 57. [5] P. Claus, Appl. Catal., A 291 (2005) 222. [6] M. Haruta, Chem. Rec. 3 (2003) 75. [7] M.A. Debeila, N.J. Coville, M.S. Scurrell and G.R. Hearne, Appl. Catal., A 297 (2006) 247. [8] A.C. Gluhoi, S.D. Lin and B.E. Nieuwenhuys, Catal. Today 90 (2004) 175. [9] J.R. Mellor, A. Palazov, B.S. Grigorova, J.F. Greyling, K. Reddy, M.P. Letsoalo and J.H. Marsh, Catal. Today 72 (2002) 145. [10] G.R. Bamwenda, S. Tsubota, T. Nakamura and M. Haruta, Catal. Lett. 44 (1997) 83. [11] A. Wolf and F. Schuth, Appl. Catal. A 226 (2002) 1. [12] T. Tsirlin, J. Zhu, J. Grunes and G.A. Somorjai, Top. Catal. 19 (2002) 165. [13] A.I. Kozlov, A.P. Kozlova, H.C. Liu and Y. Iwasawa, Appl. Catal. A 182 (1999) 9. [14] W.B. Li, M.F. Zhu, X.Q. Wang, X.P. Zhou, K. Naka and Y. Chujo, J. Macromol. Sci. B 45 (2006) 549. [15] K. Fukui, S. Sugiyama and Y. Iwasawa, Phys. Chem. Chem. Phys. 3 (2001) 3871. [16] Z. Yan, S. Chinta, A.A. Mohamed, J.P. Fackler Jr. and D.W. Goodman, Catal. Lett. 111 (2006) 15. [17] G. Kastle, et al., Adv. Func. Mater. 13 (2003) 853.
16
[18] R. Glass, M. Arnold, J. Blummel, A. Kuller, M. Moller and J.P. Spatz, Adv. Func. Mater. 13 (2003) 569. [19] N. Zheng and G.D. Stucky, J. Am. Chem. Soc. (2006) in press. [20] R. Meyer, C. Lemire, S.K. Shaikhutdinov and H.J. Freund, Gold Bull. 37 (2004) 72. [21] S. Arrii, F. Morfin, A.J. Renouprez and J.L. Rousset, J. Am. Chem. Soc. 126 (2004) 1199. [22] C.H. Bartholomew, Appl. Catal., A 212 (2001) 17. [23] M. Azar, V. Caps, F. Morfin, J.L. Rousset, A. Piednoir, J.C. Bertolini and L. Piccolo, J. Catal. 239 (2006) 307. [24] B. Kasemo, S. Johansson, H. Persson, P. Thormahlen and V.P. Zhdanov, Top. Catal. 13 (2000) 43. [25] G.A. Somorjai, Appl. Surf. Sci. 121 (1997) 1. [26] S. Helveg and P.L. Hansen, Catal. Today 111 (2006) 68. [27] X.F. Lai and D.W. Goodman, J. Mol. Catal. A: Chem. 162 (2000) 33. [28] A. Kolmakov and D.W. Goodman, Surf. Sci. 490 (2001) L597. [29] P.W. Jacobs, F.H. Ribeiro, G.A. Somorjai and S.J. Wind, Catal. Lett. 37 (1996) 131. [30] D.E. Starr, S.K. Shaikhutdinov and H.J. Freund, Top. Catal. 36 (2005) 33. [31] J. Grunes, J. Zhu, E.A. Anderson and G.A. Somorjai, J. Phys. Chem. B 106 (2002) 11463. [32] S. Johansson, L. Osterlund and B. Kasemo, J. Catal. 201 (2001) 275. [33] M. Laurin, V. Johanek, A.W. Grant, B. Kasemo, J. Libuda and H.J. Freund, J. Chem. Phys. 122 (2005) 84713. [34] K.H. Lee and E.E. Wolf, Catal. Lett. 26 (1994) 297. [35] S. Johansson, E. Fridell and B. Kasemo, J. Vac. Sci. Technol. A 18 (2000) 1514. [36] G. Rupprechter and H.J. Freund, Top. Catal. 14 (2001) 3.
17
[37] G.A. Somorjai, A.M. Contrenas, M. Montano and R.M. Rioux, PNAS 103 (2006) 10577. [38] M. Kralik, V. Kratky, M. De Rosso, M. Tonelli, S. Lora and B. Corain, Chem. Eur. J. 9 (2003) 209. [39] R. Rajagopalan, A. Ponnaiyan, P.J. Mankidy, A.W. Brooks, B. Yi and H.C. Foley, Chem. Commun. (2004) 2498. [40] A. Mani, P. Aubert, F. Mercier, H. Khodja, C. Berthier and P. Houdy, Surf. Coat. Tech. 194 (2005) 190. [41] D.J. Siegel, L.G. Hector and J.B. Adams, Surf. Sci. 498 (2002) 321. [42] Z.Y. Chen, S.S. Perry, A. Savan, P.M. Adams and S.V. Didziulis, J. Vac. Sci. Technol. A 23 (2005) 234. [43] P. Frantz, S.V. Didziulis, L.C. Fernandez-Torres, R.L. Guenard and S.S. Perry, J. Phys. Chem. B 106 (2002) 6456. [44] J. Brillo, R. Sur, H. Kuhlenbeck and H.J. Freund, Surf. Sci. 397 (1998) 137. [45] T.F. Jaramillo, S.H. Baeck, B. Roldan Cuenya and E.W. McFarland, J. Am. Chem. Soc. 125 (2003) 7148. [46] B. Roldan Cuenya, S.H. Baeck, T.F. Jaramillo and E.W. McFarland, J. Am. Chem. Soc. 125 (2003) 12929. [47] H.G. Boyen, et al., Science 297 (2002) 1533. [48] A. Naitabdi, L.K. Ono and B. Roldan Cuenya, Appl. Phys. Lett. 89 (2006) 43101. [49] K. Dick, T. Dhanasekaran, Z.Y. Zhang and D. Meisel, J. Am. Chem. Soc. 124 (2002) 2312. [50] C.L. Cleveland, W.D. Luedtke and U. Landman, Phys. Rev. B 60 (1999) 5065. [51] K.K. Nanda, Eur. J. Phys. 19 (1998) 471. [52] K.K. Nanda, S.N. Sahu and S.N. Behera, Phys. Rev. A 66 (2002) 013208.
18
[53] S.C. Vanithakumari and K.K. Nanda, J. Phys. Chem. B 110 (2006) 1033. [54] P. Buffat and J.P. Borel, Phys. Rev. A 13 (1976) 2287. [55] J.M. Gottfried, K.J. Schmidt, S.L.M. Schroeder and K. Christmann, Surf. Sci. 536 (2003) 206. [56] S.C. Wang and G. Ehrlich, Surf. Sci. 239 (1990) 301. [57] C.L. Liu and J.B. Adams, Surf. Sci. 268 (1992) 73. [58] G.L. Kellogg, Appl. Surf. Sci. 87-8 (1995) 353. [59] J.M. Wen, S.L. Chang, J.W. Burnett, J.W. Evans and P.A. Thiel, Phys. Rev. Lett. 73 (1994) 2591. [60] F. Mehmood, A. Kara, T.S. Rahman and K.P. Bohnen, Phys. Rev. B (2006) in press. [61] P.J. Feibelman, Phys. Rev. Lett. 58 (1987) 2766. [62] K. Stolt, W.R. Graham and G. Ehrlich, J. Chem. Phys. 65 (1976) 3206. [63] B.G. Briner, M. Doering, H.P. Rust and A.M. Bradshaw, Science 278 (1997) 257. [64] A. Masson, J.J. Metois and R. Kern, Surf. Sci. 27 (1971) 463. [65] R. Kern, A. Masson and J.J. Metois, Surf. Sci. 27 (1971) 483. [66] C.R. Henry, C. Chapon and B. Mutaftschiev, Thin Solid Films 46 (1977) 157. [67] C. Chapon and C.R. Henry, Surf. Sci. 106 (1981) 152. [68] M.G. Mason, Phys. Rev. B 27 (1983) 748. [69] G.K. Wertheim, S.B. DiCenzo and S.E. Youngquist, Phys. Rev. Lett. 51 (1983) 2310. [70] T. Tachibana, B.E. Williams and J.T. Glass, Phys. Rev. B 45 (1992) 11968. [71] G. Beamson and D. Briggs (Ed.), High Resolution XPS of Organic Polymers - The Scienta ESCA300 Database (John Wiley & Sons, New York, 1992). [72] D.M. Phase and V. Sathe, J. Phys. D: Appl. Phys. 37 (2004) 1696.
19
[73] P. Broqvist, L.M. Molina, H. Gronbeck and B. Hammer, J. Catal. 227 (2004) 217. [74] B. Yoon, H. Hakkinen, U. Landman, A.S. Worz, J.M. Antonietti, S. Abbet, K. Judai and U. Heiz, Science 307 (2005) 403. [75] S.K. Shaikhutdinov, R. Meyer, M. Naschitzki, M. Baumer and H.J. Freund, Catal. Lett. 86 (2003) 211. [76] J.M. Gottfried, K.J. Schmidt, S.L.M. Schroeder and K. Christmann, Surf. Sci. 525 (2003) 197.
20
Sample
Substrate
PS(x)/P2VP(y) Molecular weight (g/mol)
HAuCl4 / P2VP Ratio
Sample Treatment
Interparticle distance (nm)
Average particle height (nm)
Average particle diameter (nm)
AFM
STM
AFM
STM
AFM
#1
TiC
8300/8200
0.1
773K(0.5 h)
2.1±0.4
1.9±0.1
14±3
7.8±0.2
27±6
#2
TiC
81000/14200
0.2
773 K(0.5 h)
1.9±0.5
2.8±0.2
18±3
10.5±0.5
78±12
#3
TiO2
8300/8200
0.1
1.5±0.4
−−−
16±3
−−−
25±5
#4
TiO2
81000/14200
0.2
3.2±0.8
−−−
30±5
−−−
52±8
O2 Plasma (1 h) 400 K(5 min) O2 Plasma (1 h) 400 K(5 min)
Table 1. Synthesis parameters and average height, diameter and interparticle distance of Au nanoparticles supported on ultrathin TiC and TiO2 films. The AFM and STM measurements were taken after polymer removal by in-situ annealing.
21
FIGURE CAPTIONS Figure 1. Tapping mode AFM images of size-selected Au nanoparticles supported on ultrathin TiC films. The images from sample #1 (left column) and #2 (right column) were obtained after dip-coating (a),(b), annealing in UHV to 773 for 30 min, (c),(d), and after five and seventeen (CO/O2) TPD cycles (e),(f), respectively. The height scales are (a) z = 0~15 nm, (b) z = 0~10 nm, (c) z = 0~13nm, (d) z = 0~30 nm, (e) z = 0~9 nm, (f) z = 0~10 nm. Figure 2. Height distribution (a),(b) and interparticle distance (c),(d) of samples #1 (left column) and #2 (right column) obtained from AFM images taken after polymer removal. The histograms are approximated by Gaussian distributions (solid curves). Figure 3. Tapping mode AFM images of size-selected Au nanoparticles supported on ultrathin polycrystalline TiO2 films. The images from sample #3 (left column) and #4 (right column) were obtained after O2 plasma-exposure (90 W, 60 min) and subsequent annealing to 400 K (a),(b). Micrographs (c),(d) were acquired after five successive CO (0.6 L) + O2 (0.3L) TPD cycles. The height scales are (a) z = 0~8 nm, (b) z = 0~15 nm, (c) z = 0~6 nm, and (d) z = 0~20 nm. Figure 4. XPS (Al-Kα = 1486.6 eV) core-level spectra (Au-4f, C-1s, Ti-2p) of sample #1 (a) and (b),(c) (bottom), and a gold-free TiO2/Ti(15nm)/Si(111) substrate (b),(c) (top). For both samples the XPS measurements were conducted at RT before (open circles), and after annealing to 773 K (solid line). The vertical lines indicate the BEs of Au0 and Au3+ in AuCl4- compound (a), adventitious C, C in TiC, and C in PS-P2VP (b), and metallic Ti, Ti4+ in TiO2 and TiC (c). Figure 5. CO2 TPD spectra of (a) sample #1, ~30 nm interparticle distance, and (b) sample #2, ~80 nm interparticle distance, measured in repeated cycles under the same dosing conditions CO(0.6 L) + O2(0.3 L) at ~95 K and heated with a linear ramp of β = 5 K/sec. A blank TPD spectrum (open circles) was taken without the exposure of reactive gases for reference. Five
22
cycles of CO oxidation were run on sample #1 and the corresponding first (solid circles), third (squares), fifth (triangles) TPD spectra are shown. On sample #2, seventeen cycles of CO oxidation were run and three of them are shown first (solid circles), tenth (triangles), and seventeenth (open squares). The solid lines indicate the CO2 signal, after dosing with gases, from gold-free TiC substrates synthesized by dip-coating the TiO2/Ti(15nm) substrate with (a) PS(81000)-b-P2VP(14200) and (b) PS(8200)-b-P2VP(8300) polymers and following annealing in UHV. They represent the polymers used for synthesizing the samples #1 and #2, respectively.
23
Sample #1
Sample #2
(b)
(a)
200nm
200nm
(d)
(c)
200nm
200nm
(f)
(e)
200nm
200nm
Figure 1 - Ono et al., Catal. Lett.
24
Sample #1
(a)
Sample #2
2.1 ± 0.4 nm
120
60
0 0
90
30
Number of Particles
Number of Particles
180
1
2 3 4 Height (nm)
(b)
20
10
0 0
5
20
(c)
1.9 ± 0.5 nm
1
2 3 4 Height (nm)
5
(d)
Frequency
Frequency
15
60
27 ± 6 nm 30
0 0
20
40
60
80
100
Interparticle Distance (nm)
10
78 ± 12 nm
5 0 0 20 40 60 80 100 Interparticle Distance (nm)
Figure 2 - Ono et al. , Catal. Lett.
25
Sample #3
(a)
Sample #4
(b)
200nm
(c)
200nm
(d)
200nm
200nm
Figure 3 - Ono et al., Catal. Lett.
26
(a)
Intensity (arb.units)
Au
After TPD
Ti
C-adventitious
Au
As deposited
Annealed
Ti (2p)
(b)
C (1s)
3+
Intensity (arb.units)
0
TiO2/Ti(15nm)
P2VP
TiC
PS
0
TiO2
(c)
TiO2/Ti(15 nm)
Intensity (arb. units)
Au (4f)
Sample #1
Sample #1
TiC
80
85 90 Binding Energy (eV)
280
282 284 286 288 Binding Energy (eV)
290
Figure 4 - Ono et al. , Catal. Lett.
27
452 456 460 464 Binding Energy (eV)
468
10
(a)
CO2 Partial Pressure (10
-10
Torr)
118 K
5 338K
146 K
0 100
200 300 Temperature (K)
400
4 115 K
CO2 Partial Pressure (10
-10
Torr)
(b)
2
150 K
0 100
200 300 Temperature (K)
400
Figure 5 - Ono et al., Catal. Lett.
28