I NTERNATIONAL J OURNAL OF C HEMICAL R EACTOR E NGINEERING Volume 10
2012
Article A16
Effect of Lump Partitioning on the Accuracy of a Commercial Vacuum Gas Oil Hydrocracking Model Sepehr Sadighi∗
Arshad Ahmad†
Seyed Kamal Masoudian‡
∗
Institute of Hydrogen Economy, Faculty of Chemical Engineering, Universiti Teknologi Malaysia, sadighi
[email protected] † Institute of Hydrogen Economy, Faculty of Chemical Engineering, Universiti Teknologi Malaysia,
[email protected] ‡ Research Institute of Petroleum Industry,
[email protected] ISSN 1542-6580 DOI: 10.1515/1542-6580.2616 c Copyright 2012 De Gruyter. All rights reserved.
Authenticated |
[email protected] Download Date | 6/11/12 6:30 AM
Effect of Lump Partitioning on the Accuracy of a Commercial Vacuum Gas Oil Hydrocracking Model Sepehr Sadighi, Arshad Ahmad, and Seyed Kamal Masoudian
Abstract In an industrial hydrocracking plant, except to the reactor, the separation section can affect the accuracy of the developed mathematical model. In this study, two combined-bed six and seven-lump kinetic models for the hydrocracking of vacuum gas oil in a real refinery are developed and their accuracies for the prediction of product yields are compared. In the six-lump model, the engaged components are selected according to the actual products of the plant, but the seven-lump one is included of lumps which are partitioned based on the specified initial and final boiling points. For both approaches, a complete kinetic network with the catalyst-decay functions is considered. It is found that over a 17-month period of operation from the start of run, the average absolute deviation (AAD%) of the six-lump and the seven-lump models for the yield prediction are 20.51% and 5.21%, respectively for all products. Additionally, the sum of residuals for the seven-lump model has been appreciably decreased in comparison to the six-lump one. Therefore, it is confirmed that partitioning of the products to the lumps with specific boiling points can acceptably decrease the deviation of the prediction. So it is conclusive that including the operation of the separation section in commercial models can effectively increase the accuracy of the model and smooth the prediction error. KEYWORDS: hydrocracking, lump kinetic model, vacuum gas oil, partitioning, separation
Authenticated |
[email protected] Download Date | 6/11/12 6:30 AM
Sadighi et al.: Lump Partitioning for a Commercial Hydrocracking Model
1
1. Introduction In a modern refinery, hydrocracking is complementary to catalytic cracking: polyaromatic compounds can be transformed by hydrocracking which cannot be accomplished with catalytic cracking (Gary and Handwerk, 2001). Moreover, the great versatility of hydrocracking makes it possible to equilibrate product supply according to the demand. Oil fractions are (hydro) processed in the refinery primarily to manufacture the transportation fuels that are essential to our society. Typical of industrial processes, an optimal operation is required to guarantee profitability and such a task necessitates the use of process models. These models are used to predict the product and also they are useful for sensitivity analysis. Therefore, the effect of operating parameters such as reactor temperature, pressure, space velocity and others on product yields can be understood. However, the complexity of hydrocracking feed makes it extremely difficult to characterize and describe its kinetics at a molecular level. One way of mitigating the problem is to partition of species into equivalent classes and then each class is assumed to be as an independent entity. This approach, called lumping technique, is attractive for kinetic modeling of complex mixtures such as VGO, because of its simplicity (Ancheyta et al., 2005). However, it should be mentioned that lumped kinetics have the following major disadvantages: (1) they are strongly dependant to feedstock and catalyst; (2) they are only valid for the range of studied operating conditions, and also (3) if bench-scale trickle-bed reactors are used for the experimentation, reaction kinetics is affected by hydrodynamics and mass transfer processes. If any of those parameters is changed, then the model must be refitted on the basis of a new experimental program. The major lumping methods interested in hydrocracking are continuum theory of lumping and discrete lumping approaches. In the former, the reactive mixture is considered to form a continuum mixture with respect to its properties such as boiling point, molecular weight, carbon number or chemical species (Basak et al., 2004; Elizalde et al., 2009). But, in the discrete lumping approach, the reaction network is reduced to the limited number of reactions among the lumped components. The lumps, based on types of compounds present in feedstock and products (e.g., lumps of diesel, kerosene, gasoline, etc.), are often defined by boiling point ranges. To make the lumped models more accurate, it is possible to choose as many lumps as possible. But, the more lumps a model includes, intrinsically the more kinetic parameters need to be estimated, consequently more experimental information is required. According to the discrete lumping approach, there are many researches in which hydrocracking process was modeled with three-lump (Yui & Sanford, 1989; Callejas & Martinez, 1999; Aoyagi et al., 2003), four-lump (Aboul-Gheit,
Authenticated |
[email protected] Download Date | 6/11/12 6:30 AM
Published by De Gruyter, 2012
2
International Journal of Chemical Reactor Engineering
Vol. 10 [2012], Article A16
1989; Valavarasu et al., 2005), five-lump (Ancheyta et al., 1999; Almeida & Guirardello, 2005; Singh et al., 2005; Sadighi et al., 2010c) and six-lump (Sadighi et al., 2010b) partitions. Because in the VGO hydrocracking process the deactivation of catalyst is inevitable, a proper deactivation model is essentially needed for the estimation of remaining life of the catalyst. So, lumping models including the catalyst deactivation can be more applicable to make the model closer to an industrial scenario. Some lumping models for the cracking processes have been proposed in which the importance of this phenomenon has been considered (Ancheyta et al., 1999; Basak et al., 2004; Bollas et al., 2007; Sadighi et al., 2010a). In this work, a practical kinetic model with seven lumps, namely, dry gases, light and heavy naphtha, kerosene, light diesel, heavy diesel and vacuum gas oil (VGO) is developed and it is compared with the conventional six-lump model. The yields of all main products in an industrial hydrocracking unit are calculated whilst catalyst deactivation is taken into account. In this lumping approach, which has more lumps than similar six-lump model, recycle feed and fresh feed are lumped into three discrete components, i.e., light diesel, heavy diesel and VGO. It is discussed that this method can effectively increase the accuracy of the yield prediction.
2. Data gathering 2.1. Hydrocracking process A commercial first-stage hydrocracking unit is chosen as a case study. This unit is designed to hydroconvert 29,000 barrel per day of a mixture of vacuum distillates; the composition of the fresh feed can vary slightly with time from start of run (SOR) to middle of run (MOR). The inlet feed to the reactor, i.e., combined feed is a mixture of vacuum distillates and unconverted oil called offtest. The latter is recycled from the separation section at the end of the process. The combined feed is mixed with hydrogen and heated before entering the reactor. As the modeling strategy is a lumping of feed and products, it is assumed that only the chemical hydrogen consumption for hydrocracking (HDC) and hydrogenation (HDA) reactions is added to the fresh VGO to satisfy the mass balance; therefore desulfurization and denitrification ones are neglected. So, the feed and products are assumed to be free of sulfur and nitrogen. The hydrocracking section has two similar parallel reactors, called trains, each of them has four separate beds with a total amount of loaded catalyst around 134,000 kg. The percentages of loaded catalyst in Beds 1, 2, 3 and 4 are 13%, 24%, 31% and 30%, respectively. The first bed is charged with the hydrotreating catalyst, and other beds are charged with the hydrocracking one.
Authenticated |
[email protected] Download Date | 6/11/12 6:30 AM
Sadighi et al.: Lump Partitioning for a Commercial Hydrocracking Model
3
Because the loaded catalyst, feed flow rate and inlet temperature for each train are approximately similar, only one of them is modeled. So, only half of the feed flow rate and also product rates are considered for the modeling.
2.2. Operating conditions The catalyst life is about 2.5 years from the SOR to the end of run (EOR). During this period, liquid hourly space velocity (LHSV) are held constant at about 0.53 hr-1. To compensate of catalyst deactivation from the SOR to the EOR, the weight average bed temperature (WABT) of process is increased gradually from 410 to 425°C. The loaded catalysts are amorphous types that their specifications are displayed in Table 1. Table 1. Catalyst specifications of the understudy hydrocracking process Function Hydrocracking Hydrotreating Type Ni/W Ni/Mo Shape Extruded trilobe Extruded trilobe Nominal Size, mm (in) 1.3 (1/20) 2.62 (1/10) Chemical Composition, wt% dry basis Nickel oxide (NiO) 2 to 4.8 4.5-5.5 Tungsten oxide (WO3) 20 to 25 Molybdenum (MoO3) 19-22 Al2O3 30 to 43 SiO2 28 to 32 Fe 0.04 Max Physical Properties 2/ Surface Area (m gr) 228-255 160 Bulk density (kg/m3) 650-785 760-805 Average length (mm) 3.2 to 5.2 4.5to 5.7
3. Mathematical Model This work considers wild VGO (WV), wild diesel (WD), wild kerosene (WK), wild heavy naphtha (WHN), wild light naphtha (WLN) and gas for the six-lump model to match actual products leaving the separation section of the industrial hydrocracking, and also VGO (F), heavy diesel (HD), light diesel (LD), kerosene (PK), heavy naphtha (PHN), light naphtha (PLN) and gas (G) for the seven-lump
Authenticated |
[email protected] Download Date | 6/11/12 6:30 AM
Published by De Gruyter, 2012
4
International Journal of Chemical Reactor Engineering
Vol. 10 [2012], Article A16
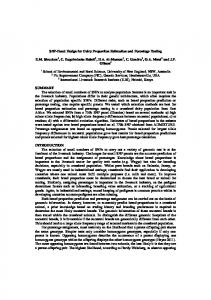
model to match all products. Figures 1a and 1b show the reaction pathways associated with the six-lump and the seven-lump strategies, respectively.
Figure 1. (a) The six-lump kinetic model (Sadighi et al., 2010a) (b) The complete seven-lump kinetic model In this research, the applied kinetic model for the under study commercial plant is according to the combined-bed model developed for a pilot scale reactor (Sadighi et al., 2012) that is similarly loaded with hydrotreating and hydrocracking catalysts. But to make the model applicable for an industrial plant, deactivation of catalyst is also included in the model. Therefore for each reaction, a kinetic expression ( R j ) is formulated as the function of the mass concentration of the reactants ( C ), a deactivation function ( ϕ ) and kinetic parameters ( k 0 and E ). The reaction of VGO hydrocracking is considered to be second order (Sadighi et al., 2010a). It is well known that the deactivation of a catalyst is mainly caused by surface coking, so catalyst deactivation is considered as a function of time and an exponential law ( ϕ ). The latter is depended to the decay constant ( α ) and the catalyst life ( t c ). In this study, a selective deactivation is applied, in which different decay parameters are used for all possible reaction paths. According to the above assumptions, the kinetic constants of the model can be expressed as: Wild VGO (WV) or VGO (F): − EVj kVj = ϕVj k 0Vj exp( ) RT
Authenticated |
[email protected] Download Date | 6/11/12 6:30 AM
(1)
Sadighi et al.: Lump Partitioning for a Commercial Hydrocracking Model
5
where V in Eq. 1 represents WV or F, and j represents all products lighter than the V lump; Heavy Diesel ( HD ), Light Diesel ( LD ) or Wild Diesel ( WD ): − E Dj ' k Dj ' = ϕ Dj ' k 0 Dj ' exp( ) (2) RT where D in Eq. 2 represents WHD, WLD or WD, and j ' represents all products lighter than the D lump;
Wild Kerosene (WK) or Kerosene (PK): − E Kj ''' ) (3) k Kj ''' = ϕ Kj ''' k 0 Kj ''' exp( RT where K in Eq. 3 represents WK or PK, and j ' ' ' represents all lighter products than the K lump; Wild Heavy Naphtha (WHN) or Heavy Naphtha (PHN): − E HNj '''' ) (4) k HNj ''' = ϕ HNj '''' k 0 HNj '''' exp( RT where HN in Eq. 4 represents WHN or PHN, and j ' ' ' ' represents all lighter products than heavy HN lump; and Wild Light Naphtha (WLN) or Light Naphtha (PLN): − E LNG k LNG = ϕ LNG k 0 LNG exp( ) RT where LN in Eq. 5 represents WLN or PLN.
(5)
In Equations 1 to 5, T and R are the absolute value of the WABT and the ideal gas constant, respectively. The decay function ( ϕ ) in these equations is formulated as the following: Decay function ( ϕ ):
ϕ mn = exp(−α mn × t c ) tc =
0 ∑life s =0 ( mFF
× ts )
Wcat
(6) (7)
In Equation 6 and 7, α mn represents the deactivation coefficient for 0 converting lump m to n during the hydrocracking process; mFF is the mass flow rate of fresh VGO; Wcat is the total weight of catalyst in the reactor, and tc is a dimensionless term, called accumulated feed, representing the total amount of
Authenticated |
[email protected] Download Date | 6/11/12 6:30 AM
Published by De Gruyter, 2012
International Journal of Chemical Reactor Engineering
6
Vol. 10 [2012], Article A16
feed passed through the total catalyst weight at the specific life time (Sadighi et al., 2010a). Thus, the reaction rates ( R j ) can be expressed as follows: G
Vacuum gas oil reaction ( RV ): RV = ( ∑ ϕVj kVj )CV 2 j=F
(8)
Heavy diesel ( HD ), Light Diesel ( LD ) or Diesel ( RD ): G
RD = ϕVD kVD CV 2 − ∑ ϕ Dj k Dj C D
(9)
j=D
Wild Kerosene or Kerosene ( RK ): K
G
j=D
j = HN
RK = ϕVK kVK CV 2 + ∑ ϕ jK k jK C j − ∑ ϕ Kj k Kj C K
(10)
Wild Heavy Naphtha or Heavy Naphtha ( RHN ): K
G
j=D
j = LN
RHN = ϕVHN kVHN CV 2 + ∑ ϕ jHN k jHN C j − ∑ ϕ HNj k HNj C HN
(11)
Wild Light Naphtha or Light Naphtha ( RLN ): HN
RLN = ϕVLN kVLN CV 2 + ∑ ϕ jLN k jLN C j − ϕ LNG k LNG C LN j=D
(12)
Gas ( RG ): G
RG = ϕVG kVG CV 2 + ∑ ϕ jG k jG C j j=D
(13)
In an industrial-scale hydrocracking reactor, operating in the trickle-bedregime, non-idealities such as axial dispersion, wetting efficiency, back mixing and non-uniform radial bed temperature are negligible (Mederos & Ancheyta, 2009; Mary et al., 2009). Hence, the reactor can be modeled as an ideal plug-flow reactor. Plug flow for each phase is assumed in many reported reactor scale models that consist of a set of ordinary differential equations (ODEs) with welldefined initial and boundary conditions. However, using plug flow model considerably increases the convergence time of the model, especially in the parameter estimation step. To overcome this difficulty, a cell network is applied. All beds from the inlet to the outlet are divided into a number (Nl=200) of wellmixed cells which are grouped along the flow direction (Guo et al., 2008).
Authenticated |
[email protected] Download Date | 6/11/12 6:30 AM
Sadighi et al.: Lump Partitioning for a Commercial Hydrocracking Model
7
Because of various exothermic and endothermic reactions occurred during hydrocracking process, energy balance should be involved in the model. In the target refinery, it was observed that the operators always tried to set the weighted average temperature of beds, by manipulating the load of heaters and hydrogen quenches between them, on the values which were recommended by the catalyst licensor. Because the aim of this work is developing an applicable and comparable model for the understudy refinery, it is supposed that using the measured WABT as the input variable of the model instead of energy balance can make it more robust for the target refinery to predict the product yields and to schedule production. Using WABT as a suitable model variable to introduce the reaction temperature in the trickle bed industrial reactors was reported in literatures (Döhler and Rupp, 1987; Sadighi et al., 2010a). In the interest of improving the accuracy of the developed model, the volumetric flow rate in the reactor ( υ ) is considered as a variable; thus, it is calculated according to the density of the output stream (Eq. 16). Therefore, Equations 14 to 17 for the catalytic bed should be solved simultaneously. C j (i − 1) ×ν (i − 1) ± R j (i ) × ω (i ) = C j (i ) ×ν (i )
(14)
In Eq. 14, j ranges from the VGO lump ( V ) to the gas ( G ), C is the mass concentration of the lump, ω is the weight of catalyst in each cell; a negative sign indicates reactant (F or WV) and a positive sign indicates products.
ω (i) = ν (i ) = 1 = ρ (i )
Wcat Nl
(15)
m 0FF + m 0H + m 0R
(16)
ρ (i ) G ∑ j=F
C j (i ).ν (i ) (m
0 FF
+ mH0 + mR0 ) ρ j
(17)
In Equations 15 to 17, ρ and ν are the stream density and volumetric flow rate through the reactor, respectively, m 0R is the mass flow rate of recycle, m 0H is the mass flow rate of hydrogen and ρ j is the average density of lump j (Table 2), respectively.
Authenticated |
[email protected] Download Date | 6/11/12 6:30 AM
Published by De Gruyter, 2012
International Journal of Chemical Reactor Engineering
8
Vol. 10 [2012], Article A16
After calculating the mass concentration and volumetric flow rate of each lump in the effluent stream, the product yields can be calculated as follows: Yj =
C j .υ .(1 − R s j )
(18)
0 mFF + m 0H
In Eq. 18, Rs is the recycle fraction of the lumps, which is mixed with the fresh feed. For parameter estimation, sum of squared deviations (SQE) between the yields predicted by the model and the ones measured from under study plant is minimized:
SQE =
Nt G ∑ ∑ k =1 j =V
(Y jk
meas
In Eq. 19, N t , Y jk
meas
− Y jk
pred 2
and Y jk
)
pred
(19) are the number of test runs, the measured product
yield and the yield predicted by the model, respectively. To predict product yields, the hydrocracking model according to Equations 1 to 18 is coded and solved simultaneously using the Aspen Custom Modeler (ACM) programming environment (AspenTech). Then, to estimate kinetic parameters, Eq. 19 is minimized by applying the NL2Sol algorithm.
4. Results and discussion Before using the commercial data to estimate the model parameters, it is necessary to validate them. Mass balance is performed for each test run including the fresh feed, recycle feed and hydrogen make up as well as the products including high-pressure gas, low-pressure gas, gas from the amine absorber, LPG from the recovery tower, wild light naphtha, wild heavy naphtha, wild kerosene, wild diesel and unconverted feed (wild offtest). Only test runs with mass balances in the range of 100±5% are chosen. The analysis of the products also shows that the sulfur and nitrogen contents are less than 50 ppm. Thus, it is reasonable to ignore these impurities during the mass balance procedure. From the SOR (start of run) to the MOR (middle of run), eight sets of data are validated, and their related operating conditions are tabulated in Table 3. The range of density and boiling point of these products from the SOR to the MOR are previously presented in Table 2. All densities of the feed and products in this table are analyzed according to the ASTM D4052 standard procedure. At first, the required model parameters for the six-lump model (Figure 1a) are estimated by using validated industrial data. It is found that for this model, at the average WABT (415°C), the rate constants of the feed to wild naphthas and
Authenticated |
[email protected] Download Date | 6/11/12 6:30 AM
Sadighi et al.: Lump Partitioning for a Commercial Hydrocracking Model
9
Table 2. Range of hydrocracking feed and product properties IBP S.G. S.G. (min-max) (average) (min-max) (°C) @15 °C @15 °C Fresh feed 0.918-0.92 0.919 275-320 Wild offtest (recycle) 0.826-0.85 0.838 226-335 Wild diesel 0.825-0.829 0.827 237-248 Wild kerosene 0.808-0.816 0.812 185-200 Wild heavy naphtha 0.766-0.778 0.772 120-133 Wild light naphtha 0.710-0.722 0.716 38-41 Gas 0.459-0.562 0.510 C1
FBP (min-max) (°C) 503-516 475-480 373-381 150-260 173-183 137-154 C5
Table 3. Operating conditions of the validated test runs DOS (day) 26 43 71 100 271 326 411 499
0 mFF mR0 WABT H2/HC* (°C) (kg/kg feed) (kg/hr) (kg/hr) 802.7 83452 30766.5 410.8 2.77 1312.3 83669 35892.2 412.3 2.48 2197.1 83297 35834.3 414.5 2.51 3170.9 85311 5720.7 416 2.51 8379.3 83141 5211.5 415.7 2.40 10157.5 83517 33380 417 2.35 12686.6 83023 33380 416.5 2.30 15446.6 83188 33200 419 2.18
tc *
* kg feed/kg catalyst; DOS = days on stream, and H2/HC = unit mass of consumed hydrogen per unit mass of fresh feed. gas (kVHN, kVLN, kVG),, wild diesel to wild kerosene, wild naphthas and gas (kDK, kDHN, kDLN, kDG), kerosene to gas (kKG), and wild heavy naphtha to gas (kHNG) are close to zero. After ignoring these paths and re-estimating the remained parameters, the average absolute deviation (AAD) and sum of squares of residuals (SSE) of all predicted lumps are tabulated in Table 4. From this table, it can be observed that for all lumps except to the wild light naphtha, the model cannot predict the yield of products with an acceptable accuracy. Moreover, the prediction error is so flagrant for the wild VGO which has made the model unreliable for this product. This high deviation is also resulted in the previous industrial model introduced for a hydrocracking plant (Sadighi et al., 2010a).
Authenticated |
[email protected] Download Date | 6/11/12 6:30 AM
Published by De Gruyter, 2012
10
International Journal of Chemical Reactor Engineering
Vol. 10 [2012], Article A16
Table 4. AAD% and SSE% of the prediction for the six-lump model Product AAD% SSE (%) 48.16 19.64 Wild offtest 1.99 12.76 Wild diesel 3.97 9.23 Wild kerosene 9.33 7.4 Wild heavy naphtha 3.59 1.87 Wild light naphtha 15 4.28 Gas ~ 20.51 ~ 9.29 Average %
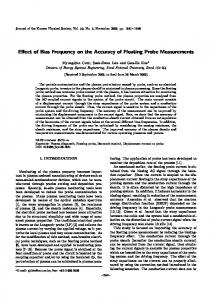
Figure 2. (a) The reduced 6-lump model (b) The reduced seven-lump kinetic model The simplified kinetic network of the six-lump model is presented in Figure 2a. Also, the flow diagram of that is depicted in Figure 3a. Additionally, the estimated decay constants and kinetic parameters are presented in Table 5. To have a better judgment about the situation, it is better to reconsider the operation of the plant. From Table 2, it can be observed that the initial and final boiling points of the fresh feed are variable during the operational period so it can create some deviations for the model. Additionally, the flagrant error for the residue (Wild VGO) can be due to its swinging with diesel as if the initial cuts of them cannot be separated completely in the separation section of the hydrocracking plant. Also, this non-ideality in distillation properties can create the same error prediction for the other products (wild kerosene, wild heavy naphtha).
Authenticated |
[email protected] Download Date | 6/11/12 6:30 AM
Sadighi et al.: Lump Partitioning for a Commercial Hydrocracking Model
11
But, the high deviation for the gas lump can be due to the: 1. Difficulty of gas measurement in the commercial unit, creating a large prediction error, and 2. The weakness of combined-bed model to predict the gas yield in the hydrocracking process (Sadighi et al., 2012). To address the problem, Hysys-Refinery process simulator is employed to partition the feed and products into components with the specific and accurate
Figure 3. (a) The flow scheme of the six-lump hydrocracking model (b) The flow scheme of the seven-lump hydrocracking model Table 5. Kinetic parameters for the complete six-lump model Activation energy Frequency factor (kcal/mol) Parameter Unit Value 3 2 -1 9.63 1.674E-3 k0VD (m ) ·(kgcat·hr·kg) EVD k0VK k0KHN k0KLN k0LNG
3 2
-1
(m ) ·(kgcat·hr·kg)
1.386
EVK
18.87
3
-1
1.497E5
EKHN
26.81
3
-1
9.77E3
EKLN
22.37
3
-1
3.269
ELNG
11.65
m ·(kgcat·hr) m ·(kgcat·hr) m ·(kgcat·hr)
Authenticated |
[email protected] Download Date | 6/11/12 6:30 AM
Decay constant
α VD α VK α KHN α KLN α LNG
6.507E-6 1.3E-6 1.789E-7 -
Published by De Gruyter, 2012
12
International Journal of Chemical Reactor Engineering
Vol. 10 [2012], Article A16
boiling-point ranges, including light naphtha or PLN (C6-90°C and S.G. = 0.695), heavy naphtha or PHN (90-180°C and S.G.= 0.754), kerosene or PK (180-260°C and S.G. = 0.802), light diesel or LD (260-320°C and S.G. = 0.818), heavy diesel or HD (320-380°C and S.G. = 0.839) and VGO (380+°C, S.G. = 0.923). From the described strategy, it can be understood that in the seven-lump model, the recycle stream is composed of three lumps including LD, HD and VGO. So, the scheme of the seven-lump model is switched to Figure 3b. Now, the required kinetic parameters for the seven-lump model, Figure 1b, are identified by using the partitioned data. The estimated parameters reveal that the rate constants at the average WABT (415 0C), i.e., kVLD, kVK, kVHN, kVG, kHDG, kHDLN, kLDLN, kLDG, kKG, kHNLN and kLNG are negligible. It means that these reactions, mostly related to the conversion of VGO and middle distillates to gas and naphtha, have lower selectivity and so they can be ignored. This phenomenon is consistent with this fact that amorphous catalysts having the tendency to produce higher amounts of middle distillates and lower amounts of naphtha fractions; thus it explains the reason for the low values of the rate constants (kVLD, kVHN, kHDLN, kLDLN and kKLN). Also, the low rate constants for converting VGO, light and heavy diesel as well as kerosene to gas (kVG, kHDG, kLDG and kKG) are expectable because these products are more stable in high temperature than naphtha cut. After eliminating the low-reaction-rate pathways, the simplified reaction network for the seven-lump hydrocracking model is shown in the Figure 2b designated the seven-lump reduced model. Additionally, the corresponding estimated decay constants and kinetic parameters of that are presented in Table 6. From the decay constants in both Table 5 and Table 6, it can be concluded that poisons not only affected the hydrocracking reactions of VGO to lighter products, but they also influenced the other paths. Furthermore, the effects of deactivation of the hydrocracking catalyst are negative with respect to the production of all desirable products, but these effects are not homogenous. Of all hydrocracking reactions, the one producing heavy naphtha is the most affected by the deactivation. Moreover, the catalyst degradation has the least effect on the production of middle distillates compared to that of the heavy naphtha. The decay constants of some paths ( α VD , α LNG , α HDHN , α LDHN , α KLN , α HNG ) in Tables 5 and 6 are negligible (