lightweight concrete, ceramics and so on, constitute a particular ... materials for which one phase in such material is pore space, rather than .... were then wrapped in plastic bags, which were then sealed so as to .... Nevertheless, as pointed out.
J. Phys. D: Appl. Phys. 31 (1998) 3457–3462. Printed in the UK
PII: S0022-3727(98)95834-X
Effect of moisture content on the thermal effusivity of wood cement-based composites A Bouguerra†, M B Diop†, J P Laurent‡, M L Benmalek† and M Queneudec§ ´ ´ † Departement de Genie Civil, IUT de Rennes, 3, Rue du Clos Courtel, BP 1144, 35014 Rennes Cedex, France ‡ LTHE, UMR 5564 (CNRS-INPG-UJF-ORSTOM) BP 53, 38041 Grenoble Cedex 09, France ˆ ´ § Laboratoire de Batiment : Materiaux, Structures, Thermique, ´ ´ ´ 80025 Amiens Cedex 1, Departement Genie Civil, IUT, Avenue des Facultes, France Received 13 July 1998, in final form 29 September 1998 Abstract. The influence of moisture content on the thermal effusivity of wood cement-based composite was investigated. Measurements of thermal effusivity were performed inside a closely controlled climatic cell at ambient temperature (20 ± 0.5 ◦ C) in conditions ranging from fully saturated to oven-dry. Shrotriya et al ’s model based on an Ohm’s law approach was used for predicting the effective thermal effusivity of studied materials. The topological parameters of the model, such as sphericity of particles and resistivity formation factor, have been estimated as a first approximation from both thermal conductivity measurements and formulae proposed in the literature. Test results confirm that moisture content tends to increase the thermal effusivity significantly. It is also found that the Shrotriya et al ’s model yields predictions which agree quite closely with experimental data for wood aggregates–clay–cement composites for different amounts of wood aggregates and degrees of saturation.
Nomenclature a surface area of a sphere A surface area of a real particle β thermal effusivity intermediate ETE of air–water mixture βi δ constrictivity factor empirical constant B0 ε total porosity volume fraction of air εair volume fraction of water εw F formation factor m constant S degree of saturation τ tortuosity factor τ 2 /δ matrix factor θ angle of inclination ψ sphericity of particles Subscripts: c critical e effective value f fluid phase ma moist air s solid phase w water k parallel ⊥ series c 1998 IOP Publishing Ltd 0022-3727/98/243457+06$19.50
1. Introduction Composite materials constitute a very large family of natural as well as artificial materials, and can be defined as a combination of at least two different solid phases. Porous building materials, such as conventional concrete, lightweight concrete, ceramics and so on, constitute a particular case of the more general class of composite materials for which one phase in such material is pore space, rather than another solid [1]. In many cases of porous building materials, both consolidated and unconsolidated, two distinct possibilities exist: (i) the material is dry or fully saturated, i.e. the material is a twophase system, and (ii) the material is a three-phase system constituted by solid, gaseous and liquid phases. As has been mentioned elsewhere [2], the effective thermal effusivity (ETE) of porous materials depends upon various parameters such as porosity, geometry of pore structure, size of particles and distribution of particles. Furthermore, it is found that the ETE is influenced by the temperature, interstitial pressure and moisture content [3–7]. Besides a decisive effect on durability of material, moisture content can considerably modify the effective transport properties, in particular the ETE. 3457
A Bouguerra et al
The present study has been undertaken to predict the effective thermal effusivity at ambient temperature (20 ± 0.5 ◦ C) of moist wood aggregates–clay–cement composite considered as a new building material with improved thermal performance obtained by the incorporation of wood particles in a mineral matrix. 2. Review of model proposed by Shrotriya et al [3, 5]
�
and β⊥ =
βs βf εβs + (1 − ε)βf
(1)
� sin θ
(2)
where ε is the volume fraction of the fluid phase and βs and βf are the thermal effusivities of the solid and fluid phases respectively. Hence, the ETE of such a two-phase medium is given by the expression βe = (βk2 + β⊥2 )1/2 .
(3)
The angle θ between parallel slabs and the direction of the heat flux is defined by: � � �1/2 � βs (4) θ = tan−1 B0 ψ 2 F ε2 βf where B0 is an empirical constant which depends upon both the mode of packing of the particles and the nature of the system, ψ is the sphericity of the particles, and F is the formation factor. Using the same approach, Shrotriya and co-authors [5] have extended the two-phase thermal effusivity model to predict the ETE of three-phase systems, i.e. solid–air–water. The parallel and series models can then be written as [5] βk = [εβi + (1 − ε)βs ] cos θ � � βs βi β⊥ = sin θ εβs + (1 − ε)βi and θ will be −1
θ = tan
�
� 2
B0 ψ F ε
2
βs βi
(5) (6)
�1/2 � (7)
where βi is the intermediate ETE of an air–water mixture and is obtained by the relation βi = 3458
βw εw εw + εair
ε = εw + εair
(9)
where εair and εw are respectively the volume fractions of air and water. More details of the theory are given in [3, 5]. It is worth mentioning that in the case of air-saturated material βi is reduced to βair . 3. Experimental details
The upper and lower bounds of the ETE of a two-phase system consisting of solid and fluid phases are obtained with parallel and serial arrangements of the constituent phases, respectively, with respect to the direction of heat flow. A more realistic model would occur somewhere between these two bounds. Shrotriya et al [3, 5] have shown that the slabs of the solid and fluid phases, inclined to the heat flux, may indeed represent the ETE of the porous medium. Considering that the solid and fluid phases in the form of parallel slabs (equivalent resistors) make an angle θ with the direction of the heat flux, the parallel and series models can then be written as [3] βk = [εβf + (1 − ε)βs ] cos θ
and
(8)
3.1. Materials and sample preparation The material used in this study is a wood concrete which is composed of a mineral matrix (clay-hardened cement paste matrix) and vegetable aggregates (wood aggregates). The clayey fines used in this work are almost exclusively composed of kaolinites. Their absolute density, as measured by water pycnometry, was 2.65 g cm−3 . The cement used is CPA CEM I 52.5 (EN 196-1). The aggregates are commercial Picea wood aggregates of between 3 and 8 mm which have undergone both thermal and physical-chemical treatments. A series of four mixtures of wood composite with various relative mass fractions of wood aggregates (10, 20, 25 and 35% by weight of dry plus wood aggregates) added to a clay–cement matrix were used in this investigation. The following proportions of solid phases will be systematically used: cement = 25%, and clay + wood aggregates = 75% (see table 1). In order to control moisture, the materials are initially dried. Dry mixing is essential in obtaining a truly homogenized mixture. The fines and cement are introduced into a planetarymovement mixer and subsequently mixed at low speed for 3 min. Wood aggregates are then added to the perfectly homogenized mixture while keeping the mixer at low speed for another 3 min. Water is added gradually throughout the entire mixing stage. Homogenization is guaranteed by lowspeed mixing for 3 min followed by high-speed mixing for 1 min. After mixing, the material is placed in the moulds. Six specimens of size 100 × 100 × 50 mm from each mix were cast for thermal effusivity measurements. The physical properties of different mixtures are listed in table 1. After casting, test specimens were placed in the casting room for 24 h at a temperature of about 20 ◦ C. They were then demoulded and put into 100% relative humidity moist curing room at 20 ◦ C until the time of testing. The test specimens were then dried to a constant weight at 70 ◦ C. Following completion of the air-dry test, the specimens were placed in a vacuum tank in which the air pressure was lowered to an absolute value no higher than 100–250 N m−2 for a period of at least 24 h. The water was kept in a separate tank for at least 2 h at an absolute pressure of approximately the water vapour pressure (2.8 kN m−2 at ambient temperature). After a period of at least 2 h, the water was transferred from its initial tank into the tank in which the specimens were placed. After the specimens are fully submerged, the vacuum should be maintained for at least 2 h before the pressure is raised to the atmospheric value. The specimens were then wrapped in plastic bags, which were then sealed so as to avoid any moisture change [8].
Thermal effusivity of wood cement composites Table 1. Mix proportions and physical properties of materials studied. Relative mass fraction of wood aggregates WA/(WA+Cl) (%)
Clay (Cl) (by mass)
Cement (C) (by mass)
Wood aggregates (WAs) (by mass)
Total porosity (%)
Dry bulk density (g cm−3 )
10 20 25 35
67.5 60.1 56.2 48.5
25.0 25.0 25.0 25.0
7.5 14.9 18.8 26.5
54.6 62.1 63.6 66.0
1.065 0.908 0.862 0.728
5
Average intensity RMN (10 )
3.0 0 min 15 min 30 min 45 min
2.5 2.0 1.5 1.0 0.5 0.0
0
5
10 15 20 25 30 35 40 45 50 55 60 Position (mm)
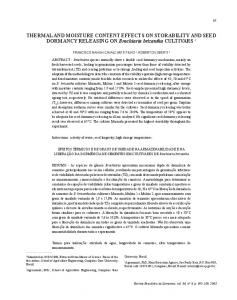
Figure 1. Water profiles along the axis at various elapsed intervals from 0 to 45 min for the clay–cement–25% wood aggregates composite.
A series of water content states from fully saturated to oven-dried condition was obtained by progressive drying in a microwave oven, which served to ensure a homogeneous distribution of the water inside the material [9]. The efficiency of this technique has been assessed by the magnetic resonance imaging (MRI) method. Measurements have been performed using a ‘Biospec Bruker’ system. The probe has an internal diameter of 70 mm. A standard proton-resonance, spin-echo imaging sequence was used with an echo time (TE) of 2 ms. The test specimens consisted of a 50 mm cube. The sample was first saturated with water in a vacuum and then dried in a microwave oven for various elapsed times. Figure 1 shows the water content distribution along the central axis of the sample from 0 to 45 min elapsed intervals after the start of the experiment for a 25% wood aggregates–clay cement composite. It is observed from figure 1 that the moisture profiles of water inside the material are almost uniform.
3.2. Experimental arrangement To test the validity of the Shrotriya et al ’s model, an experiment arrangement similar to that already described in [2] was used to measure the effective thermal effusivity (ETE). To ensure a one-dimensional heat flow and to avoid water migration during the test measurement, the time of the experiment was 400 s. The ETE of the medium in which a plane heat source was placed is calculated by the
Figure 2. Typical recording of the temperature rise 1T measured at the centre of the heat plane source versus t 1/2 for the clay–cement–20% wood aggregates composite at both saturated state and room temperature.
relation
Q √ t 1T (t) = T (t) − T0 = √ πβ
(10)
where Q is the power per unit area supplied to the heater resistance. Figure 2 shows a typical recording of the temperature rise 1T versus t 1/2 at the centre of the heat plane source for saturated clay–cement–20% wood aggregates. It is worth mentioning that to avoid any error due to the nonlinearity of the variation in temperature 1T with t 1/2 during the period of self-heating, the first few experimental points are ignored in the determination of thermal effusivity. The thermal effusivity is then obtained by a least-squares fitting method, given the power input and the variation in temperature. The estimated error in the measurements of the thermal effusivity is of the order of 6–10%. 4. Results and discussion The effective thermal effusivity (ETE) of wood concretes is estimated from Shrotriya et al ’s model in two steps. First the ETE is calculated for an air saturated wood concrete (two-phase system consisting both of solid and of gaseous (air) phases) using the expressions (1)–(3). Then the ETE of unsaturated wood concrete (three-phase system, i.e. air, water and solid phases) is computed using the expressions (5), (6) and (3). Using the present model all calculations have been carried out with βair = 5.59 W m−2 K−1 s1/2 3459
A Bouguerra et al
and βw = 1520 W m−2 K−1 s1/2 [10]. Thermal effusivity measurements were performed on both dry and unsaturated wood concretes at ambient temperature (20 ± 0.5 ◦ C). Using expressions (1) and (2) requires knowledge of the angle of inclination, which depends upon various parameters, such as the constant B0 , porosity, sphericity of particles, formation factor and the ratio (βs /βair ). In the case of dry wood concretes, the angle of inclination is computed by equation (4). The value of B0 is found to be 0.24. The sphericity of particles, ψ, is a measure of the roundness of the particles. It represents the deviation of particle shape from a sphere. Wadell [11] has defined it as the ratio between the surface area of a sphere having the same volume as that of the particle, a, and the actual surface area A (ψ = a/A). For spherical particles ψ = 1 and non-spherical particles ψ < 1. Verma et al [12] have described an original method for its experimental determination. However, in many porous solids, it is difficult to measure ψ. As a first approximation, a calculated value can be obtained from thermal conductivity measurements using Verma et al ’s model [13]. The values of ψ may be found by adjusting this calculation until model predictions and experimental measurements are in agreement. The resistivity formation factor is a measure of the average path traversed by the flux lines in the porous medium. Wyllie and Southwick [14] have defined it as the ratio of resistivity of a porous medium fully saturated with a conductive fluid to the resistivity of the fluid itself. A number of expressions, which relate the resistivity formation factor to the total porosity, have been reported in the literature. Nevertheless, as pointed out by Agrawal and Bhandari [15], the formation factor also depends upon the geometrical shape (sphericity) of the particles. In the present calculations, the expression derived by Agrawal and Bhandari [15] has been used to estimate F: � �2 1 0.3219 F = 1+ (1 − ε) . (11) ε ψ In terms of the porosity, the tortuosity factor and the constrictivity factor, Tumidajski et al [16] recently proposed, for cementitious systems, the following expression: F =
τ 2 −m ε δ
(12)
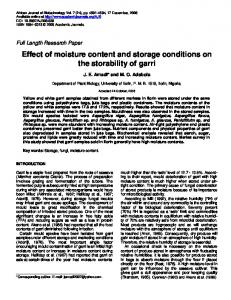
where τ and δ are the ‘tortuosity’ factor and the ‘constrictivity’ factor respectively [16], and m is a constant which depends on the material’s pore structure. The values of this ratio (τ 2 /δ), the so-called the matrix factor, as well as the coefficient m have been estimated using the leastsquares method from the calculated data. The formation factor is calculated by equation (11). Tumidajski and coauthors have suggested that the formation factor is related to total porosity raised to the power of m = 1.5 at higher porosity values for cementitious composites. Figure 3 shows that the formation factor decreases as total porosity increases. Figure 3 also shows the formation factor F , estimated from Agrawal and Bhandari’s formula using expression (11), and the correlation line using Tumidajski et al ’s formula using expression (12) as a function of total 3460
Figure 3. A plot of the resistivity formation factor of clay–cement–wood aggregates composite versus the porosity: �, calculated values from expression as proposed by Agrawal and Bhandari; ——, using Tumidajski et al ’s formula.
porosity. It can be seen that the Tumidajski et al ’s formula correlates all calculation data very well. The reliability of the fitting has been judged by the obtained value of the regression coefficient, r = 0.999 92. Effective thermal effusivities of dry wood concretes are calculated over a range of porosity using the expressions (1)–(3); and compared with the experimental measurements. Nevertheless, Shrotriya et al ’s model in its original state does not predict the effective thermal effusivity very well. As previously pointed out [2], flux lines follow a tortuous path whenever they pass through a medium composed of phases of different thermal constituents. This distortion of the flux lines also depend upon the ratio of the thermal constituents and is thus greater for higher thermal constituent ratios. As an example, for a two-phase system, i.e. a solid–air mixture, a higher ratio (βs /βair ) favours a larger proportion of the ETE in the direction perpendicular to the heat flow. Since the Ohm’s law model presumes one-dimensional heat transfer, a correction term is to be applied to take this distortion into account. Thus, when a correction term 0.15(βs /βair )1/3 was introduced to account for the high thermal effusivity ratio, the level of agreement with experimental results became very good. Table 2 gives a comparison between the experimental values of the ETE and those predicted from the present model. An excellent agreement is observed between the experimental values and the predicted results for dry wood concretes. The percentage of deviation from experimental measurements lies in the range 1–7.5%. We consider now the case of moist material, which is a system consisting of three phases, i.e. solid, air and water phases. Both equations (5) and (6) require a knowledge of the constant B0 and the functional relation between the ratio (βs /βma ) and the degree of saturation, S, which can be expressed as the relation S = θv /ε, where θv is the volume fraction of water content and ε the total porosity. In the case of unsaturated material, the value of B0 lies between 1.35 to 1.45 over the whole porosity range. However, in the present calculation of effective thermal effusivity the value of B0 used is the average value, which is taken as
Thermal effusivity of wood cement composites Table 2. Comparison of predicted and experimental values for dry clay–cement–wood aggregate composites. Values of thermal effusivity are in W m−2 K−1 s1/2 . B0 = 0.24 and βair = 5.59 W m−2 K−1 s1/2 . Relative percentage of wood aggregates (%)
Thermal effusivity (experimental)
Thermal effusivity (Shrotriya et al ’s model)
Percentage of deviation (%)
10 20 25 35
657.96 551.40 493.70 467.39
707.58 538.34 488.59 442.80
7.54 2.37 1.04 5.26
Figure 4. Comparison between measurement thermal effusivity using the heat plane source technique and predicted thermal effusivity using Shrotriya et al ’s model for 10, 20, 25 and 35% of wood aggregates respectively. Values of thermal effusivity are in W m−2 K−1 s1/2 . B0 = 1.4 and βair = 5.59 W m−2 K−1 s1/2 and βw = 1520 W m−2 K−1 s1/2 .
1.4. The intermediate ETE of an air–water mixture from dry state up to full saturation were calculated using equation (8). Figure 4 shows the experimental values of ETE and those predicted using Shrotriya et al ’s model for various degrees of saturation at room temperature (20 ± 0.5 ◦ C) and for different relative mass fractions of wood aggregates. Figure 4 shows that the ETE increases with an increase in the degree of saturation. Moreover, it can be observed that the theoretical results are in very close agreement with the experimental values for moist wood concretes. These curves also show that the variation of ETE of wood concretes with the degree of saturation follows the same trend with varying relative mass fraction of wood aggregates. The increase in effective thermal effusivity with water content results from the fact that the value of ETE for water is about 270 times the value of the ETE of air at ambient temperature. Therefore, gradual addition of water in the material induces an increase in the
effective thermal effusivity. A physical interpretation of this behaviour can be obtained qualitatively by examining the relation between the pore structure variables, like the constrictivity and the tortuosity factors, and the water content. When the volume fraction of water is zero, i.e dry material, the heat flow passes mainly through the solid particles. In addition to the contraction of the heat flow lines because of the complexity of pore structure, the flux lines follows a tortuous path within the material. The former phenomenon is characterized by the constrictivity factor which accounts for the fact that the cross section of a segment pore varies with its length. The second phenomenon is characterized by the tortuosity factor which accounts for the nonlinear path followed by the flux lines. Initial addition of water to the dry material results in the formation of a thin film of water on the surface of the pores. Gradually as the volume fraction of water increases, water molecules form isolated liquid islands, known as 3461
A Bouguerra et al
the pendular liquid. Therefore, as has been pointed by Brakel and Heertjes [17], the contraction of the heat flux lines diminishes considerably while the average deviation of the heat flux due to the presence of pores within the material remains constant. Then, the effective thermal effusivity increases very sharply with water content. On the other hand the isolated liquid islands are equivalent to short circuits, which rapidly increase the effective thermal effusivity. This phenomenon persists up to a critical value of water content, Sc , which corresponds to the limit between the pendular state and the funicular state for which the liquid phase in the porous medium becomes continuous. Conversely, in the funicular state the contraction of the flux lines becomes relatively insensitive to changes in water content up to complete saturation, but the tortuosity factor decreases very rapidly with increasing water content [17]. For complete saturation (S = 1), the flux lines will become parallel and hence τ = 1. So, for volumetric water content greater than Sc , the number of discontinuous liquid islands decreases while the degree of liquid continuity increases and the rate of increase of effective thermal effusivity becomes smaller. 5. Conclusion This paper examines the measurement and the prediction of effective thermal effusivity of unsaturated wood concretes in the water content range from dry to fully saturated. Empirical expressions, as proposed by Agrawal and Bhandari and Tumidajski and co-authors, have been derived in order to correlate the formation factor with the porosity of the studied material. The theoretical predictions are in very good agreement with experimental results. The thermal effusivity of wood concretes is strongly dependent upon the water content. The trend of the increase of effective thermal
3462
effusivity is the same over the entire range of relative mass fraction of wood aggregates. The effectiveness of Shrotriya et al ’s model in the estimation of the effective thermal effusivity for both saturated and unsaturated wood composites also merits recognition.
References [1] Haynes J M 1973 Mater. Struct. 6 169 [2] Bouguerra A, Ledhem A, Laurent J P, Diop M B and Queneudec M 1998 J. Phys. D: Appl. Phys. 31 2184–90 [3] Shrotriya A K, Verma L S, Singh R and Chaudhary D R 1991 J. Phys. D: Appl. Phys. 24 849 [4] Misra K, Shrotriya A K, Singh N, Singh R and Chaudhary D R 1994 J. Phys. D: Appl. Phys. 27 1823 [5] Shrotriya A K, Verma L S, Singh R and Chaudhary D R 1991 J. Phys. D: Appl. Phys. 24 1527 [6] Abdelwahed R M, Bligh T P and Eckert E R G 1978 Int. J. Heat Mass Transfer 21 967 [7] Shrotriya A K, Singh R, Singh U and Chaudhary D R 1992 J. Phys. D: Appl. Phys. 25 366 [8] RILEM, CPC 11.3 1984 Mater. Struct. 17 391 [9] Horton R, Wierrenga P J and Nielsen D R 1982 Soils Sci. 133 397 [10] CETIAT 1989 Propri´et´es Physiques de Quelques Fluides ´ Utilis´es dans les Echangeurs (Villeurbanne: CETIAT) [11] Wadell H 1935 J. Geol. 43 250 [12] Verma L S, Singh R and Chaudhary D R 1993 J. Phys. D: Appl. Phys. 26 259 [13] Verma L S, Shrotriya A K, Singh R and Chaudhary D R 1991 J. Phys. D: Appl. Phys. 24 1729 [14] Wyllie M R J and Southwick P F 1954 J. Petrol. Technol. 6 44 [15] Agrawal M P and Bhandari R C 1969 Ind. J. Pure Appl. Phys. 7 190 [16] Tumidajski P J, Schumacher P J, Perron A S and Beaudoin J J 1996 Cement Concrete Res. 26 539 [17] Brakel J V and Heertjes P M 1974 Int. J. Heat Mass Transfer 17 1093