A. Al-Roichdi 1. M.G. Evans 1. M.E. Cutler 2 ... potential to achieve this (Cutler et al. 2002). Less well humified ..... M., and SCOTT, W.A., 1997, Long-term study of.
The effect of moisture content and humification on the hyperspectral reflectance of peat J.M. McMorrow 1 A. Al-Roichdi 1 M.G. Evans 1 M.E. Cutler 2 1. School of Geography, University of Manchester 2. Department of Geography, University of Dundee Keywords: Peat, hyperspectral, moisture content, humification, radiometry, Pennines, upland. Abstract Work using HyMap has shown a relationship between hyperspectral reflectance and the degree of humification of in situ upland peats in the south Pennines, especially in the shortwave infrared. The contribution of moisture content, however, could not be excluded. In order to decouple moisture and humification effects, a controlled drying experiment was carried out in the laboratory on three peat blocks of low, intermediate and poor humification. The NERC ASD FieldSpec Pro was used in contact probe mode to measure peat reflectance spectra at different gravimetric moisture contents. Analysis has concentrated on water absorptions centred on 1400 and 1940 nm and ligno-cellulose absorption at 2100 nm. As the peat dried out, albedo increased and changes occurred in the position of the shoulders, the slope between them and the position, depth, width and asymmetry of features below the continuum line. Spectral indices were used to express these changes. Humification signals became more pronounced in dry peat, and were stronger for poorly humified peat. The 1200 nm feature associated with water, cellulose and lignin disappeared on drying, even for the poorly humified peat, suggesting that it was primarily due to water. Absorptions at 1400 and 1900 nm remain even in dry peat. Early results suggest that the albedo of the shoulders of the 1900 nm feature, and to a lesser extent the 1400 nm feature, are the most sensitive to moisture, while the shape of the features below the continuum line is also sensitive to humification. On-going work is testing the value of combinations of candidate indices to separate peat into moisture-humification classes.
1. Introduction Fire, grazing and climate change has led to severe erosion of upland vegetation in the southern Pennines, exposing large areas of peat (Tallis et al. 1997). Further erosion removes carbon from this important terrestrial store (Latter et al, 1997, Freeman et al. 2001, Evans and Warburton in press). The moisture content of exposed upland blanket peat affects its susceptibility to further erosion by water and wind. Its degree of humification (decomposition) may also be an indicator of erobility and affects water quality in reservoirs supplied from peatland catchments. Well humified peat contains tannins which discolour drinking water, and humic acids which release heavy metals deposited from the atmosphere. It is valuable, therefore, to be able to assess spatial variations in peat surface moisture and humification. Hyperspectral remote sensing offers the potential to achieve this (Cutler et al. 2002). Less well humified plant litter retains more cellulose and lignin so absorption features associated with these biochemicals are more pronounced (Ben-Dor et al. 1997, Nagler et al. McMorrow et al./ 1
2000, Elvidge 1990). The principle has been extended to dried, milled peat (McTiernan et al. 1998) and to in situ peats in the southern Pennines (McMorrow et al. 2002). Work using HyMap data acquired for the SAR and Hyperspectral Airborne Campaign (SHAC) has shown a relationship between hyperspectral reflectance and the degree of humification of in situ exposed upland peats in the south Pennines, especially in the shortwave infrared region. However, soil reflectance is controlled by chromophores other than organic matter, especially water content (Ben-Dor et al. 1999). Water absorptions at 1200, 1400 and 1900 nm lie close to those of lignin and cellulose (Curran 1989), and even though no significant correlations were found between HyMap spectral features and moisture content, the contribution of moisture could not be excluded (McMorrow et al. in press). In an attempt to decouple moisture and humification effects, a controlled drying experiment was carried out in the laboratory on peats of three different humifications. The aim of this paper is to report on work in progress to classify peat into moisture-humification classes using hyperspectral data obtained in the laboratory with a spectro-radiometer used in contact probe mode.
2. Method 2.1 Assessment of humification Three blocks of peat of dimensions 40x30x10 cm were cut in the field, wrapped, and transported to the laboratory. The blocks were selected from various locations which, on visual assessment, spanned a range of degrees of surface decomposition (humification). Their humification was judged to be the same throughout its 10 cm depth. In order to confirm the visual assessment, a dried sample from the surface of each block was mechanically homogenised and digested in NaOH, according to the method of Blackford and Chambers (1993). The transmission of light at 624 nm through the resultant solutions, as measured on a Hach DR/4000 spectrophotometer, was used as a relative measure of the degree of humification. 2.2 Drying experiments A series of drying experiments were conducted to assess the effects of varying moisture content on the reflectance of the peat samples. An optically thick sample of approximately 1 cm depth was taken from the surface of the block. Measured amounts of water were added to the sample until saturation was achieved (approximately 90% water by mass). The sample was then ovendried in stages at 20°C. Every hour, the reflectance was measured with the NERC FieldSpec-Pro Analytical Spectral Device (ASD) in contact probe mode. The probe is designed to be in used in contact with a sample. It has approximately a 2 cm field of view, with an integral side illumination source. At least five probe readings were taken at random positions across the sub-sample. Each reading was an integral of 20 readings captured within one second. Prior to probe readings, the surface of the peat sub-sample was homogenised by stirring. Stirring was necessary to prevent shadow effects from surface cracking, and also to ensure that the probe readings were directly comparable with average moisture, rather than values associated with preferential surface drying. Overall, 14 sets of readings were taken on the poorly and intermediate humification blocks and 21 on the well humified block. The results presented here are an average of the replicate readings. At each hourly sampling point, and after the probe readings, the moisture content of a subsample was determined gravimetrically. The hourly period is equivalent to a water loss of approximately 10% of the original moisture.
McMorrow et al./ 2
2.3 Extraction of hyperspectral indices: To quantify changes in the shape of the major absorption features at 1400, 1940 and 2100 nm, the following primary data were extracted from the reflectance spectra (Table 1). Index No. 1 2 4 5 6
Primary index (units) Wavelength position of the left shoulder(nm) Wavelength position of the right shoulder (nm) Wavelength position of the absorption feature (nm) Reflectance at the left shoulder (%) Reflectance at the right shoulder Reflectance at the absorption feature
Symbol L R F L ref R ref F ref
Table 1: Primary indices extracted from peat reflectance spectra
Shoulder and absorption feature positions were found by inspection and confirmed by calculating the first derivative of each spectrum to identify points at which the derivative crossed the x axis. Reflectance values were read for the three positions. From these six values, further indices were calculated to characterise the depth, width, and asymmetry of the absorption feature, together with the slope between the shoulders and the left and right slopes of the feature itself. The main indices used and the method of calculation are shown in Table 2. Index No 1 2 3 4 5 6 7 8 9 10 11 12 13
Name Combined shoulder reflectance Difference in shoulder reflectance (albedo of continuum line) Normalised difference of slope between shoulders (slope of continuum line normalised for albedo) Ratio of shoulders (slope of continuum line) Angle between shoulders (slope of continuum line) Left slope of absorption feature Normalised difference of left slope of feature Right slope of absorption feature Normalised difference of right slope of absorption feature Depth below continuum Width of absorption feature Width-depth ratio Asymmetry
Equation L ref + R ref L ref - R ref (L ref-R ref)/(L ref + R ref) L ref/ R ref Tan-1 ((L ref – R ref)/(R – L ) L ref / F ref (L ref-F ref)/(L ref + F ref) R ref / F ref (R ref-F ref)/(R ref + F ref) (0.5*(L ref + R ref)) – F ref R –L (R – L ) / ((0.5*(L ref + R ref)) – F ref) ((0.5*(R – L )) + L ) – F
Table 2: Derived indices expressing shape and albedo of absorption feature and its shoulders
The six primary indices and 13 derived indices were correlated against moisture content over all three blocks. Strong correlations indicate sensitivity to moisture content and relative insensitivity to humification. Changes in the spectra on drying and their correlation with moisture will be outlined, and their sensitivity to humification will be discussed.
McMorrow et al./ 3
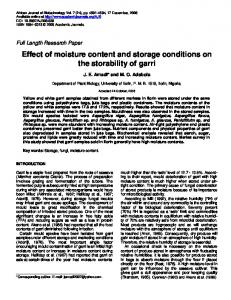
3. Effect of drying on peat spectra 3.1 Increase in albedo Figure 1 shows the spectra for the peat block with intermediate humification. As the peat dried out, the expected increase in albedo was observed for all but the driest peat. It is well known that the albedo of soils decreases on wetting (e.g. Idso et al. 1975, Stoner and Baumgardner 1980) due to the decrease in refractive index produced by the change in the medium surrounding soil particles from air to water (Twomey et al. 1986, Ishida et al. 1991). The increase on drying was non-linear, as also observed by Liu et al. (2003) in their drying experiments on different soils. It was greatest in the near infrared (NIR) and shortwave infrared (SWIR) regions where the two broad water absorptions are located at 1400 and 1900 nm.
ASD contact probe reflectance ( %)
Drying experiments on block 1 (intermediate humification)
50 45 40 35 30
Drying
25 20 15 10 5 0 350
850
1350
1850
2350
2850
1 moisture 92% 2 moisture 73% 3 moisture 63% 4 moisture 49% 5 moisture 42% 6 moisture 35% 7 moisture 29% 8 moisture 23% 9 moisture 17% 10 moisture 11 11 moisture 6% 12 moisture 3% 13 moisture 1% 14 moisture 0%
Wavelength nm Figure 1: Effect of drying on reflectance spectra for peat block1, intermediate humification
The driest curve, below 0% moisture in Figure 1, shows a sudden unexpected fall in albedo everywhere except at the 1900 nm absorption feature. This has also been observed in recently analysed samples and may be an artefact of the method, but, as yet, the cause can not be confirmed. The spectral hysteresis reported for wetting experiments in soils may not be mirrored during drying in peat. It is very difficult to rehydrate completely dry peat (the reason for the choice of drying as a method in this work), as it tends to become hydrophobic at extremely low moisture contents. In this case, the surface was mixed and flattened before spectra were recorded, so it is unlikely to be due to a change in physical condition such as the formation of a crust which would create micro-shadow. The fall may be related to chemical changes in the last stages of oven drying, although they would be expected to produce a change in spectral response rather than general fall in albedo. It is tentatively suggested that the decrease may be due to the vaporising of remaining water by heat from the contact probe’s internal illumination source, which was only effective at very low moisture contents.
McMorrow et al./ 4
3.2 Changes in shape and albedo of absorption feature Figure 2 shows the wettest and driest spectra for each of the three blocks. Quantitative analysis has concentrated so far on the strong water absorption regions centred on 1400 and 1900 nm, and the cellulose absorption at 2100 nm. The strong water absorption feature 1400 nm is due to the first overtone of the O-H bend, while the very strong 1900 nm water feature is attributed to a fundamental O-H stretch and O-H deformation. The 2100 nm feature is related to a combination of the third overtone of the O=H bend, C-O stretch and C-O-C stretch for cellulose and other carbohydrates (Curran 1989). 3.2.1 950 and 1200 nm absorption features Despite averaging replicate spectra, the steps remain at 975 and 1800 nm due to the non-random arrangement of the fibre optic bundles for the three sets of detectors (350-974 and 975-1829nm, 1830-2500 nm). They are more pronounced for the poorly and intermediate humified peat because the peat surface was more heterogeneous. The very weak water absorption feature at 950 nm (Ben-Dor et al. 1999) could be seen on the wet spectra but had totally disappeared on the driest spectra (Figure 2). Its parameters could not be measured due to the step at 975 nm. The weak 1200 nm feature also disappeared on drying, even in the poorly humified peat, suggesting that it was primarily due to absorption by water, even though a lignin absorption also exists at 1200 nm (Curran 1989). Indeed, a fundamental problem is the overlapping of water and biochemical absorption bands and the similarity of absorptions between biochemicals. 3.2.2 1400 nm absorption feature The shape of the 1400 nm feature is primarily controlled by moisture content but is also sensitive to humification, which causes scatter in the relationship and reduces the strength of the correlation coefficient. During drying, the albedo of the 1400 nm absorption feature and its shoulders increased until moisture content fell below 1-2%. The strongest correlation with moisture, and therefore the least sensitivity to humification, was for the reflectance of the left shoulders, located at 1265-1385 nm (r -0.788). ASD spectra for wet and dry peat at three humifications 60
50
ASD contact probe reflectance (%)
Cellulose feature at 2100 nm appears in dry peat. Deeper for poorly humified.
Detector steps larger in poorly and intermediate humified peat
Cellulose feature at 2350 nm
40
30
Wet, poorly humified
975 and 1200 nm features disappear
1900 nm feature narrow s. Wet, intermedieate humification, transmission
1400 nm feature shallow s, narrow s, shifts to longer w avelength. Shoulders pivot. Postive asymetry increases, esp. for w ell humified.
10 WET
Wet, w ell humified
0 300
500
700
900
1100
1300
Dry, intermediate humification Dry, w ell humified
DRY
20
Dry, poorly humified
1500
1700
1900
2100
2300
2500
Wavelength (nm)
Figure 2: Differences in spectra of wet and dry peats at three humifications.
McMorrow et al./ 5
The 1400 nm feature narrowed on drying, as was also observed by Nagler et al. (2000) for drier plant litters. It shifted by 10-14 nm to shorter wavelengths, causing positive asymmetry to increase. Asymmetry was more marked for the well humified peat. In contrast, Ben-Dor et al. (1999) report a decrease in asymmetry with lower relative humidities and dryness. In smectite clay minerals, shifts of the OH absorption features at 1400, 1900 and 2200 have been attributed to vibrational properties of absorbed water molecules (Cariati et al. 1983). Contrary to expectation (e.g. Bowers and Smith 1972), the depth of the 1400 nm feature below the continuum did not show a steady decrease on drying, but varied with humification (Figure 3), so that correlation of depth with moisture content is very poor (r 0.171). Depth was calculated in the normal way as half the difference in the shoulder reflectance minus that of the absorption feature. A more precise method which allows for asymmetry is being developed. Sensitivity to humification was greatest for moisture contents between 5 and 30%. Only well humified peat showed the expected shallowing as moisture content fell. For peat of poor and intermediate humification, depth actually increased up to 16% moisture before showing the expected decrease. Depth of 1400 nm feature below continuum
(0.5(L+R))-Feature
20
Poorly humified Intermediate Well humified
15 10 5 0 0
20
40
60
80
100
Moisture (%)
Figure 3: Change with drying in the depth of 1400nm absorption feature below the continuum
Figures 1 and 2 show a pivoting of the continuum line between the shoulders of the 1400 nm absorption feature. The slope between the shoulders flattened from positive to finally become negative, with the right shoulder higher than the left for the driest peats. Figure 4 shows the trend expressed as the difference in reflectance at the shoulders. Poorly humified peat retained higher slopes between the shoulders, and was most sensitive to humification at moisture contents of 20-70% (Figure 4). It can be seen that the index is sensitive to humification, giving a poor correlation with moisture when data for all three humifications are used (r 0.481). Norm alised difference index for slope betw een shoulders of 1400 nm absorption feature
(L-R)/(L+R) @ 1400 nm
0.6 0.5 0.4
Poorly humified Intermediate Well humified
0.3 0.2 0.1 0 -0.1 0
20
40
60
80
100
Moisture %
Figure 4: Change with drying in the relative height (slope) of the shoulders of the 1400 nm absorption feature
McMorrow et al./ 6
3.2.3 1900 nm absorption feature As expected, this feature was more strongly controlled by water content because the OH functional group in water has a fundamental absorption at 1940 nm. A combined cellulose and lignin absorption also exists at this wavelength, with another for cellulose at 1820 nm (Curran 1989), but the feature appeared to be less sensitive to humification than the 1400 nm feature. Indices describing the shape of the feature were more strongly correlated with moisture content than those for the 1400 nm feature. The feature narrowed non-linearly as drying proceeded, as for the 1400 nm feature. The width suddenly decreased markedly from around 400 nm to 100 nm once moisture fell below 6% (Figure 1), but earlier at 11% in poorly humified peat. It is related to the appearance of an absorption feature at 2100 nm which had been previously been masked by water and which has been attributed to cellulose (Nagler et al. 2000). Width therefore has a relatively low correlation with moisture content (r 0.491). Depth below the continuum also showed only a moderate correlation with moisture (r 0.712) because it did not decrease regularly, as would have been expected (Figure 5). It has a similar trend to that at 1400 nm (Figure 3), but is less affected by humification differences. Depth of 1900 nm absorption feature below continuum 25.00 Poorly humified Intermediate Well humified
Depth
20.00 15.00 10.00 5.00 0.00 0
20
40 60 Moisture %
80
100
Figure 5: Change with drying in the depth of 1900nm absorption feature below the continuum
The feature suddenly developed greater positive asymmetry below 10% moisture content, that is, the absorption maximum shifted to shorter wavelengths relative to the shoulders, as for the 1400 nm feature. Well humified peat again showed the greatest, but erratic, shift of the absorption feature from 1928 to 1921 nm and marked asymmetry when dry. The left and right slopes of the absorption feature, calculated as the ratio of the absorption feature and shoulder reflectance, decreased with drying (left slope, r 0.878; right slope 0.827). The scatter was due to humification differences. Indices which used albedo had the strongest relationship with water content, as at 1400 nm but were much stronger. The highest linear correlation with moisture obtained over all three humifications was -0.922 for the slope of the continuum line between the left and right shoulders at 1800-1820 and 2000-2220 nm. The reflectance at the left shoulder (Figure 6) had a very strong exponential relationship with moisture (r -0.963, r2 0.928)
McMorrow et al./ 7
Reflectance of left shoulder of 1900 nm aborption feature Reflectance of left shoulder (%)
60
y = 44.138e-0.0298x 40
R2 = 0.9282
20 0 0
20
40 60 Moisture %
80
100
Figure 6: Change with drying in reflectance at left shoulder of 1900 nm absorption feature.
Albedo information is usually removed in hyperspectral analysis, where emphasis is on the depth and shape of the feature below the continuum line (Kokaly and Clark 1999). For estimation of surface moisture in peat, however, the reflectance either side of the 1900 water absorption feature is a better index when humification is not of interest. It is also more suitable for airborne or space sensors because it avoids the most intense atmospheric water absorption at 1900 nm. Where humification is of interest, a normalised difference index of shoulder reflectance can be used. It showed sensitivity to humification for wetter samples (Figure 7). Norm alised difference of slope betw een shoulders of 1900 nm absorption feature 0.0 (L ref - R ref) / (L ref + R ref)
-0.1 0
20
40
60
80
100
-0.1 -0.2 -0.2 -0.3 -0.3
Poorly humified
-0.4
Intermediate
-0.4
Well humified
-0.5 -0.5
Moisture (%)
Figure 7: Changes with drying in the normalised difference index of slope between the shoulders of the 1900 nm absorption feature.
3.2.4 Absorption at 2100 and 2350 nm Diagnostic ligno-cellulose features at 2100 and 2350 nm (Elvidge 1991) appeared as an inflection point when moisture content fell below 9% and developed into a marked absorption by 2% moisture. The absorptions were most marked in the poorly humified peat, as observed in HyMap spectra for in situ peat (McMorrow et al. 2002). In wet peats of all three humifications, the broadened water absorption feature at 1900 nm obscured both these ligno-cellulose absorptions. In this respect, the peat behaved more similarly to soils than plant litter in the study by Nagler et al. (2000), who found that concavity at 2100 nm was absent in soils but remained in even in wet litter. McMorrow et al./ 8
4. Sensitivity to humification Poorly humified peat is brighter in the visible and NIR at all stages of wetness than more humified peat, but when wet is darker in the SWIR than the other two types. Humification signals became more pronounced below 9-16% moisture content, especially for the reported cellulose absorption at 2100 nm. The feature, referred to as the cellulose absorption index (Nagler et al. 2000), became positive after 2-9% moisture content. It followed the expected behaviour observed in HyMap spectra, increasing from 1.9 in well humified dry peat with arguably less cellulose, to 3.8 in poorly humified dry peat where the cellulose content should be higher. The feature at 2350 nm only was also observed in the dry peat. It has been attributed to cellulose (Elvidge 1990), although there is visually very little difference in its depth for the three humifications. The fact that the strong 1400 and 1900 nm absorption features are retained even in dry peat samples suggests that they are partly due to the presence of biochemicals such as cellulose, lignin and tannins, whose absorptions overlap with those of water. The inorganic component in the peat is too small to play a major role: ash content is of the order of 5% and is mostly sand or silt, not clay. Poorly humified peat may be expected to contain more lignin and cellulose, but less tannin. Differences in the spectra of the three humifications are partially consistent with this hypothesis, but analysis of the chemical composition is required to confirm biochemical composition. For instance, the lower shoulders of the 1400 nm feature in well humified dry peat may be due the reinforcing effect of tannins, as Soukupova et al. (2002) found them to have diagnostic absorption features at 1635-1675 nm, which would depress the albedo of the right shoulder. Poorly humified dry peat had a deeper 1400 nm absorption feature and its position occurred at longer wavelengths relative to well humified peat. This is consistent with the presence of more lignin, whose absorptions at 1420 and 1450 nm (Curran 1989) would reinforce the water absorption at 1400 nm and shift it to longer wavelengths. Conversely, however, smaller concentrations of tannins in poorly humified peat should result in less absorption at 1442-1484 nm (Soukupova et al. 2002), which would cause the feature to be shallower. Clearly, concentrations of the major biochemical are required to account for changes observed. The degree of sensitivity of the indices to humification depends on wetness. For instance, the widths of the 1400 and 1900 nm features are sensitive to humification below 50% and 10% moisture, respectively. The depth of the 1400 nm feature is strongly affected by humification between 5 and 65% moisture (Figure 3), as is the slope of the right shoulder. These indices may, therefore, serve to separate drier peats into broad classes of humification. The normalised index of the shoulder reflectance of the 1400 nm feature is sensitive to humification across the range of wetness, but particularly for wetter peats. The predictive value of these and other potential indices of humification will be tested against independent samples.
5. Moisture-humification classes
Results to date are based on only three humifications, but suggest that the 1400 nm feature is sensitive to both moisture and humification, while the 1900 nm feature is much more dominated by moisture. Moisture is best estimated using albedo values without continuum removal, while the shape of the feature below the continuum hold potential for humification, especially for the 1400 feature and, for the driest peats, at 2100 and 2350 nm. Combinations of indices would appear to offer scope for classifying peat into broad combined moisture-humification classes. On-going work is exploring the use of indices in cluster analysis and decision tree approaches. For instance, Figure 8 shows the feature space for the difference in the shoulder reflectances of the 1400 nm feature plotted against their combined reflectance. Poorly humified peat is separable from the other two when both indices are used. The approach requires testing with a wider range of samples. McMorrow et al./ 9
Combined shoulder albedo against difference in shoulder albedo, 1400 nm absorption feature 100
Humificaton
L+R reflectance
80 60
Poorly humified
40
Well humified
Intermediate
20
Wetness
0 -2
3
L-R reflectance
8
13
Figure 8: Scatter diagram of combined shoulder reflectances and reflectance differences for the 1400 nm absorption feature, with wetness and humification trends superimposed.
6. Future work
The candidate hyperspectral indices so far been developed using raw band reflectance. Indices will also be calculated using apparent absorption, derivatives of reflectance, derivatives of apparent absorption and reflectance minus the driest spectra. The latter technique has been used by Liu et al. (2003) to reduce humification and other biophysical differences when the aim is estimation of moisture content. So far we have examined moisture as a continuous variable but humification as only three extremes. Drying experiments have already been conducted on a much larger sample of peats of varying humifications. The data will be used to refine indices and test the moisture-humification class approach. A more ambitious goal is prediction of both moisture content and humification as continuous variables using regression analysis and artificial neural networks. Two enduring problems remain. First, strong absorptions by water in the NIR and SWIR obscure the more subtle humification signals so that extraction of information on humification will be difficult for the wettest peat. Second, similarities in the molecular structure of plant litter biochemicals can produce virtually identical absorption features (Soukupova et al. 2002). For this reason, chemical composition of samples will also be needed to explain the results.
Acknowledgements
We would like to thank the following: UK Natural Environment Research Council Equipment Pool for Field Spectroscopy (NERC EPFS) for provision of the ASD FieldSpec Pro spectroradiometer; National Trust High Peak Estate and Northwest Water for field access; postgraduates at Manchester for assistance with fieldwork; the Faculty of Arts, University of Manchester for funding, and; the Syrian government for Amer Al-Riochdi’s postgraduate studentship.
References
BEN-DOR, E., INBAR, Y., and CHEN, Y., 1997, The reflectance spectra of organic matter in the visible near-infrared and short wave infrared region (400-2500 nm) during a controlled decomposition process. Remote Sensing of Environment, 61 (1), 1-15. BEN-DOR, E., IRONS, J.R., and EPEMA, G.F., 1999, Soil reflectance. In Remote Sensing for the Earth Sciences: Manual of Remote Sensing, edited by A.N. Rencz (New York: John Wiley & Sons, pp. 111-188. BLACKFORD, J.J., and CHAMBERS, F.M., 1993, Determining the degree of peat decomposition for peat-based palaeoclimatic studies. International Peat Journal, 5, 7-24. BOWERS, S.A., and SMITH, S.J., 1972, Spectrophotometric determination of soil water content. Soil Science Society of America Proceedings, 36, 978-980. McMorrow et al./ 10
CARIATI, F., ERRE, L., MICERA, G, PIU, P., and GESSA, C., 1981, Watrer molecules and hydroxyl groups in montmorillonites as studied by near infrared spectroscopy. Clays and Clay Mineralogy, 29, 157-159. CURRAN, P.J., 1989, Remote sensing of foliar chemistry. Remote Sensing of Environment, 30, 271-278. CUTLER, M.E.J., MCMORROW, J.M., and EVANS, M.G. (2002) Remote sensing of upland peat erosion in the southern Pennines. North West Geography, 2, 21-30. ELVIDGE, C.D., 1990, Visible and near infrared reflectance characteristics of dry plant materials. International Journal of Remote Sensing 11(10), 1775-1795. EVANS, M.G., and WARBURTON J.(in press) Sediment budget for an eroding peat-moorland catchment in Northern England. Earth Surface Processes and Landforms FREEMAN, C., EVANS C.D., MONTEITH, D.T., REYNOLDS, B., and FENNER, M.N., 2001, Export of organic carbon from peat soils. Nature, 412, 785. IDSO, S.B., JACKSON, R.D., REGINATO, B.A., KIMBALL, B.A., and NAKAMA, F.S., 1975, The dependence of bare soil albedo on soil water content, Journal of Applied Meteorology, 14, 109-113. ISHIDA T., ANDO, H., and FUKUHARA, M., 1991, Estimation of complex refractive index of soil particles and its dependence on soil chemical properties. Remote Sensing of Environment, 38, 173-182. KOKALY, R.F., and CLARK, R.N., 1999, Spectroscopic determination of leaf biochemistry using band-depth analysis of absorption features and stepwise linear regression. Remote Sensing of Environment, 67, 267-287. LATTER, P.M., HOWSON, G., HOWARD, .M., and SCOTT, W.A., 1997, Long-term study of litter decomposition on a Pennine peat bog: which regression? Oecologia, 113, 94-103. LIU, W., BARET, F., GU, X., ZHANG, B., TONG, Q., and ZHENG, L., 2003, Evaluation of methods for soil surface moisture estimation from reflectance data, International Journal of Remote Sensing, 24 (10), 2069-2083. MCMORROW, J.M., CUTLER, M.E.J., and EVANS, M.E., 2002, Synergy of HyMap and digital elevation data for the analysis of upland peat erosion patterns and composition. Final report to British National Space centre, and NERC for SAR and Hyperspectral Airborne Campaign (SHAC). MCMORROW, J.M., CUTLER, M.E.J., EVANS, M.G., and AL-ROICHDI, A, in press, Hyperspectral indices for characterizing upland peat composition, International Journal of Remote Sensing. McTIERNAN, K.B., GARNETT, M.H., MAUQUOY, D., INESON, P., and COUTEAUX, M.M, 1998, Use of near-infrared reflectance spectroscopy (NIRS) in palaeoecological studies of peat, The Holocene 8 (6), 729-740. NAGLER, P.L., DAUGHTRY, C.S.T., and GOWARD, S.N., 2000, Plant litter and soil reflectance, Remote Sensing of Environment, 71, 207-215. SOUKUPOVÁ, J., ROCK, B.N. and ALBRECHTOVÁ, J., 2002, Spectral characteristics of lignin and soluble phenolics in the near infrared – a comparative study, International Journal of Remote Sensing, 23 (15), 3039-3056. STONER, E.R., and BAUMGARDNER, M.F., 1980, Physiochemical, site and bi-directional reflectance factor characteristics of uniformly moist soils, LARS Technical. Report 111679, West Lafayette, Indiana, Laboratory for Applications of Remote Sensing, Purdue University. TALLIS, J.H., MEADE, R., and HULME, P.D. (eds.), 1997, Blanket Mire Degradation: Causes and Consequences, Proceedings of the Mires Research Group of the British Ecological Society. TWOMEY, S.A., BOHREN, C.F., and MERGENTHALER, J.L., 1986, Reflectance and albedo differences between wet and dry surfaces, Applied Optics, 25, 431-437. McMorrow et al./ 11