Environmental Technology Vol. 30, No. 13, 1 December 2009, 1381–1389
Effect of operating parameters on denitrification in an anoxic rotating biological contactor Susana Cortez, Pilar Teixeira, Rosário Oliveira* and Manuel Mota IBB – Institute for Biotechnology and Bioengineering, Centre of Biological Engineering, University of Minho, Campus de Gualtar, 4710–057 Braga, Portugal (Received 27 February 2009; Accepted 30 June 2009 )
Taylor and Francis
Downloaded By: [B-on Consortium - 2007] At: 10:42 19 November 2009
10.1080/09593330903156490
The presence of nitrate in water and wastewater is a serious environmental problem. Anoxic rotating biological contactors (RBC) are a promising novel technology for nitrate removal. In this study the effect of two carbon/nitrogen (C/N) molar ratios (1.5 and 3.0) on denitrification, using acetate as a carbon source, were investigated in an anoxic bench-scale RBC, treating synthetic wastewater. The effect of different hydraulic retention times (HRTs) and different nitrogen and carbon influent concentrations on the reactor performance, at constant C/N, were also analysed. The average removal efficiency in terms of nitrogen-nitrate was about 90.4% at C/N = 1.5, lowering to 73.7% at C/ N = 3.0. Considering carbon-acetate removal, overall efficiencies of 82.0% and 63.6% were attained at C/N ratios of 1.5 and 3.0, respectively. The increase in nitrogen-nitrate (from 50 to 100 mg N-NO 3− L−1) and carbon-acetate influent concentrations and the decrease in HRT, keeping C/N constant, had a slight negative effect in terms of substrate removal. It was found that, for the tested conditions, the use of C/N = 1.5 is advantageous to denitrification. The anoxic RBC was significantly effective at reducing nitrate concentrations within a relatively short HRT. These reactors may be a feasible option for the treatment of nitrate-rich wastewaters. Keywords: anoxic rotating biological contactor; biofilm; carbon to nitrogen ratio; denitrification
Introduction The traditional physico-chemical methods used to eliminate nitrate from water and wastewater are ion exchange, reverse osmosis and electrodialysis [1]. However, these approaches present some drawbacks such as concentrated waste disposal issues, cost and susceptibility to fouling (in the case of reverse osmosis) [2]. Biological nitrate reduction (denitrification) has been shown to be more economical and practical and the most versatile approach among all methods for removing nitrate from water and wastewater [3]. The anoxic rotating biological contactor (RBC) is a promising novel technology for nitrate removal. An anoxic RBC unit typically consists of a series of closely spaced discs that are mounted on a common horizontal shaft and are partially or completely submerged in wastewater and inserted in a tightly closed case to avoid air entrance. Similarly to an open RBC, the shaft continually rotates and a biofilm is established on the entire surface area of the media, which metabolizes the organic materials contained in the wastewater. Because of its advantages, such as small land area requirement, easy construction, compact design, simplicity of operation, low operating and maintenance costs, short hydraulic retention time (HRT) and *Corresponding author. Email:
[email protected] ISSN 0959-3330 print/ISSN 1479-487X online © 2009 Taylor & Francis DOI: 10.1080/09593330903156490 http://www.informaworld.com
high biomass concentration per reactor volume, RBCs constitute a very unique and superior alternative technology for carbon oxidation, nitrification, denitrification and phosphorus removal [4]. In municipal wastewater treatment processes most denitrifying bacteria are heterotrophic, and so an organic carbon source is required [5–7]. Methanol, acetate, citrate, propionate, ethanol and glucose are some of the carbon sources that have been used. Acetate has been reported to give high denitrification rates in most cases [8–10]. Besides the type of carbon source, denitrification rate is strongly susceptible to the concentration of the carbon source and the carbon to nitrogen ratio (C/N) [11,12]. These can vary for different microorganisms, water streams and environmental conditions [13]. Although in the last decade anoxic RBCs have started to be used for denitrification, few studies have been conducted with this type of reactor. Therefore, the aim of this work was to evaluate the denitrification process in an anoxic bench-scale RBC, for the treatment of a synthetic wastewater under two C/N molar ratios (1.5 and 3.0) and to compare the characteristics and the activity of the biofilm grown in those conditions. The effect of different HRTs and different organic and
1382
S. Cortez et al.
nitrate influent concentrations on the reactor performance, keeping C/N constant, were also analysed.
Table 2. Chemical composition of the denitrifying medium used for acclimatization of biological sludge.
Downloaded By: [B-on Consortium - 2007] At: 10:42 19 November 2009
Concentration (mg L−1)
Materials and methods Experimental set-up A single-stage bench-scale anoxic RBC reactor with eight polymethylmethacrylate (PMMA) discs was used in the experiments. The details are given in Table 1. The temperature was maintained at 28 °C by means of a heating jacket. The reactor was covered and sealed and no special precaution was taken to maintain anoxic conditions. An influent feed tank was coupled to a previously calibrated peristaltic pump used to supply the synthetic wastewater flow rate into the anoxic RBC in a direction parallel to the rotating shaft. A dynamic head tube resembling a vented inverted siphon on the effluent line was used to control the liquid level. The treated effluent was collected in a receiving tank. The produced gas flow rate was measured by a Ritter MilliGascounter. Acclimatization of biomass A volume of concentrated biological sludge was collected from an activated sludge tank at Esposende wastewater treatment plant, Portugal. In order to get a suitable consortium, the fresh biomass was acclimatized for one month in a denitrifying medium, in anoxic conditions, at room temperature and 150 rpm, using acetate as a carbon source and a phosphorus concentration of 10 mg P L−1. According to the experiment (C/N = 1.5 or C/N = 3.0) the consortium was enriched in a denitrifying medium with the composition shown in Table 2. The trace element solution contained: 242 mg Na2MoO4·2H2O, 56 mg FeSO4·7H2O, 8.1 mg Table 1. Summary of the dimensions of the anoxic RBC experimental unit. Parameter No. of stages No. of discs/stage Internal unit diameter Disc diameter Disc thickness Disc spacing Shaft diameter Submergence Useful volume Unit length Type of material Rotational speed
Value 1 8 140 mm 130 mm 3 mm 20 mm 16 mm 93.5% 0.0025 m3 210 mm Acrylic 4 rpm
Compound CH3COONa·3H2O KNO3 K2HPO4. 3H2O KH2PO4 Trace element solution
C/N = 1.5
C/N = 3
425.3 360.9 60.9 9.0 100 mL
850.5 360.9 60.9 9.0 100 mL
MnCl2·2H2O, 390 mg CaCl2·2H2O and 409.2 mg MgSO4·7H2O per litre of tap water. Because of the buffering capacity of the medium, no pH adjustment was performed. The acclimatized sludge was then used for seeding into the anoxic RBC. Synthetic wastewater The anoxic rotating biological contactor was fed continuously with synthetic wastewater. The synthetic influent had a composition similar to the denitrifying medium. The nitrogen-nitrate range selected is typical of concentrations found in agricultural and industrial wastewaters [14]. To evaluate the reactor efficiency and biofilm development, the carbon and nitrate loads were doubled on the eighth day of operation (at constant C/N ratio), in both experimental conditions (C/N = 1.5 or C/ N = 3.0). Reactor inoculation, start-up and operation The bench-scale reactor was inoculated with 2.5 L of the adapted consortium of sludge, and microbial attachment on to the discs was allowed to occur in batch mode. The initial biomass concentration in the system was 2.63 and 2.21 g of volatile suspended solids (VSS) L−1, for C/N = 1.5 and C/N = 3.0, respectively. A visible attachment of biomass on the discs was noticed after four days of inoculation. On day 6, the anoxic RBC mixed liquor was removed, the reactor was refilled with the synthetic wastewater and its operation in continuous mode was started. The HRT, very high at the beginning, was gradually reduced. The ‘zero’ time of operation was considered to be when HRT was adjusted to 10 h. Two days after that, the collection of samples started. The study was conducted for a period of 28 days (for each C/N ratio). During the assay, carbon-acetate and nitrogen-nitrate concentrations were doubled and the HRT was changed from 10 h to 5.68 h as shown in Table 3. Whenever a parameter was changed, the reactor was allowed to stabilize for a period of at least twice
Environmental Technology Table 3.
Operating parameters of the anoxic RBC. C/N = 1.5 −
Days of operation
HRT (h)
N-NO3 (mg L−1)
0–8 8–15 15–22 22–28
10.00 10.00 6.84 5.68
50 100 100 100
C/N = 3
C-CH3COO− (mg L−1) 75 150 150 150
150 300 300 300
Downloaded By: [B-on Consortium - 2007] At: 10:42 19 November 2009
the corresponding retention time, before taking any sample. Biofilm denitrifying activity At the end of each experiment, the biofilm formed on the discs was carefully removed (along the whole depth). The scraped biofilm was used in additional batch assays to evaluate the specific substrate consumption rates and biofilm activity as well. These assays were performed in 160 mL serum flasks containing 90 mL of the denitrifying medium mentioned above, and were inoculated with 1 g of biofilm (wet weight). In order to evaluate the activity along the reactor, the biofilm samples used as inoculum corresponded to a mixture of biofilm removed from the first and second discs, from the three middle discs and from the three last discs. Flasks were closed with butyl rubber stoppers and aluminium caps. To obtain anoxic conditions, the flasks were flushed with helium gas. Finally, the flasks were incubated at 28 °C and 150 rpm. Aliquots of 2.5 mL were removed from each bottle, samples were collected at regular intervals, and immediately analysed for various parameters. Specific substrate consumption rates of nitrate and acetate were determined according to the following equation:
dS =
( S0 − St ) SST ⋅ t
(1)
where dS is the specific substrate consumption rate, S0 and St are the substrate concentrations at the beginning and at the end of the batch test, respectively, and SST is the concentration of solids during the denitrification batch test time t. Sampling and analytical methods During the course of continuous operation, samples of the RBC influent and effluent were collected routinely and analysed for various parameters such as pH, chemical oxygen demand (COD), nitrate, nitrite and acetate.
1383
Dissolved oxygen was not measured. The pH was immediately read after collection of the sample and measured with a Metrohm 620 pH meter. The COD was determined according to the closed reflux colorimetric method [15]. For the determination of nitrate, nitrite and acetate ion concentration, samples were filtered through a 0.2 µm membrane filter to remove interfering suspended particles. Nitrite-nitrogen concentration was determined by a colorimetric method using N-(1-naphthyl)-ethylene-diamine, according to Standard Methods [15]. Nitrate and acetate concentrations were measured by high-performance liquid chromatography, using a Varian Metacarb column (type 67H, 9 µm, 300 mm long, 6.5 mm internal diameter) and a mobile phase of 0.005 M sulphuric acid (H2SO4) at 0.7 mL min−1. The column temperature was set at 60 °C, and nitrate and acetate were detected by UV at 210 nm. Periodically, gas samples were analysed by a gas chromatograph equipped with a thermal conductivity detector and a Porapak Q column (2 mm internal diameter, 80–100 µm mesh, 1 m length) in series with a Molecular Sieve column (2 mm internal diameter, 5 Å, 80–100 µm mesh, 2 m length). Helium was used as the carrier gas at a flow rate of 17 mL min−1. The temperatures of the injector port, columns and detector were 110 °C, 35 °C and 110 °C, respectively. In order to separate the polymeric matrix from the cells, portions of biofilm from the three defined sections of the reactor (for each experiment) were submitted to an extraction procedure, according to Azeredo et al. [16]. The protein content was determined by a Lowry modified method, using the Bicinchoninic Acid Protein Assay Kit (BCA) (BCA-PIERCE Cat. No. 23225). Polysaccharide concentration was estimated colorimetrically by means of the phenol–sulphuric acid method of Dubois et al. [17], using glucose as standard. Biofilm thickness was measured with a Vernier calliper. Density was calculated in terms of dry mass per unit of wet volume [18]. Results and discussion One of the most important parameters of control to achieve high denitrifying efficiencies, under heterotrophic conditions, is the carbon/nitrogen ratio. The C/N ratio required for complete nitrate reduction to nitrogen gas by denitrifying bacteria depends on the nature of the carbon source. Carbon limitation will result in incomplete denitrification and a concomitant accumulation of intermediate products, such as NO2 and N2O. Conversely, an excess of carbon constitutes an extra cost and will promote dissimilatory nitrate reduction to ammonia and the presence of carbon in the denitrified effluent [12,19]. Therefore, the type of carbon source should be selected and the C/N ratio properly controlled.
1384
S. Cortez et al.
Stoichiometric relationships of heterotrophic denitrification with acetate have been referred to in the literature [20,21], but in many cases cell synthesis is not considered. All bacterial reactions (except photosynthesis) are the result of a synthesis of biomass reaction and an energy production reaction, being both oxidation and reduction reactions. Considering denitrification as a two-step process, using acetate as the carbon and energy source, using the half reactions given in McCarty et al. [22] and normalizing to one mole of nitrate, the following reaction can be written: NO 3− + 0.826CH 3COO − + 1.816 H + → 1.302CO 2
Downloaded By: [B-on Consortium - 2007] At: 10:42 19 November 2009
+0.07C 5 H 7 O 2 N + 1.9 H 2 O + 0.467 N 2
( 2)
According to Equation (2), the theoretical acetate consumption for denitrification (including the requirements for biomass growth) is 1.416 mg of C-CH3COO− per mg of N-NO3−. The C/N ratio required for complete denitrification depends, among other factors, on the nature of the bacterial species [12]. Therefore, taking into account that the inoculum used was activated sludge – a consortium of microorganisms – and considering that some acetate is necessary for the removal of oxygen from the system, it was decided to investigate the performance of the anoxic RBC and the characteristics of the biofilm grown under two carbon/nitrogen ratios: 1.5 and 3.0. The first mentioned ratio is almost identical to the ratio given by the stoichiometric equation while the second one is about twice the reference value. The two continuous experiments were carried out for the same time (28 days) and under the same conditions, except for the acetate and nitrate loads. As shown in Table 3, four periods can be distinguished. These periods are differentiated in Figures 1, 2 and 3 by vertical lines, which indicate process disturbances. Figure 3. 1. 2.
Nitrogen-nitrate Nitrite-nitrogen Gas production rate effluent (a), over carbon-acetate concentration time at C/N(b)=over and 1.5 and COD timeC/N at (c)C/N =removal 3.= 1.5 efficiency and C/N =over 3. time at C/N = 1.5 and C/N = 3.
Performance of the anoxic RBC reactor Effect of influent C/N ratio Variations in the removal efficiencies of nitrogennitrate (N-NO3−), carbon-acetate (C-CH3COO−) and chemical oxygen demand (COD) as a function of operating time are shown in Figure 1 (a, b and c, respectively). It is clear from the figure that, as the C/N ratio increased from 1.5 to 3.0, the substrate removal efficiencies decreased. Considering nitrogen-nitrate removal (Figure 1a), an overall efficiency of about 90.4% was obtained with a C/N = 1.5, which is a good performance and indicates that, with this ratio and using acetate as a carbon source, the tested anoxic RBC is a convenient and reliable process for the removal of nitrate from wastewater. For
Figure 1. Nitrogen-nitrate (a), carbon-acetate (b) and COD (c) removal efficiency over time at C/N = 1.5 and C/N = 3.
C/N = 3.0 the nitrogen-nitrate overall removal efficiency reduced to 73.7%. The bench-scale RBC achieved carbon-acetate overall removal efficiencies of 82.0% and 63.6%, and COD overall removal efficiencies of 70.3% and 53.8% with C/N ratios of 1.5 and 3.0, respectively (Figure 1b and 1c). These values reveal that applying a carbon/nitrogen ratio of 1.5 is appropriate. The use of a C/N ratio of 3.0 is excessive, for this denitrification system, inducing excess carbon and nitrogen in the final effluent, which is not desirable for economical and environmental
Downloaded By: [B-on Consortium - 2007] At: 10:42 19 November 2009
Environmental Technology
1385
reasons. A possible explanation for the differences found in the efficiency of the reactor when the C/N ratio was increased can be the occurrence of inhibition of the denitrifying sludge activity. Figure 2 presents nitrogen-nitrite (N-NO2−) concentration profiles in the reactor effluent for the two C/N ratios applied. The nitrite produced during the continuous experiments was not completely consumed in the reactor, and an accumulation of nitrite can be observed for both carbon/nitrogen ratios. The use of C/N = 3.0 generated much more accumulation of nitrite than the use of C/N = 1.5, which produces, again, an inefficient denitrification process. Accumulation of nitrite has been frequently found in biological denitrification processes. Several factors such as oxygen concentration, temperature, biofilm composition, toxic substances, influent nitrate concentration, availability and type of carbon source, and carbon to nitrogen ratio influence nitrite accumulation [19,23]. It is very important to avoid nitrite accumulation because it can lead to inhibition of the bacterial development [24]. Moreover, a high nitrite concentration is highly undesirable as nitrite is more toxic than nitrate [25]. Different microorganisms show different patterns of, thus nitrite accumulation is strongly influenced by the microbial species present [26]. Dhamole et al. [27] underlined the difference between true denitrifiers, which reduce nitrate to nitrogen gas, and nitrate respirators, which only have the enzymatic ability to reduce nitrate to nitrite. According to Robertson and Kuenen [28] most of the denitrifying bacteria in aquatic systems are only capable of incomplete denitrification. In mixed cultures like activated sludge, if the population of nitrate respirators is higher than that of the true denitrifiers, it will result in nitrite build-up. In the present work the accumulation of nitrite can be the result of the microbial population present inside the RBC, which is rich in nitrate-reducing bacteria.
An insufficient phosphate level leads also to nitrite accumulation [29]. In order to reduce the formation of nitrite, Teixeira and Oliveira [7] increased the phosphorus concentration tenfold (from 2 mg P L−1 to 20 mg P L−1) which resulted in a drastic decrease in the accumulation of nitrite and induced a good anoxic RBC performance. Accordingly, the low phosphate concentration may have limited the conversion of nitrite to harmless nitrogen gas, and most probably it would have been advantageous to increase the phosphorus concentration. According to Zhou et al. [1], acidic and alkaline environments are not convenient for denitrification, and the pH value plays an important role in nitrite accumulation. The main reason is that pH influences the enzyme activity of bacteria. Thus, an alkaline environment can also be the explanation for nitrite build-up once the pH of the effluent (approximately 7.8 at C/N = 1.5 and 9.0 at C/N = 3.0) was considerably higher than the pH of the influent (approximately 6.6). The gas production rate can be used to evaluate the metabolic activity of denitrifying microorganisms [6]. The differences in gas production between the carbon/ nitrogen ratios of 1.5 and 3.0 are presented in Figure 3. Because of a gas leak from the reactor at C/N = 3.0, which was corrected on day 7, the produced gas flow rate is only presented from that moment onwards. Increasing C/N ratio from 1.5 to 3.0 resulted in a significant decrease in gas production, which agrees with the nitrogen-nitrite (N-NO2−) concentration profile. The gas composition for the C/N ration of = 1.5 was on average 93% N2, 2% CO2, 0.2% N2O and 3% O2 and at C/N = 3.0 there was a slight decrease in N2 to 92%. Evolution of CO2 from acetate was low because it was mainly solubilized in the medium, promoting an increase in alkalinity. In fact, in both experiments, the pH of the effluent was considerably higher than the pH of the influent. Production of N2O was below 0.2% (minimum detection value). A small concentration of
Figure 2. Nitrite-nitrogen effluent concentration over time at C/N = 1.5 and C/N = 3.
Figure 3. N = 3.
Gas production rate over time at C/N = 1.5 and C/
1386
S. Cortez et al.
Effect of nitrogen and carbon load To study the effect of the influent nitrogen and carbon load on the removal efficiency, on the eighth day of operation the influent nitrogen-nitrate and carbonacetate concentrations were doubled, while the C/N ratio and the HRT were kept constant. It can be seen from Figure 1 that nitrogen-nitrate, carbon-acetate and COD removal efficiencies decreased but not very significantly. The increase in nitrogen-nitrate and carbon-acetate influent concentrations, keeping C/N constant, therefore had a slight negative effect in terms of substrate removal. Similarly, nitrite build-up rose with an increase in influent nitrogen and carbon concentrations (Figure 2). The maximum substrate removal efficiencies were obtained in the first period of operation with an influent nitrogen-nitrate concentration of 50 mg N-NO3− L−1 and an HRT of 10 h.
reactors. They reported that nearly 100% nitrate removal efficiency was achieved with an influent nitrogen-nitrate concentration of 100 mg N-NO3− L−1 and 9 h of retention time. Additionally they found that a carbon to nitrogen ratio of 1.5 was optimal for denitrification in that research. It is important to note that, in spite of C/N = 1.5 presenting an overall COD removal of 70.3%, with an influent carbon-acetate load of 150 mg CCH3COO− L−1 and at an HRT lower than 10 h the COD concentration value in the denitrified effluent was about 200 mg O2 L−1, which exceeds the legal European Union upper limit of 125 mg O2 L−1 [35]. It can be speculated that at higher flow rates more biofilm was detached from the discs and was quantified in the COD measurement. It is also relevant to emphasize that with a C/N ratio of 1.5, excluding the period of operation when HRT was 5.68 h, it was possible to reduce effluent nitrate concentrations to levels below the admissible value required by the European Union wastewater discharge standards considering that the receiving environment will be, for example, fresh water (10– 30 mg N-NO3− L−1) [35]. Under a carbon/nitrogen ratio of 3.0 the overall average value of effluent nitrate concentration was about 26.0 mg N-NO3− L−1, and the required limit was only attained in the first period of operation.
Effect of hydraulic retention time It is very important to determine the appropriate HRT for the reactor because the performance of denitrification is obviously associated with HRT. An HRT too short will result in low removal rates, whereas an HRT that is too long will not be economically feasible. For a biological system to compete successfully with conventional physico-chemical methods of treatment, the shortest possible HRT associated with the most efficient removal rates is required [33]. The influence of the HRT on the anoxic RBC performance is shown in Figure 1 taking into account the three last periods (when nitrogen and carbon loads were maintained constant). As expected, nitrogen-nitrate, carbon-acetate and COD removal decreased with the decrease in the HRT and increase in flow rate; however, this decrease was not very pronounced. So, for an influent nitrogen-nitrate concentration of 100 mg N-NO3− L−1, it can be economically advantageous to use the anoxic RBC with an HRT lower than 10 h. Generally, a decrease in the hydraulic retention time stimulated also a slight increase in nitrite accumulation (Figure 2). Dahab and Lee [34] successfully used acetic acid as the carbon source, to remove nitrate from a simulated groundwater using anoxic bench-scale static-bed upflow
Biofilm properties To optimize the removal of nitrate and organic matter from wastewater in an RBC, an adequate understanding of the dynamic nature and characteristics of the biofilm, the major constituent of the process, is essential. The biofilm character that develops on an RBC can significantly affect its performance. This, in turn, depends on the operating conditions [4]. For both carbon/nitrogen ratios assayed, the development of the biofilm on the discs of the RBC was clearly observable some days after the reactor inoculation, displaying a light-yellow tone that was maintained until the end of the experiment. When the reactor was stopped and opened, in both cases the biofilm was easily removed. For C/N = 1.5 the biofilm was very uniform, whereas for C/N = 3.0 the biofilm presented some roughness (its surface was not homogeneous). After biofilm collection some physical characteristics such as thickness, density and humidity were determined, which are summarized in Table 4. It can be observed that the biofilm thickness obtained in both continuous experiments varied with the position of the disc in the reactor, being greater at the entrance and smaller at the exit of the reactor. Biofilms of wastewater treatment systems are characterized by being rather thick (>0.6 mm) [36], and these results
Downloaded By: [B-on Consortium - 2007] At: 10:42 19 November 2009
O2 (approximately 3%) was detected in the gas composition analysed. It is important to note that, initially, biological denitrification was considered to be strictly anoxic [30], with O2 below 0.5 mg L−1 [31]. However, with a certain number of bacteria, denitrification occurs even in the presence of O2 [32]. If methane gas was produced, it would be detected by the used system.
1387
Environmental Technology Table 4.
Physical properties of the biofilm developed in the anoxic RBC at C/N = 1.5 and C/N = 3.0. Thickness (mm)
Density (g TS L−1)
Wet weight/dry weight
% Water
Biofilm
C/N = 1.5
C/N = 3
C/N = 1.5
C/N = 3
C/N = 1.5
C/N = 3
C/N = 1.5
C/N = 3
First discs Middle discs Last discs
2.8 ± 0.3 1.6 ± 0.1 0.7 ± 0.1
3.5 ± 0.2 1.9 ± 0.2 0.8 ± 0.1
7.9 ± 0.1 4.6 ± 0.1 3.9 ± 0.4
9.1 ± 3.3 7.7 ± 1.5 4.5 ± 1.6
41.2 ± 7.3 44.9 ± 3.5 50.0 ± 5.7
29.8 ± 0.8 30.5 ± 1.1 34.4 ± 3.1
97.5 ± 0.4 97.8 ± 0.2 98.0 ± 0.2
96.6 ± 0.1 96.7 ± 0.1 97.1 ± 0.2
Downloaded By: [B-on Consortium - 2007] At: 10:42 19 November 2009
TS, total solids.
corroborate this (even in the last discs the thickness was above 0.7 mm). For both experiments, biofilm density decreased along the reactor, which can be attributed to a sparser growth of biomass on the media surface. This is in accordance with the hydration values given by the ratio between the wet weight and dry weight of the biofilm and the percentage of water, which show that on the final discs the biofilm was more hydrated. The biofilm formed under C/N = 1.5 was less dense and more hydrated than biofilm grown with C/N = 3.0. This means that for C/N = 3.0 more biomass was formed. Taking into account the previously presented removal results, this can indicate that, at this condition, the whole biofilm was not entirely active, and biofilm activity was not proportional to the quantity of fixed biomass, as discussed by Lazarova and Manem [37]. This also leads to the conclusion that biofilm activity must be always considered and studied. Moreover, a higher biomass might be due to an increase in the biofilm matrix. Biofilms are formed by bacterial cells embedded in a polymeric matrix. The main components of the matrix are polysaccharides and proteins. The specific matrix composition for any biofilm depends upon the organism(s) present, their physiological status, the nature of the growth environment, bulk fluid flow dynamics, the substratum and the prevailing physical conditions. Thus, it is probable that biofilm matrices, even those produced by identical organisms, will vary greatly in their composition and in their physical properties [38]. The composition of the polymeric matrix of biofilms formed under C/N = 1.5 and C/N = 3.0 is presented in Table 5. Protein and polysaccharide content can only be considered in comparative terms, on account of the standards used in their quantification: BCA and glucose, respectively, which do not allow the Table 5.
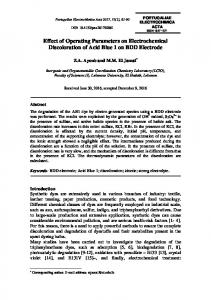
expression of absolute values. The protein content of the biofilm grown under C/N = 3.0 presented values higher than the biofilm formed at C/N = 1.5. In contrast, the matrix polysaccharides were produced in a higher quantity at C/N = 1.5. An increase in the protein content was observed along the reactor for both C/N ratios. On the other hand, the polysaccharide content did not change significantly (Table 5). This behaviour is probably due to a higher degree of cell lysis in the last discs. Biofilm activity A key parameter in water and wastewater treatment technology is microbial activity, expressed in terms of substrate removal ability. However, this parameter is not always linearly correlated with the conventional biofilm descriptors such as dry weight, COD or biofilm thickness [38]. In order to determine the denitrifying biofilm activity, for both C/N ratios, batch tests were performed using biofilm samples removed from the continuous denitrifying reactor. In these activity tests, nitrate was completely consumed in 7 h and 10 h for a C/N ratio of 1.5 and 3.0, respectively. The nitrite formed during the batch assays, if any, was completely consumed at the end of the experiment. The activity of the biofilm portions removed from the first and second discs, three middle discs and the three last discs for both experiments was expressed as specific consumption rates for nitrate and acetate (Figures 4 and 5). As can be observed in Figures 4 and 5, the biofilm of the first discs presented specific acetate and nitrate consumption rates higher than in the other discs. A biofilm with superior activity in the first discs should be expected because of the higher substrate concentration in the inlet zone. Specific acetate consumption for C/N Figure 4. 5. Specific nitrogen-nitrate carbon-acetate consumption consumptionrate rateofofbiofilm biofilmportions portionsremoved removedfrom fromthe thefirst firstdiscs, discs,the thethree threemiddle middlediscs discsand andthe thethree threelast lastdiscs discsatatC/N C/N==1.5 1.5( ( !) !)and andC/N C/N==33(!). (!).
Composition of the polymeric matrix of biofilms formed at C/N = 1.5 and C/N = 3. Matrix protein (mg BCA g−1TS)
Matrix polysaccharides (mg glucose g−1 TS)
Biofilm
C/N = 1.5
C/N = 3
C/N = 1.5
C/N = 3
First discs Middle discs Last discs
2.34 ± 0.09 4.39 ± 0.08 6.41 ± 0.08
5.15 ± 0.62 5.50 ± 0.10 9.57 ± 0.22
9.89 ± 0.11 8.47 ± 0.23 9.82 ± 0.08
6.64 ± 0.36 4.67 ± 0.13 6.82 ± 0.44
1388
S. Cortez et al.
Figure 4. Specific nitrogen-nitrate consumption rate of biofilm portions removed from the first discs, the three middle discs and the three last discs at C/N = 1.5 (!) and C/N = 3 (!).
constant, and the decrease in HRT had a slight negative effect in terms of substrate removal. The RBC proved, therefore, to be very robust in coping with changes in substrate loads. The accumulation of nitrite occurred in both experiments, which could probably be lowered with an increase in phosphorus influent concentration. Based on experimental results of this study, it can be concluded that the tested anoxic RBC is a potential and convenient process for the removal of nitrate from wastewater. Acknowledgements
Downloaded By: [B-on Consortium - 2007] At: 10:42 19 November 2009
Susana Cortez and Pilar Teixeira fully acknowledge the financial support provided from Fundação para a Ciência e Tecnologia (FCT) through the grants SFRH/BD/24715/2005 and SFRH/BPD/26803/2006, respectively.
References [1] M. Zhou, W. Fu, H. Gu, and L. Lei, Nitrate removal from groundwater by a novel three-dimensional electrode biofilm reactor, Electrochim. Acta 52 (2007), pp. 6052–6059. [2] S. Aslan and H. Cakici, Biological denitrification of drinking water in a slow sand filter, J. Hazard. Mater. 148 (2007), pp. 253–258. [3] V. Mateju, S. Cizinska, J. Krejei, and T. Janoch, Biological water denitrification: A review, Enzyme Microb. Technol. 14 (1992), pp. 170–183. [4] S. Cortez, P. Teixeira, R. Oliveira, and M. Mota, Rotating biological contactors: A review on main factors affecting performance, Rev. Environ. Sci. Biotechnol. 7 (2008), pp. 155–172. [5] S. Isaacs, M. Henze, H. Søeberg, and M. Kümmel, External carbon source addition as a means to control an activated sludge nutrient removal process, Water Res. 28 (1994), pp. 511–520. [6] A. Beaubien, Y. Hu, D. Bellahcen, V. Urbain, and J. Chang, Monitoring metabolic activity of denitrification processes using gas production measurements, Water Res. 29 (1995), pp. 2269–2274. [7] P. Teixeira and R. Oliveira, Denitrification by Alcaligenes denitrificans in a closed rotating biological contactor, Biotechnol. Lett. 22 (2000), pp. 1789–1792. [8] A. Mohseni-Bandpi, D.J. Elliott, and A. MomenyMazdeh, Denitrification of groundwater using acetic acid as a carbon source, Water Sci. Technol. 40 (1999), pp. 53–59. [9] M. Sanchez, A. Mosquera-Corral, R. Mendez, and J.M. Lema, Simple methods for the determination of the denitrifying activity of sludges, Bioresour. Technol. 75 (2000), pp. 1–6. [10] S. Hallin, I.N. Throback, J. Dicksved, and M. Pell, Metabolic profiles and genetic diversity of denitrifying communities in activated sludge after addition of methanol or ethanol, Appl. Environ. Microbiol. 72 (2006), pp. 5445–5452. [11] J.M. Gálvez, M.A. Gómez, E. Hontoria, and J. González-López, Influence of hydraulic loading and air flowrate on urban wastewater nitrogen removal with a submerged fixed-film reactor, J. Hazard. Mater. 101 (2003), pp. 219–229. [1]
Figure 5. Specific carbon-acetate consumption rate of biofilm portions removed from the first discs, the three middle discs and the three last discs at C/N = 1.5 (!) and C/N = 3 (!).
[2]
= 3.0 was almost constant along the reactor. The activity of the biofilm formed under C/N = 1.5 was always higher than under C/N = 3.0, which is in agreement with the results of nitrate, acetate and COD removal. It must be noted that, thicker biofilms were less active. Thus, in spite of a lower thickness, the biofilm grown under a carbon/nitrogen ratio of 1.5 was composed of very active cells. This reinforces the importance of biofilm activity for the denitrification rate. Specific acetate and nitrate consumption rates are influenced by several parameters and are expressed in the literature in different ways, making their comparison difficult, mainly when referring to a heterogeneous culture of microorganisms, as it is the case for activated sludge.
[3]
[4]
[5]
[6]
[7]
[8]
Conclusions The results of nitrogen-nitrate, acetate and COD removal efficiencies indicate good performance of the anoxic RBC, using acetate as carbon source. The average removal efficiency in terms of nitrogen-nitrate was about 90.4% at a C/N = 1.5 lowering to 73.7% at a C/N = 3.0. Considering carbon-acetate removal, overall efficiencies of 82.0% and 63.6% were attained at C/N ratios of 1.5 and 3.0, respectively. These results provide evidence that, for the tested conditions, the use of C/N = 1.5 is more economically and environmentally advantageous than C/N = 3.0. Additionally, it was observed that the increase in nitrogen-nitrate and carbon-acetate influent concentrations, keeping C/N
[9]
[10]
[11]
[12]
Environmental Technology [12] J. van Rijn, Y. Tal, and H.J. Schreier, Denitrification in recirculating systems: Theory and applications, Aquacult. Eng. 34 (2006), pp. 364–376. [13] Y.C. Chiu and M.S. Chung, Determination of optimal COD/nitrate ratio for biological denitrification, Int. Biodeterior. Biodegrad. 51 (2003), pp. 43–49. [14] P.O. Bickers and A.J. van Oostrom, Availability for denitrification of organic carbon in meat-processing wastestreams, Bioresour. Technol. 73 (2000), pp. 53–58. [15] APHA, AWWA, and WPCF, Standard Methods for the Examination of Water and Wastewater, 17th ed., American Public Health Association, Washington, DC, 1989. [16] J. Azeredo, V. Lazarova, and R. Oliveira, Methods to extract the exopolymeric matrix from biofilms: A comparative study, Water Sci. Technol. 39 (1999), pp. 243–250. [17] M. Dubois, K.A. Gilles, J.K. Hamilton, P.A. Rebers, and F. Smith, Colorimetric method for determination of sugars and related substances, Anal. Chem. 28 (1956), pp. 350–355. [18] P. Teixeira and R. Oliveira, Denitrification in a closed rotating biological contactor: Effect of disk submergence, Process Biochem. 37 (2001), pp. 345–349. [19] J.J. Her and J.S. Huang, Influences of carbon source and C/N ratio on nitrate/nitrite denitrification and carbon breakthrough, Bioresour. Technol. 54 (1995), pp. 45–51. [20] H. Constantin and M. Fick, Influence of C-sources on the denitrification rate of a high-nitrate concentrated industrial wastewater, Water Res. 31 (1997), pp. 583–589. [21] J. Reyes-Ávila, E. Razo-Flores, and J. Goméz, Simultaneous biological removal of nitrogen, carbon and sulfur by denitrification, Water Res. 38 (2004), pp. 3313–3332. [22] P.L. McCarty, L. Beck, and P.S. Amant, Biological denitrification of wastewaters by addition of organic materials, in Proceedings of the 24th Purdue Industrial Waste Conference, Purdue University, Lafayette, IN, 1969. [23] B. Moreno, M.A. Gomez, J. Gonzalez-Lopez, and E. Hontoria, Inoculation of a submerged filter for biological denitrification of nitrate polluted groundwater: A comparative study, J. Hazard. Mater. 117 (2005), pp. 141–147. [24] H. Constantin, S. Raoult, W. Montigny, and M. Fick, Denitrification of concentrated industrial wastewater: Microorganism selection and kinetic studies, Environ. Technol. 17 (1996), pp. 831–840. [13]
[14]
[15]
[16]
[17]
Downloaded By: [B-on Consortium - 2007] At: 10:42 19 November 2009
[18]
[19]
[20]
[21]
[22]
[23]
[24]
[25]
1389
[25] W.J. Hunter, Accumulation of nitrite in denitrifying barriers when phosphate is limiting, J. Contam. Hydrol. 66 (2003), pp. 79–91. [26] M. Blaszczyk, Comparison of denitrification by Paracoccus denitrificans, Pseudomonas stutzeri and Pseudomonas aeruginosa, Acta Microbiol. Pol. 41 (1992), pp. 203–210. [27] P.B. Dhamole, R.R. Nair, S.F. D’Souza, and S.S. Lele, Denitrification of high strength nitrate waste, Bioresour. Technol. 98 (2007), pp. 247–252. [28] L.A. Robertson and G. Kuenen, Nitrogen removal from water and waste, in Microbial Control of Pollution, J.C. Fry, G.M. Gadd, R.A. Herbert, C.W. Jones, and I.A. Watson-Craik, eds., Cambridge University Press, 1991, pp. 227–267. [29] C. Reisinger, R. Braun, and A. Moser. Cybernetic and technical aspects for advanced biological drinking water treatment, Workshop on Strategies for Closed Cycle Production, Department of Biotechnology, Technical University of Graz, Austria, 1989. [30] W.J. Payne, Reduction of nitrogenous oxides by microorganisms, Bacteriol. Rev. 37 (1973), pp. 409–452. [31] J.P. van der Hoek, J.W.N.M. Kappelhof, and J.C. Schippers, The use of vacuum deaeration in biological nitrate removal processes, J. Water Supply Res. Technol. AQUA 43 (1994), pp. 84–94. [32] T. Lukow and H. Diekmann, Aerobic denitrification by a newly isolated heterotrophic bacterium strain TL1, Biotechnol. Lett. 19 (1997), pp. 1157–1159. [33] S.C. Costley and F.M. Wallis, Effect of flow rate on heavy metal accumulation by rotating biological contactor (RBC) biofilms, J. Ind. Microbiol. Biotechnol. 24 (2000), pp. 244–250. [34] M.F. Dahab and Y.W. Lee, Nitrate removal from water supplies using biological denitrification, J. Water Pollut. Control Fed. 60 (1988), pp. 1670–1678. [35] CEC, Council Directive of 21 May 1991 concerning Urban Wastewater Treatment (91/271/EEC), OJ L135/ 40, May 30th (1991). [36] P.L. Bishop, Biofilm structure and kinetics, in Proceedings of the Third International IAWQ Special Conference on Biofilm Systems, Copenhagen, August, 1996. [37] V. Lazarova and J. Manem, Biofilm characterization and activity analysis in water and wastewater treatment, Water Res. 29 (1995), pp. 2227–2245. [38] D.G. Allison, The biofilm matrix, Biofouling 19 (2003), pp. 139–150. [26]
[27]
[28]
[29]
[30]
[31]
[32]
[33]
[34]
[35]
[36]
[37]
[38]