Hindawi Wireless Communications and Mobile Computing Volume 2018, Article ID 6492143, 8 pages https://doi.org/10.1155/2018/6492143
Research Article Effect of Randomness in Element Position on Performance of Communication Array Antennas in Internet of Things Congsi Wang ,1,2 Yan Wang ,1 Xiaodong Yang Yiqun Zhang,6 and Meng Wang 7
,3 Wei Gao,2 Chao Jiang,4 Lu Wang,5
1
Key Laboratory of Electronic Equipment Structure Design, Ministry of Education, Xidian University, Xi’an 710071, China School of Civil and Environmental Engineering, University of New South Wales, Sydney, NSW 2052, Australia 3 School of Electronic Engineering, Xidian University, Xi’an 710071, China 4 State Key Laboratory of Advanced Design and Manufacturing for Vehicle Body, College of Mechanical and Vehicle Engineering, Hunan University, Changsha 410082, China 5 CETC No. 38 Research Institute, Hefei 230088, China 6 Nanjing Research Institute of Electronics Technology, Nanjing 210039, China 7 Research Institute of Shaanxi Huanghe Group Co., Ltd., Xi’an 710043, China 2
Correspondence should be addressed to Yan Wang;
[email protected] Received 30 October 2017; Revised 7 January 2018; Accepted 29 January 2018; Published 21 March 2018 Academic Editor: Hassan T. Chattha Copyright © 2018 Congsi Wang et al. This is an open access article distributed under the Creative Commons Attribution License, which permits unrestricted use, distribution, and reproduction in any medium, provided the original work is properly cited. As a critical component for wireless communication, active phased array antennas face the restrictions of creating effective performance with the effect of randomness in the position of the array element, which are inevitably produced in the manufacturing and operating process of antenna. A new method for efficiently and effectively evaluating the statistic performance of antenna is presented, with consideration of randomness in element position. A coupled structural-electromagnetic statistic model for array antenna is proposed from the viewpoint of electromechanical coupling. Lastly, a 12 × 12 planar array is illustrated to evaluate the performance of antenna with the saddle-shaped distortion and random position error. The results show that the presented model can obtain the antenna performance quickly and effectively, providing an advantageous guidance for structural design and performance optimization for array antennas in wireless application.
1. Introduction The application of wireless communication promotes the realization and development of physical things in our daily life exchanging information from a network, which is called the Internet of Things (IoT) [1–3]. In the wireless communication, the choice of antenna is a critical component. Active phased array antennas have such significant advantages, including rapid reconfiguration or revisit rate, multibeams, shaped beams, sidelobe control, and high reliability over other types of antennas, and there has been an increased interest in their use for a wide variety of communication and remote-sensing applications, such as serving as the ground station terminal to track the satellite for IOT data connection [4]. In the working process, however, the manufacturing and processing of the antenna, any movement of the carrier
platform, and the external environment load could lead to the structure errors, including both the random position error and systematic error. The combination of the random position error and systematic distortion finally results in the randomness in element position. Finally, the electromagnetic performance of array antenna could be degraded, such as the gain loss, sidelobe level (SLL) rising, beam width broadening, and pointing error [5–9]. As a result, the communication distance will be shortened and the resistance to interference will be reduced, which seriously restricts the realization of high performance of array antenna. The antenna faces the restrictions of creating effective performance under structure errors. Therefore, it is necessary to explore deeply the coupling relationship between structure error and electromagnetic performance for active phased array antenna with the effect of randomness in element position [10–12].
2
Wireless Communications and Mobile Computing z
0
dy
1
N−1
1 o
dx
y
Therefore, this paper presents a new method for efficiently and effectively evaluating the statistic performance of active phased array antenna, with consideration of randomness in the position of the array element. A coupled structural-electromagnetic statistic model is proposed, from the viewpoint of electromechanical coupling. The method provides an advantageous guidance for structural design and performance optimization for array antennas in wireless application.
(m, n) M−1 x
Figure 1: Element configuration of planar array antenna.
The present works for analyzing the effect of structure error on electromagnetic performance of array antenna are carried out mainly from the following three aspects. Firstly, assuming that the systematic distortion of antenna is a certain shape and that the influence of only systematic error on performance is analyzed, [13] studied the effect of symmetrical and unsymmetrical bend of array plane on the performance of planar antenna. Reference [14] discussed the influence of four array plane distortions including the sag, potato chip, and sinusoidal and Bessel character for array antenna. The above works in [13, 14] consider only the systematic error without considering the random position errors which are also produced inevitably during the manufacturing and working process. Secondly, some works are focusing on the analysis of the effect of random error uncertainty. Reference [15] explored the influence of random errors on the performance of hexagonal active phased array antenna and achieved some instructive conclusions. But there are no discussions on the systematic distortion. Furthermore, there is research indicating that the effect of random errors could be equivalent to the influence of excitation current errors, and the performances of antenna with random current errors are studied [16, 17]. However, there is lack of direct relationship of random position error with the antenna performance. In addition, [18] investigated the subarray position error and its influence on antenna performance by using the probability statistical theory. But the method requires lots of repeated calculations to get the statistical performance of antenna. Thirdly, some works introduced the linear combination of random error and systematic distortion to analyze their effect on antenna performance. In [19, 20], the sum of random error and systematic error was regarded as the structure error item, used to analyze the performance of distorted array antenna. However, in practice the degrees of random error and systematic error show great differences; the linear combination could mitigate the effect of random error when there is big difference between the degrees of random and systematic errors. Moreover, systematic error is supposed to be deterministic but random error is stochastic; the combination errors could result in the randomness of electromagnetic performance. So it is more accurate to estimate the electromagnetic performance from the perspective of statistic property when random error exists.
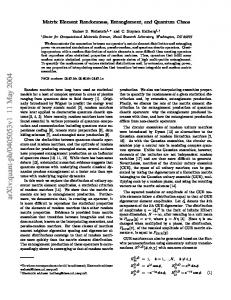
2. Coupled Structure-Electromagnetic Statistic Model with Randomness in Element Position As shown in Figure 1, the array radiation elements are assembled with an equal interval, whose numbers are 𝑀 × 𝑁. The intervals of the array elements along 𝑥 and 𝑦 directions are 𝑑𝑥 and 𝑑𝑦 , respectively. (𝜃, 𝜙) is the direction of the far-field target relative to the coordinate system 𝑂𝑥𝑦𝑧 as shown in Figure 2, whose direction cosine is (cos 𝛼𝑥 , cos 𝛼𝑦 , cos 𝛼𝑧 ) [21]. The manufacturing and working process of antenna lead to the structure errors, including the random error and systematic distortion. Suppose the random error of element 𝑟 𝑟 𝑟 , Δ𝑦𝑚𝑛 , Δ𝑧𝑚𝑛 ); (𝑚, 𝑛) (0 ≤ 𝑚 ≤ 𝑀−1, 0 ≤ 𝑛 ≤ 𝑁−1) is (Δ𝑥𝑚𝑛 𝑟 the phase difference ΔΦ𝑚𝑛 in regard to the coordinate origin in Figure 1 is given as follows. 𝑟 𝑟 ΔΦ𝑟𝑚𝑛 = 𝑘 (Δ𝑥𝑚𝑛 sin 𝜃 cos 𝜙 + Δ𝑦𝑚𝑛 sin 𝜃 sin 𝜙 𝑟 cos 𝜃) . + Δ𝑧𝑚𝑛
(1)
Next, suppose the systematic distortion of element (𝑚, 𝑛) 𝑠 𝑠 𝑠 is (Δ𝑥𝑚𝑛 , Δ𝑦𝑚𝑛 , Δ𝑧𝑚𝑛 ); the phase difference ΔΦ𝑠𝑚𝑛 in regard to the coordinate origin in Figure 1 is given as follows. 𝑠 𝑠 ΔΦ𝑠𝑚𝑛 = 𝑘 (Δ𝑥𝑚𝑛 sin 𝜃 cos 𝜙 + Δ𝑦𝑚𝑛 sin 𝜃 sin 𝜙 𝑠 cos 𝜃) . + Δ𝑧𝑚𝑛
(2)
According to the superposition principle of the array antenna without element coupling, the filed density pattern function for planar rectangular active phased array antenna with systematic distortion and random position error is developed as follows. 𝐸𝑠𝑟 (𝜃, 𝜙) 𝑀−1 𝑁−1
𝑟
𝑠
= 𝑓𝑒 (𝜃, 𝜙) ∑ ∑ 𝐼𝑚𝑛 ⋅ 𝑒𝑗(ΔΦ𝑚𝑛 +ΔΦ𝑚𝑛 +ΔΦ𝑚𝑛 +𝜑𝑚𝑛𝐵 ) ,
(3)
𝑚=0 𝑛=0
where 𝑓𝑒 (𝜃, 𝜙) is the pattern function of element in free space, 𝐼𝑚𝑛 is the amplitude of excitation current of element (𝑚, 𝑛), 𝜑𝑚𝑛𝐵 is the array’s inherent phase difference determined by phase shifter, and ΔΦ𝑚𝑛 = 𝑘𝑚𝑑𝑥 sin 𝜃 cos 𝜙 + 𝑘𝑛𝑑𝑦 sin 𝜃 sin 𝜙 is the initial spatial phase distribution. In practice, random position errors of elements are probabilistic variables; it is necessary to analyze the statistic property of electromagnetic performance for array antenna with random error included. Suppose the random position
Wireless Communications and Mobile Computing
3 where 𝜎𝐸2 𝑠𝑟 is the variance of function 𝐸𝑠𝑟 (𝜃, 𝜙). The expression of the variance 𝜎𝐸2 𝑠𝑟 is presented as follows. Firstly, as a vector quantity, 𝐸𝑠𝑟 (𝜃, 𝜙) can be represented as the combination of the real part and imaginary part [23]. 𝑁−1 𝑀−1 𝑁−1 Assume 𝑋 = ∑𝑀−1 𝑚=0 ∑𝑛=0 𝑋𝑚𝑛 and 𝑌 = ∑𝑚=0 ∑𝑛=0 𝑌𝑚𝑛 are the real and imaginary parts, respectively. The expressions of 𝑋𝑚𝑛 and 𝑌𝑚𝑛 are 𝑋𝑚𝑛 = 𝑓𝑒 (𝜃, 𝜙) ⋅ 𝐼𝑚𝑛 ⋅ cos(ΔΦ𝑚𝑛 + ΔΦ𝑟𝑚𝑛 + ΔΦ𝑠𝑚𝑛 + 𝜑𝑚𝑛𝐵 ) and 𝑌𝑚𝑛 = 𝑓𝑒 (𝜃, 𝜙) ⋅ 𝐼𝑚𝑛 ⋅ sin(ΔΦ𝑚𝑛 + ΔΦ𝑟𝑚𝑛 + ΔΦ𝑠𝑚𝑛 + 𝜑𝑚𝑛𝐵 ), respectively. Next, the variance 𝜎𝐸2 𝑠𝑟 is deduced as follows.
z Far-field target P r0 y
o
y
𝑀−1 𝑁−1
𝑀−1 𝑁−1
𝑚=0 𝑛=0
𝑚=0 𝑛=0
2 2 + 𝜎𝑌2 = ∑ ∑ 𝜎𝑋 + ∑ ∑ 𝜎𝑌2𝑚𝑛 , 𝜎𝐸2 𝑠𝑟 = 𝜎𝑋 𝑚𝑛
x
Figure 2: Space geometrical relationship of far-field target.
2
𝑟 𝑟 𝑟 errors along 𝑥, 𝑦, and 𝑧 directions are Δ𝑥𝑚𝑛 , Δ𝑦𝑚𝑛 , and Δ𝑧𝑚𝑛 ,
which are subjected to the normal distribution, with means of zero and variances of 𝜎𝑥2 , 𝜎𝑦2 , and 𝜎𝑧2 , respectively. Then phase difference ΔΦ𝑟𝑚𝑛 in (1) is also normally distributed, and the variance is obtained as follows. 𝜎Φ2 𝑟
=𝑘
2
[𝜎𝑥2
2
(sin 𝜃 cos 𝜙) +
𝜎𝑦2
(sin 𝜃 sin 𝜙)
2
𝑋𝑚𝑛 = 𝑓𝑒 (𝜃, 𝜙) ⋅ 𝐼𝑚𝑛 ⋅ cos (ΔΦ𝑚𝑛 + ΔΦ𝑠𝑚𝑛 + 𝜑𝑚𝑛𝐵 ) 𝑒−(1/2)𝜎Φ𝑟 2 = 𝑓 (𝜃, 𝜙)2 ⋅ 𝐼2 𝑋𝑚𝑛 𝑒 𝑚𝑛
𝐸𝑠𝑟 (𝜃, 𝜙)
(9) 2
1 + cos (2ΔΦ𝑚𝑛 + 2ΔΦ𝑠𝑚𝑛 + 2𝜑𝑚𝑛𝐵 ) 𝑒−2𝜎Φ𝑟 ⋅ . 2 2 is deduced as follows. Therefore, the variance 𝜎𝑋 𝑚𝑛
2 2 2 = 𝑓𝑒 (𝜃, 𝜙) 𝐼𝑚𝑛 𝜎𝑋 𝑚𝑛
𝑀−1 𝑁−1
𝑠
= 𝑓𝑒 (𝜃, 𝜙) ∑ ∑ 𝐼𝑚𝑛 ⋅ 𝑒𝑗(ΔΦ𝑚𝑛 +ΔΦ𝑚𝑛 +𝜑𝑚𝑛𝐵 ) ⋅ 𝑒𝑗ΔΦ𝑚𝑛 𝑟
(5)
𝑚=0 𝑛=0
2 −(1/2)𝜎Φ 𝑟
2
1 + cos (2ΔΦ𝑚𝑛 + 2ΔΦ𝑠𝑚𝑛 + 2𝜑𝑚𝑛𝐵 ) 𝑒−2𝜎Φ𝑟 ⋅( 2
,
where 𝐸𝑠 (𝜃, 𝜙) is the field density pattern function with only the systematic distortion existing. Then the mean of the power pattern function for array antenna is deduced according to the property of variance ∗ ∗ (𝜃, 𝜙) − 𝐸 (𝜃, 𝜙) ⋅ 𝐸 (𝜃, 𝜙) as follows. 𝜎𝐸2 𝑠𝑟 = 𝐸𝑠𝑟 (𝜃, 𝜙) ⋅ 𝐸𝑠𝑟 𝑠𝑟 𝑠𝑟 ∗ (𝜃, 𝜙) 𝑃𝑠𝑟 (𝜃, 𝜙) = 𝐸𝑠𝑟 (𝜃, 𝜙) ⋅ 𝐸𝑠𝑟
=
Since the function cos(ΔΦ𝑚𝑛 + ΔΦ𝑟𝑚𝑛 + ΔΦ𝑠𝑚𝑛 + 𝜑𝑚𝑛𝐵 ) is 2 equal to cos(ΔΦ𝑚𝑛 + ΔΦ𝑠𝑚𝑛 + 𝜑𝑚𝑛𝐵 )𝑒−(1/2)𝜎Φ𝑟 , then
2
For any random variable with normal distribution, expressed as 𝑥 ∼ 𝑁(0, 𝜎𝑥 ), the function relations cos 𝑥 and sin 𝑥 can be obtained from [22]. Applying the function rela2 tions, the mean of exponential function is 𝑒𝑗𝑥 = 𝑒−𝜎𝑥 /2 . Therefore, the mean of the field density pattern function 𝐸𝑠𝑟 (𝜃, 𝜙) in (3) is deduced as follows.
𝜎𝐸2 𝑠𝑟
2
2 2 2 −𝑋 2 where 𝜎𝑋 = 𝑋𝑚𝑛 𝑚𝑛 and 𝜎𝑌𝑚𝑛 = 𝑌𝑚𝑛 − 𝑌𝑚𝑛 . 𝑚𝑛
(4)
+ 𝜎𝑧2 (cos 𝜃)2 ] .
= 𝐸𝑠 (𝜃, 𝜙) ⋅ 𝑒
(8)
∗
(6)
+ 𝐸𝑠𝑟 (𝜃, 𝜙) ⋅ 𝐸𝑠𝑟 (𝜃, 𝜙) .
1 + cos (2ΔΦ𝑚𝑛 + 2ΔΦ𝑠𝑚𝑛 + 2𝜑𝑚𝑛𝐵 ) −𝜎Φ2 𝑒 𝑟). 2
𝑟 + Δ𝜑𝑠 + 𝜑 Since the function sin(Δ𝜑𝑚𝑛 + Δ𝜑𝑚𝑛 𝑚𝑛𝐵 ) is 𝑚𝑛 2 𝑠 −(1/2)𝜎Φ 𝑟 , then equal to sin(Δ𝜑𝑚𝑛 + Δ𝜑𝑚𝑛 + 𝜑𝑚𝑛𝐵 )𝑒
𝑌𝑚𝑛 = 𝑓𝑒 (𝜃, 𝜙) ⋅ 𝐼𝑚𝑛 ⋅ sin (2ΔΦ𝑚𝑛 + 2ΔΦ𝑠𝑚𝑛 + 2𝜑𝑚𝑛𝐵 ) 2
⋅ 𝑒−(1/2)𝜎Φ𝑟
Substituting the function 𝐸𝑠𝑟 (𝜃, 𝜙) into (6), the mean of power pattern function is expressed as follows. 2 2 𝑃𝑠𝑟 (𝜃, 𝜙) = 𝜎𝐸2 𝑠𝑟 + 𝐸s (𝜃, 𝜙) ⋅ 𝑒−𝜎Φ𝑟 ,
−
(11)
2 = 𝑓 (𝜃, 𝜙)2 ⋅ 𝐼2 𝑌𝑚𝑛 𝑒 𝑚𝑛 2
(7)
(10)
1 − cos (2ΔΦ𝑚𝑛 + 2ΔΦ𝑠𝑚𝑛 + 2𝜑𝑚𝑛𝐵 ) 𝑒−2𝜎Φ ⋅ 2
(12)
4
Wireless Communications and Mobile Computing 2 2 𝜎𝑌2𝑚𝑛 = 𝑓𝑒 (𝜃, 𝜙) 𝐼𝑚𝑛
Table 1: Parameters of HFSS-based and coupled model-based results.
2
1 − cos (2ΔΦ𝑚𝑛 + 2ΔΦ𝑠𝑚𝑛 + 2𝜑𝑚𝑛𝐵 ) 𝑒−2𝜎Φ𝑟 ⋅( 2
(13)
1 − cos (2ΔΦ𝑚𝑛 + 2ΔΦ𝑠𝑚𝑛 + 2𝜑𝑚𝑛𝐵 ) −𝜎Φ2 − 𝑒 𝑟). 2 The variance 𝜎𝐸2 𝑠𝑟 then is deduced by substituting (10) and (13) into (8) as follows. 𝑀−1 𝑁−1
𝑀−1 𝑁−1
𝑚=0 𝑛=0
𝑚=0 𝑛=0
2 𝜎𝐸2 𝑠𝑟 = ∑ ∑ 𝜎𝑋 + ∑ ∑ 𝜎𝑌2𝑚𝑛 𝑚𝑛 𝑀−1 𝑁−1
(14)
2 2 2 = 𝑓𝑒 (𝜃, 𝜙) (1 − 𝑒−𝜎Φ𝑟 ) ∑ ∑ 𝐼𝑚𝑛 .
𝑚=0 𝑛=0
Finally, the mean of power pattern function with randomness in element position, which is also called the coupled structure-electromagnetic statistic model, is developed as follows. 2 2 2 2 𝑃𝑠𝑟 (𝜃, 𝜙) = 𝐸𝑠 (𝜃, 𝜙) 𝑒−𝜎Φ𝑟 + 𝑓𝑒 (𝜃, 𝜙) (1 − 𝑒−𝜎Φ𝑟 )
𝑀−1 𝑁−1
2 2 ⋅ ∑ ∑ 𝐼𝑚𝑛 = 𝐸𝑠 (𝜃, 𝜙) 𝑚=0 𝑛=0
−𝑘2 [𝜎𝑥2 (sin 𝜃 cos 𝜙)2 +𝜎𝑦2 (sin 𝜃 sin 𝜙)2 +𝜎𝑧2 (cos 𝜃)2 ]
⋅𝑒
(15)
2 + 𝑓𝑒 (𝜃, 𝜙) 2
2
2
2
2
2
2
⋅ {1 − 𝑒−𝑘 [𝜎𝑥 (sin 𝜃 cos 𝜙) +𝜎𝑦 (sin 𝜃 sin 𝜙) +𝜎𝑧 (cos 𝜃) ] } 𝑀−1 𝑁−1
2 ⋅ ∑ ∑ 𝐼𝑚𝑛 . 𝑚=0 𝑛=0
3. Verification of Coupled Structure-Electromagnetic Statistic Model In order to illustrate the effectiveness of the developed model, the coupled structure-electromagnetic statistic model is verified by simulations with HFSS software, which can provide stable and accurate solutions at even high frequencies and has been widely used by engineers to design reliable products [24]. In consideration of the array antennas in wireless applications, an 8 × 8 patch array antenna is illustrated [25], with the intervals along 𝑥 and 𝑦 directions being both 0.75𝜆, as shown in Figure 3. The frequency of the patch array antenna is 30 GHz. The physical size of the patch array antenna is 60 mm × 60 mm. For each patch antenna, the length and width are 𝐿 = 3.953 mm and 𝑊 = 3.160 mm, respectively. The initial excitation current is equal in amplitude and phase. Saddle-shaped distortion with the maximum displacement in 𝑧 direction of 𝜆/6 is assumed as the systematic distortion, and the random position errors in 𝑥, 𝑦, and 𝑧 directions are all
Performance Gain/dB First SLL/dB in 𝜙 = 0∘ plane in 𝜙 = 90∘ plane Second SLL/dB in 𝜙 = 0∘ plane in 𝜙 = 90∘ plane Third SLL/dB in 𝜙 = 0∘ plane in 𝜙 = 90∘ plane Fourth SLL/dB in 𝜙 = 0∘ plane in 𝜙 = 90∘ plane Fifth SLL/dB in 𝜙 = 0∘ plane in 𝜙 = 90∘ plane Beam width/∘ in 𝜙 = 0∘ plane in 𝜙 = 90∘ plane Boresight pointing/∘ in 𝜙 = 0∘ plane in 𝜙 = 90∘ plane
HFSS-based result
Coupled model-based result
60.12
60.12
50.17 49.87
50.17 49.96
44.15 43.88
44.52 44.07
41.34 40.28
41.61 40.61
39.23 37.46
39.66 37.85
37.44 33.71
37.84 34.19
8.80 8.79
8.80 8.79
0.15 0.13
0.15 0.13
Note. Every SLL is the right SLL.
assumed to satisfy the normal distribution with mean of 0 and variance of 𝜆/30. Firstly, random samples of structure errors are generated by adding the specific saddle-shaped distortion with each random position error sample produced according to the normal distribution. Then the antenna performance with every structure error sample is simulated separately with HFSS software without consideration of element coupling. Lastly the mean of the antenna performance is calculated by averaging the sum of the performances obtained from all the structure error samples. Here simulations with 1000 structure error samples are taken because the mean of antenna performance with greater than 1000 samples results in no further change. The comparison with the performance calculated by the developed model is shown in Figure 4 and the corresponding parameters are listed in Table 1. As shown in Figure 4 and Table 1, the coupled modelbased and HFSS-based results show good consistency in both the main lobe area and sidelobe area. The gain, beam width, and boresight pointing are the same in both 𝜙 = 0∘ and 𝜙 = 90∘ planes, which indicate that the main lobe areas are the same obtained by the coupled model and HFSS, respectively. The differences of the first sidelobes in absolute values are 0 dB and 0.09 dB in 𝜙 = 0∘ and 𝜙 = 90∘ planes, respectively. For the second, third, fourth, and fifth sidelobes, the maximum differences in absolute values are 0.43 dB and
Wireless Communications and Mobile Computing
5
1
1 Z
2
3
2
60 m m 4
3
5
6
m m 4 60 5
7
8
6 o
7
Patch antenna Substrate GND
8
Y L W
0.75
X
5 0.7
60
60
55
55
Power pattern function (dB)
Power pattern function (dB)
Figure 3: Patch array antenna model.
50 45 40 35 30
50 45 40 35 30
25
25
20
20 −80
−60
−40
−20
0
20
40
60
80
−80
−60
−40
0
−20
20
(∘ )
(∘ )
HFSS-based result Coupled model-based result
HFSS-based result Coupled model-based result
(a) 𝜙 = 0∘ plane
40
60
80
(b) 𝜙 = 90∘ plane
Figure 4: HFSS-based and coupled model-based results comparison.
0.48 dB in 𝜙 = 0∘ and 𝜙 = 90∘ planes, respectively. Therefore, the results above prove that the proposed coupled model is effective for analyzing the effect of randomness in element position on electromagnetic performance for array antennas.
phase centre of array element (𝑚, 𝑛) in saddle shape is given as follows.
4. Simulation and Discussion
where 𝑥max and 𝑦max are the half-length and width of the array aperture size, respectively, and Δ𝑧max is the maximum displacement of the array elements in 𝑧 direction that belongs to the systematic error. Therefore, the planar array antenna with both the saddleshaped distortion and element random position error is discussed as follows. A 12 × 12 planar rectangular array is illustrated, with the intervals of array elements in 𝑥 and 𝑦 directions being both 𝜆/2. The frequency is 9.375 GHz
For active phased array antenna, both the random position error and systematic distortion consist of the structure deformation for antenna in practice. Random position error appears as the random variable. In engineering, the antenna array region is generally distorted into a representative saddle shape. Based on the mathematical features of the surface, the 𝑧-coordinate of the
Δ𝑧mn = Δ𝑧max (
2 2 𝑥𝑚𝑛 𝑦𝑚𝑛 − ), 2 2 𝑥max 𝑦max
(16)
6
Wireless Communications and Mobile Computing Table 2: Parameters variations with systematic distortion and different random errors.
Performance
Random sample 1
Random sample 2
Random sample 3
Random sample 4 Statistic random error
Gain loss/dB
−2.00
−2.53
−1.89
−2.22
−2.23
+0.40
+0.41
+0.56
+0.72
+0.53
+1.65
+2.09
+0.64
+2.10
+1.53
−1.32
−0.14
−0.52
−0.39
−0.01
−0.16
−1.47
+0.93
−1.40
−0.01
−4.91
+1.26
+0.63
+0.79
−0.31
+0.28
+0.66
−1.40
+0.29
−0.31
−0.34
−5.45
+1.74
+0.59
−0.25
+1.26
−0.52
−0.92
−1.25
−0.25
−0.54
+0.56
−0.87
−2.36
−0.09
−2.89
+1.21
−2.81
−0.28
−0.09
+0.30
+0.34
+0.23
+0.28
+0.29
+0.40
+0.34
+0.28
+0.34
+0.35
+0.34
−0.31
+0.12
−0.14
+0.28
+0.33
+0.30
−0.31
+0.16
+0.19
First SLL change/dB in 𝜙 = 0∘ plane ∘
in 𝜙 = 90 plane Second SLL change/dB in 𝜙 = 0∘ plane ∘
in 𝜙 = 90 plane Third SLL change/dB in 𝜙 = 0∘ plane ∘
in 𝜙 = 90 plane Fourth SLL change/dB in 𝜙 = 0∘ plane ∘
in 𝜙 = 90 plane Fifth SLL change/dB in 𝜙 = 0∘ plane ∘
in 𝜙 = 90 plane ∘
Beam width change/ in 𝜙 = 0∘ plane ∘
in 𝜙 = 90 plane ∘
Boresight pointing/ in 𝜙 = 0∘ plane ∘
in 𝜙 = 90 plane
Note. Every SLL is the right SLL, + indicates upgrade and right side of 𝜃 = 0∘ , and − indicates decrease and left side of 𝜃 = 0∘ .
and the initial excitation current is equal in amplitude and phase. After analysis suppose the random errors along 𝑥, 𝑦, and 𝑧 directions are subjected to the normal distribution, with mean of zero and the same variance of 𝜆/20, and the maximum displacement of the saddle shape in 𝑧 direction is selected as 𝜆/5. The presented statistic model is applied to evaluate the statistic performance of distorted array antenna. In addition, the comparison with the existing linearly combination of systematic distortion and different random distributions of random errors is also discussed, where the used ∗ (𝜃, 𝜙) and power pattern function is 𝑃𝑠𝑟 (𝜃, 𝜙) = 𝐸𝑠𝑟 (𝜃, 𝜙) ⋅ 𝐸𝑠𝑟 𝐸𝑠𝑟 (𝜃, 𝜙) is the field density in (3). The systematic distortion is taken as the same saddle shape. Meanwhile, four random samples from sample 1 to sample 4 are generated according to the same normal distribution, taken as the random errors along 𝑥, 𝑦, and 𝑧 directions. The comparison results are shown in Figure 5 and the corresponding parameters are listed in Table 2. As shown in Figure 5 and Table 2, it follows that (1) the gain decreases greatly when saddle shape and random error coexist, with the maximum gain loss being −2.53 dB. The gain loss obtained from the statistic random error, which is directly substituting the variances of the random errors and systematic distortion into the presented
statistic model, shows a little difference from the values calculated by the four random samples, which are obtained by, respectively, adding each random sample with the systematic distortion as the whole structure error. The maximum difference is 0.34 dB, which indicates that the change of gain depends mainly on the systematic distortion. (2) the sidelobe levels change differently with the four random samples in both 𝜙 = 0∘ and 𝜙 = 90∘ planes. From the first to the fifth sidelobe level, the maximum change is −5.45 dB, which indicates that the sidelobe level is closely related to the distribution of random error. Large performance errors will be produced when evaluating from any random distribution. Thus the effect of statistics of random error must be considered. The sidelobe levels from the statistic model could be regarded as the evaluation values for they are given from the mean of power pattern function. (3) the beam width changes in small scales with different random samples, and the values are almost the same with the statistic random error. The maximum variations in 𝜙 = 0∘ and 𝜙 = 90∘ planes are 0.06∘ and 0.07∘ , respectively. It shows that the beam width is influenced mainly by the systematic distortion. (4) for the saddle shape is symmetry without influence on the pointing direction, the boresight pointing changes mainly
7
45
45
40
40
35
35
Power pattern function (dB)
Power pattern function (dB)
Wireless Communications and Mobile Computing
30 25 20 15 10
25 20 15 10 5
5 0
30
−80
−60
−40
−20
0
20
40
60
80
0
−80
−60
−40
Ideal antenna Random sample 1 Random sample 2
0
−20
(∘ )
20
40
60
80
(∘ ) Random sample 3 Random sample 4 Statistic random error
Ideal antenna Random sample 1 Random sample 2
(a) 𝜙 = 0∘ plane
Random sample 3 Random sample 4 Statistic random error
(b) 𝜙 = 90∘ plane
Figure 5: Performance with systematic distortion and random error.
from the different random error distribution. So it is more precise to extract from the statistic performance than from the performance calculated by adding a random sample with systematic distortion. In addition, the performance obtained from the presented statistic model is further verified especially on the sidelobe level and boresight pointing. Firstly the above four random samples are increased to one thousand samples with the same normal distribution. Next the mean of power pattern function is calculated by averaging the sum of performances obtained from all the samples. After one thousand times of calculations for all the samples, the average gain loss is −2.23 dB, which is the same value from the statistic model. The first sidelobe levels increase by 0.52 dB and 1.54 dB in 𝜙 = 0∘ and 𝜙 = 90∘ planes, respectively. The absolute errors are only 0.01 dB in both the two planes. The beam width changes by 0.29∘ and 0.34∘ , respectively, and the boresight pointing varies by 0.28∘ and 0.19∘ , respectively, which are almost the same values as obtained from the presented static model. Therefore, the presented coupled structure-electromagnetic statistic model can evaluate the antenna performance quickly and effectively with the effect of randomness in element position.
5. Conclusion Aimed at the restrictions of creating effective performance under the effect of randomness in the position of the array element, a coupled structural-electromagnetic statistic model for active phased array antenna is presented. The effect of randomness in element position on antenna performance is analyzed, compared with the electrical parameters obtained from the random sample errors combined with systematic distortion. The results show that random errors lead to the randomness of electromechanical performance of antenna,
especially on the sidelobe levels compared to the gain and the beam width. The electrical parameters obtained from the statistic model are more accurate than from any random sample errors. The performance got from the statistic model is almost the same with the average of the sum of performances from a large amount of random samples. Thus the presented method can evaluate the antenna performance quickly and effectively. It provides an advantageous guidance for structural design and performance optimization for array antennas in wireless application. In addition, it can effectively reduce the repeated design time of antennas to achieve the objective of lower development cost and time.
Conflicts of Interest The authors declare that there are no conflicts of interest regarding the publication of this paper.
Acknowledgments This work was supported by the National Natural Science Foundation of China under Grant nos. 51522507 and 51475349, the National 973 Program under Grant no. 2015CB857100, Youth Science and Technology Star Project of Shaanxi Province under Grant no. 2016KJXX-06, and the Fundamental Research Funds for the Central Universities under Grant nos. JBG150409, KJXX1603, and 7214479606.
References [1] K. Yelamarthi, M. S. Aman, and A. Abdelgawad, “An application-driven modular IoT architecture,” Wireless Communications and Mobile Computing, vol. 2017, Article ID 1350929, 16 pages, 2017. [2] G. Vlasyuk, O. Starkova, K. Herasymenko, Y. Kravchenko, and A. Polianytsia, “Implementation of the Internet of things
8
Wireless Communications and Mobile Computing concept for remote power management,” in Proceedings of the 2nd International Conference on Advanced Information and Communication Technologies, AICT 2017, pp. 26–30, Ukraine, July 2017.
[3] A. Abdelgawad and K. Yelamarthi, “Internet of things (IoT) platform for structure health monitoring,” Wireless Communications and Mobile Computing, vol. 2017, Article ID 6560797, 2017. [4] R. L. Sturdivant and E. K. P. Chong, “Systems Engineering of a Terabit Elliptic Orbit Satellite and Phased Array Ground Station for IoT Connectivity and Consumer Internet Access,” IEEE Access, vol. 4, pp. 9941–9957, 2016. [5] J. Laskar, S. Pinel, S. Sarkar et al., “On the development of CMOS mm W and sub-THz phased array technology for communication/sensing nodes,” in Proceedings of the 2010 IEEE MTT-S International Microwave Symposium, MTT 2010, pp. 1312–1315, USA, May 2010. [6] Z.-Y. Zhang, S. Li, S.-L. Zuo, J.-Y. Zhao, X.-D. Yang, and G. Fu, “Dual-polarized crossed bowtie dipole array for wireless communication applications,” International Journal of Antennas and Propagation, vol. 2014, Article ID 349516, 8 pages, 2014. [7] G. Li, B. Ai, D. He, Z. Zhong, B. Hui, and J. Kim, “On the feasibility of high speed railway mmWave channels in tunnel scenario,” Wireless Communications and Mobile Computing, vol. 2017, 17 pages, 2017. [8] T. Takahashi, N. Nakamoto, M. Ohtsuka et al., “On-board calibration methods for mechanical distortions of satellite phased array antennas,” IEEE Transactions on Antennas and Propagation, vol. 60, no. 3, pp. 1362–1372, 2012. [9] H. Kamoda, J. Tsumochi, T. Kuki, and F. Suginoshita, “A study on antenna gain degradation due to digital phase shifter in phased array antennas,” Microwave and Optical Technology Letters, vol. 53, no. 8, pp. 1743–1746, 2011. [10] C. Wang, Y. Wang, W. Wang, J. Zhou, M. Wang, and Z. Wang, “Electromechanical coupling based influence of structural error on radiation and scattering performance of array antennas,” IEEE Electronics Letters, vol. 53, no. 14, pp. 904–906, 2017. [11] A. Canclini, F. Antonacci, A. Sarti, and S. Tubaro, “Distributed 3D Source Localization from 2D DOA Measurements Using Multiple Linear Arrays,” Wireless Communications and Mobile Computing, vol. 2017, 11 pages, 2017. [12] C. Wang, M. Kang, W. Wang et al., “Electromechanical coupling based performance evaluation of distorted phased array antennas with random position errors,” International Journal of Applied Electromagnetics and Mechanics, vol. 51, no. 3, pp. 285– 295, 2016. [13] A. Ossowska, J. H. Kim, and W. Wiesbeck, “Influence of mechanical antenna distortions on the performance of the HRWS SAR system,” in Proceedings of the 2007 IEEE International Geoscience and Remote Sensing Symposium, IGARSS 2007, pp. 2152–2155, Spain, June 2007. [14] E. Zaitsev and J. Hoffman, “Phased array flatness effects on antenna system performance,” in Proceedings of the 4th IEEE International Symposium on Phased Array Systems and Technology, Array 2010, pp. 121–125, Waltham, Mass, USA, 2010. [15] C. Wang, M. Kang, Y. Wang, W. Wang, and J. Du, “Coupled structural-electromagnetic modeling and analysis of hexagonal ¨ - Interactive phased array antennas with random errors,” AEU national Journal of Electronics and Communications, vol. 70, no. 5, pp. 592–598, 2016.
[16] M. Lange, “Impact of statistical errors on active phased-array antenna performance,” in Proceedings of the Military Communications Conference, MILCOM 2007, USA, October 2007. [17] S. W. Schediwy, D. Price, F. Dulwich, and B. Mort, “A quantitative analysis of how phase errors affect the beam quality of phased arrays,” in Proceedings of the 4th IEEE International Symposium on Phased Array Systems and Technology, Array 2010, pp. 256–260, USA, October 2010. [18] M. Lanne, “Design aspects and pattern prediction for phased arrays with subarray position errors,” in Proceedings of the 4th IEEE International Symposium on Phased Array Systems and Technology, Array 2010, pp. 440–446, Waltham, MA, USA, October 2010. [19] C. Wang, M. Kang, W. Wang, B. Duan, L. Lin, and L. Ping, “On the performance of array antennas with mechanical distortion errors considering element numbers,” International Journal of Electronics, vol. 104, no. 3, pp. 462–484, 2017. [20] M. K. Kang, Y. Wang, L. Yin et al., “Performance prediction for array antennas with element position error based on coupled structural-electromagnetic model,” in in Proceedings of the fifth Asia International Symposium on Mechatronics, pp. 34–38, Guilin, China, 2015. [21] C. S. Wang, B. Y. Duan, F. S. Zhang et al., “Coupled structural-electromagnetic-thermal modelling and analysis of active phased array antennas,” IET Microwaves, Antennas & Propagation, vol. 4, no. 2, pp. 247–257, 2010. [22] J. Ruze, “The effect of aperture errors on the antenna radiation pattern,” Il Nuovo Cimento, vol. 9, no. 3, pp. 364–380, 1952. [23] D. J. Goodman and A. J. Viterbi, Wireless Personal Communications, Wesley, Addison Longman Incorporated, 1997. [24] Z. Cendes, “The development of HFSS,” in Proceedings of the 2016 USNC-URSI Radio Science Meeting (Joint with AP-S Symposium), USNC-URSI 2016, pp. 39-40, Puerto Rico, July 2016. [25] W. Roh, J.-Y. Seol, J. Park et al., “Millimeter-wave beamforming as an enabling technology for 5G cellular communications: theoretical feasibility and prototype results,” IEEE Communications Magazine, vol. 52, no. 2, pp. 106–113, 2014.
International Journal of
Rotating Machinery
Engineering Journal of
Hindawi Publishing Corporation http://www.hindawi.com
Volume 2014
The Scientific World Journal Hindawi Publishing Corporation http://www.hindawi.com
Volume 2014
International Journal of
Distributed Sensor Networks
Journal of
Sensors Hindawi Publishing Corporation http://www.hindawi.com
Volume 2014
Hindawi Publishing Corporation http://www.hindawi.com
Volume 2014
Hindawi Publishing Corporation http://www.hindawi.com
Volume 2014
Journal of
Control Science and Engineering
Advances in
Civil Engineering Hindawi Publishing Corporation http://www.hindawi.com
Hindawi Publishing Corporation http://www.hindawi.com
Volume 2014
Volume 2014
Submit your manuscripts at https://www.hindawi.com Journal of
Journal of
Electrical and Computer Engineering
Robotics Hindawi Publishing Corporation http://www.hindawi.com
Hindawi Publishing Corporation http://www.hindawi.com
Volume 2014
Volume 2014
VLSI Design Advances in OptoElectronics
International Journal of
Navigation and Observation Hindawi Publishing Corporation http://www.hindawi.com
Volume 2014
Hindawi Publishing Corporation http://www.hindawi.com
Hindawi Publishing Corporation http://www.hindawi.com
Chemical Engineering Hindawi Publishing Corporation http://www.hindawi.com
Volume 2014
Volume 2014
Active and Passive Electronic Components
Antennas and Propagation Hindawi Publishing Corporation http://www.hindawi.com
Aerospace Engineering
Hindawi Publishing Corporation http://www.hindawi.com
Volume 2014
Hindawi Publishing Corporation http://www.hindawi.com
Volume 2014
Volume 2014
International Journal of
International Journal of
International Journal of
Modelling & Simulation in Engineering
Volume 2014
Hindawi Publishing Corporation http://www.hindawi.com
Volume 2014
Shock and Vibration Hindawi Publishing Corporation http://www.hindawi.com
Volume 2014
Advances in
Acoustics and Vibration Hindawi Publishing Corporation http://www.hindawi.com
Volume 2014