Debieu et al. Nanoscale Research Letters 2011, 6:161 http://www.nanoscalereslett.com/content/6/1/161
NANO EXPRESS
Open Access
Effect of the Nd content on the structural and photoluminescence properties of silicon-rich silicon dioxide thin films Olivier Debieu, Julien Cardin, Xavier Portier, Fabrice Gourbilleau*
Abstract In this article, the microstructure and photoluminescence (PL) properties of Nd-doped silicon-rich silicon oxide (SRSO) are reported as a function of the annealing temperature and the Nd concentration. The thin films, which were grown on Si substrates by reactive magnetron co-sputtering, contain the same Si excess as determined by Rutherford backscattering spectrometry. Fourier transform infrared (FTIR) spectra show that a phase separation occurs during the annealing because of the condensation of the Si excess resulting in the formation of silicon nanoparticles (Si-np) as detected by high-resolution transmission electron microscopy and X-ray diffraction (XRD) measurements. Under non-resonant excitation at 488 nm, our Nd-doped SRSO films simultaneously exhibited PL from Si-np and Nd3+ demonstrating the efficient energy transfer between Si-np and Nd3+ and the sensitizing effect of Si-np. Upon increasing the Nd concentration from 0.08 to 4.9 at.%, our samples revealed a progressive quenching of the Nd3+ PL which can be correlated with the concomitant increase of disorder within the host matrix as shown by FTIR experiments. Moreover, the presence of Nd-oxide nanocrystals in the highest Nd-doped sample was established by XRD. It is, therefore, suggested that the Nd clustering, as well as disorder, are responsible for the concentration quenching of the PL of Nd3+. Introduction Over the last decade, there has been an increasing interest toward nanomaterials for novel applications. One of the challenging fields concerns silicon-compatible light sources which are getting more and more attractive since they can be integrated to microelectronics devices [1]. Amorphous SiO 2 is an inefficient host matrix for the photoluminescence (PL) of Nd3+ ions since, on the one hand, the absorption cross section of Nd is low (1 × 10-20 cm2) and, on the other hand, the Nd solubility in silica is limited by clustering [2 ,3], which quenches the PL of the rare earth (RE) ions [4,5]. However, since the discovery of the sensitizing effect of silicon nanoparticles (Si-np) toward the RE ions [6], RE-doped a-SiO2 films containing Si-np are promising candidates for the achievement of future photonic devices. In such nanocomposites, Nd3+ ions benefit from the high absorption cross section of Si-np (1-100 × 10-17 cm2) by an efficient * Correspondence:
[email protected] CIMAP, UMR CNRS/CEA/ENSICAEN/UCBN, Ensicaen 6 Bd Maréchal Juin, 14050 Caen Cedex 4, France
energy transfer mechanism, which enables the PL efficiency of RE ions to be enhanced by 3-4 orders of magnitude offering interesting opportunities for the achievement of future practical devices optically excited. In contrast to Er3+ ions [6-8], such materials doped with Nd have not been widely investigated and, accordingly, the energy transfer mechanism between Si-np and Nd3+ ions, and its limitation [9-16]. Several authors have demonstrated that the energy transfer is more effective with small Si-np [10,11]. Seo et al. [11] have observed a decrease of the PL intensity of Nd3+ ions upon increasing the Si excess, i.e., increasing the Si-np average size. They concluded that only small Si-np which present excitonic states with a sufficient energy band-gap can excite the 4F3/2 level of Nd3+ ions. Several groups, which studied the effect of the Nd concentration in the PL properties of Nd-doped Si-np/SiO 2 demonstrated that the PL of Nd 3+ ions is more efficient at low Nd concentration [12,13]. The object of the present investigation is therefore to characterize the PL properties of nanostructured thin films containing a low concentration of Si excess as a
© 2011 Debieu et al; licensee Springer. This is an Open Access article distributed under the terms of the Creative Commons Attribution License (http://creativecommons.org/licenses/by/2.0), which permits unrestricted use, distribution, and reproduction in any medium, provided the original work is properly cited.
Debieu et al. Nanoscale Research Letters 2011, 6:161 http://www.nanoscalereslett.com/content/6/1/161
function of the Nd concentration and the annealing temperature in relation with their microstructures. The Nd-doped silicon-rich silicon oxide (SRSO) thin layers were synthesized by reactive magnetron co-sputtering. Their microstructures were examined using highresolution transmission electron microscopy (HRTEM), X-ray diffraction (XRD), and Fourier transform infrared (FTIR) spectroscopy. We could notably establish the proper conditions to obtain efficient PL of Nd 3+ but also describe its limitations.
Experiment In this study, Nd-doped SRSO thin layers were deposited at room temperature on p-type Si wafers by a reactive magnetron RF co-sputtering method that consists in sputtering simultaneously a pure SiO 2 target topped with Nd2O3 chips. The Nd content was monitored by the surface ratio between the Nd2O3 chips and the SiO2 target. The sputtering gas was a mixture of argon and hydrogen; the latter enables us to control the Si excess of the deposited layers by reacting with oxide species in the plasma [17]. The samples were subsequently annealed at high temperature ranging from 900 to 1100 °C in a dry nitrogen flow. The composition of the deposited layers was determined by Rutherford backscattering spectrometry, while microstructural analyses were performed using of XRD and HRTEM on samples prepared in the cross-sectional
Page 2 of 8
configuration using a JEOL 2010F (200 kV). The infrared absorption properties were investigated unsing a Nicolet Nexus FTIR spectrometer at Brewster’s incidence. Room temperature PL measurements were performed using an argon ion laser operating at 488 nm (7.6 W/ cm2) as excitation source. This excitation wavelength is non-resonant with Nd 3+ ions so that only an indirect excitation of Nd can occur [13,15]. The visible spectra were recorded using a fast photomultiplier (Hamamatsu) after dispersion of the PL with a Jobin-Yvon TRIAX 180 monochromator, while the infrared PL was measured using a Jobin-Yvon THR 1000 monochromator mounted with a cooled Ge detector and a lock-in amplifier to record the near-infrared spectra up to 1.5 μm.
Results In this study, we were interested in four Nd-doped SRSO thin films containing the same excess of Si (7 at.%) with various Nd contents ranging from 0.08 to 4.9 at.%. Microstructure
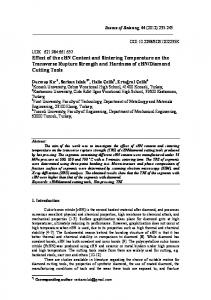
Figure 1 shows the FTIR spectrum of the lowest Nddoped sample as-deposited and a fit with eight Gaussian peaks. Several bands characteristic of amorphous SiO2 are observed. The two prominent bands at 1236 (red), and 1052 cm-1 (blue) are assigned to longitudinal optical
Figure 1 FTIR spectrum of the lowest Nd-doped sample as-deposited.
Debieu et al. Nanoscale Research Letters 2011, 6:161 http://www.nanoscalereslett.com/content/6/1/161
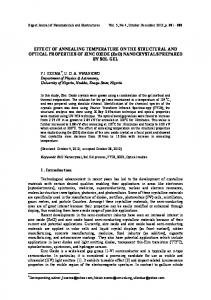
(LO 3 ) and transverse optical (TO 3 ) phonons of Si-O bonds, respectively. One can notice that these two bands are slightly shifted to lower wavenumbers compared to the stoichiometric positions of a-SiO2 at 1256 and 1076 cm-1, respectively. The TO2 , LO2 , LO4 , and TO4 vibration modes are also present at 810, 820, 1160, and 1200 cm-1, respectively. In addition to Si-O vibration modes, a weak absorption band centered at 880 cm-1 is observed. This peak, which is assigned to Si-H bonds, disappears after annealing because of the hydrogen desorption. Figure 2a shows the evolution of the positions of the LO3 and TO3 vibration modes, and the LO3/TO3 intensity ratio, as a function of the annealing temperature. One can observe that, while the annealing temperature was increased, the TO3 and LO3 peaks’ positions progressively shifted to higher wavenumbers toward their respective stoichiometric positions. It is explained by the phase separation that results in the formation of Si-np [18,19]. The increase of the LO3 band intensity (see Figure 2b) is related to the increase of the number of Si-OSi bonds at the SiO x /Si-np interface [19,20], i.e., the increase of the density of Si-np [21]. Figure 3 presents the evolution of the FTIR spectra of samples annealed at 1100 °C as a function of the Nd concentration. One can observe that the LO 3 band
Page 3 of 8
intensity, which is constant at low Nd concentrations of 0.08 and 0.27 at.%, significantly decreased while the Nd content was increased from 1.68 to 4.9 at.%. This evolution contrasts with the one of the TO4-LO4 pair modes. Indeed, the TO4-LO4 intensity remains constant at low Nd concentrations of 0.08 and 0.27 at.%, and then, it progressively increases with increasing Nd content. This demonstrates that the incorporation of Nd in the thin films generates disorder in the host SiO2 matrix. Moreover, one can notice, in the spectrum of the highest Nd-doped sample, the emergence of two weak absorption peaks centered at 910 and 950 cm -1 which are assigned to asymmetric mode of Si-O-Nd bonds [22]. These peaks are located above a shoulder which can originate from Si-O- and Si-OH phonons [23,24]. However, one can exclude the existence of the Si-OH vibration mode after annealing because of the hydrogen desorption. The emergence of these two absorption peaks suggests that other phonons are also optically active in this spectral range. In Figure 4 is depicted the XRD spectra of the lowest and highest Nd-doped samples. In the former sample, one broad band corresponding to a-SiO2 is observed, while the pattern of the latter sample indicates the presence of additional phases. In the 27-32° range, it shows various sharp peaks that are located above a broad band
Figure 2 Evolutions of the positions of the LO3 and TO3 peaks, and the LO3/TO3 intensity ratio, as a function of the annealing temperature.
Debieu et al. Nanoscale Research Letters 2011, 6:161 http://www.nanoscalereslett.com/content/6/1/161
Page 4 of 8
Figure 3 Evolution of the FTIR spectra as a function of the Nd concentration.
centered at 29°. This peak, and the 48° one, indicate the presence of nanocrystalline Si [21,25], while the sharp and intense peaks located at 27.6°, 28.8°, and 30.7° are assigned to Nd 2 O 3 crystals. However, the 28.8° peak may result from both crystalline Si and Nd 2 O 3 . It is interesting to note that the 27.6° and 30.7° peaks fairly
concur with the ones observed in neodymia-silica composites containing Nd2O3 nanocrystals by several groups [2,3]. As a consequence, the presence of Nd2O3 and Si nanocrystals in the highest Nd-doped sample is established, while no crystalline phases are detected in the low Nd-doped one.
Figure 4 XRD patterns of the highest and lowest Nd-doped samples annealed at 1100 °C.
Debieu et al. Nanoscale Research Letters 2011, 6:161 http://www.nanoscalereslett.com/content/6/1/161
Figure 5 shows the HRTEM images of the two latter samples investigated by XRD after annealing at 1100 °C. In the image of the sample with the highest Nd concentration of 4.9 at.% (Figure 5a), one can recognize small Si nanocrystals because of the lattice fringes corresponding to the Si crystalline feature, while no crystalline structure was observed in the images of the film containing the lowest Nd concentration of 0.08 at.% (Figure 5b). These two images are in accordance with the XRD results (see Figure 4). However, one cannot exclude that
Page 5 of 8
the lowest Nd-doped sample could small contain amorphous Si-np. PL spectroscopy
Figure 6 shows the PL spectrum of the lowest Nd-doped sample after annealing at 1100 °C. In the visible domain, one can observe a broad PL band that is originating from quantum-confined excitonic states in small Si-np, while in the infrared domain, three peaks centered at around 920, 1100, and 1350 nm are distinguishable and
Figure 5 HRTEM images of the highest (a) and lowest (b) Nd-doped samples annealed at 1100 °C.
Debieu et al. Nanoscale Research Letters 2011, 6:161 http://www.nanoscalereslett.com/content/6/1/161
are attributed to the infra-4f shell transitions of Nd3+ ions from the 4F 3/2 level to the 4 I9/2 , 4 I11/2 , and 4I 13/2 levels, respectively. The presence of the PL of Nd3+ ions after non-resonant excitation brings to light the sensitizing effect of Si-np towards Nd3+ ions. The evolution of the integrated PL intensity of the Sinp PL band and the 920-nm PL peak is shown in the inset of Figure 6. The enhancement of the PL intensity of the broad visible PL band with the annealing temperature is characteristic for Si-np embedded in SiO2. It is due to the increase of the Si-np density, as shown by the increase of the LO3 band intensity in the FTIR spectra (see Figure 2) [21], as well as the improvement of their passivation [26] and the decrease of disorder in the host matrix. The latter is a source of non-radiative recombination channels. Interestingly, one can observe that the evolution of the PL intensity of Nd3+ ions as a function of the annealing temperature is manifestly correlated with the one of Si-np. Reminding that the PL measurements were done under non-resonant excitation, this behavior underlines the strong coupling between Si-np and Nd 3+ ions, and, accordingly, the potential of sensitizing of Si-np. The increase of the PL intensity of Nd 3+ is then explained by the increase of the Si-np density as well as the increase of non-radiative de-excitation channels of both Si-np and Nd3+. The Nd3 + PL intensity is then maximal after annealing at 1100 °C which is generally admitted as the optimal annealing temperature for the PL of Si-np. Figure 7 shows the behavior of the PL spectra of the thin films annealed at 1100 °C as a function of the Nd concentration. As the Nd content increases from 0.08 to
Page 6 of 8
0.27 at.%, the PL intensity of Si-np drastically drops and disappears at 1.68 at.%. Then, PL of Si-np surprisingly reappears at the highest Nd concentration of 4.9 at.%. Interestingly, one can observe that the positions and widths of the PL peaks of the two lowest Nd-doped samples remain identical (see the inset); whereas the PL peak of the highest Nd-doped film is manifestly shifted to longer wavelengths. According to the quantum confinement model, the PL of the latter sample therefore emanates from Si-np that are sensibly larger than the ones present in the two former samples. In the infrared spectral domain, one can observe that the PL intensity of Nd 3+ ions drops progressively with increasing Nd concentration.
Discussion During the annealing, a phase separation occurs as demonstrated in the FTIR spectra in Figure 1, leading to the condensation of Si-np that were detected by XRD (see Figure 4) and HRTEM (see Figure 5). Besides, the presence of Si-np in the films was confirmed by the occurrence after annealing of a 740-nm broad PL band that is characteristic for Si-np. The presence of PL of Nd3+ ions under non-resonant excitation evidenced the efficient energy transfer between Si-np and Nd3+ ions (Figure 6). The concentration quenching of the PL of Nd 3+ ions that was observed in Figure 7 is partly explained by cross relaxation processes between Nd3+ ions and neighboring Nd3+ ions and/or Nd 2 O 3 nanocrystals as reported in glass matrices [4,5]. This is supported by the existence of Nd 2 O 3 nanocrystals in the highest Nd-doped sample
Figure 6 PL spectrum of the lowest Nd-doped sample annealed at 1100 °C. (Inset) Evolutions of the integrated PL intensity of the Si-np PL band and the first Nd3+ ions PL peak as a function of the annealing temperature.
Debieu et al. Nanoscale Research Letters 2011, 6:161 http://www.nanoscalereslett.com/content/6/1/161
Page 7 of 8
Figure 7 Evolution of the PL spectra as a function of the Nd concentration.
(see Figure 4). Besides, non-radiative channels inherent to disorder induced by the Nd incorporation (see Figure 3) can be in competition with the energy transfer mechanism between Si-np and Nd3+ ions in such nanocomposite systems leading to the common decrease of the PL intensity of Nd3+ and Si-np. As a consequence, the emission of Nd3+ ions is more efficient while Si-np are formed, and while the Nd content is low (0.08 at.%). In such conditions, Nd3+ ions benefit from the sensitizing effect of Si-np and from the weak competition of non-radiative recombinations in the host matrix. The decrease of the PL of Si-np with increasing Nd content ranging from 0.08 to 4.9 at.% (Figure 7) is explained by the raise of energy transfer between Si-np and Nd 3+ ions (which can be luminescent or not), and by the increase of non-radiative recombinations provided by the increase of disorder as shown in Figure 3. Besides, the presence of a Nd2O3 phase in the host matrix at the highest Nd content significantly modifies the number of oxygen atoms available to form the silicon oxide host matrix consequently leading to the formation of larger Si-np with a higher density. Besides, the formation of Nd 2 O 3 nanocrystals results in the rise of the average interaction distance between Si-np and Nd atoms (agglomerated or not) leading to the occurrence of notcoupled Si-np, which therefore enables emission of light in the visible range. This explains the presence of the PL peak of Si-np in the highest Nd-doped sample (Figure 7) which is significantly shifted to longer wavelengths. The fact that XRD pattern of Si nanocrystals, were detected in the latter sample and not in the lowest Nd-doped sample (Figure 4) may also be attributed to the modification of the Si-np size and density.
Conclusion The relationships between the composition, the microstructure, and the PL properties of Nd-doped SRSO thin films that contain the same Si excess were studied. We could establish that the maximum of the PL intensity of Nd 3+ ions was obtained after annealing at 1100 °C which corresponds to the better situation for the achievement of highly luminescent Si-np embedded in SiO 2 , i.e., containing a small quantity of non-radiative recombination channels. It was demonstrated that the PL of Nd 3+ ions was quenched at high Nd-concentration (4.9 at.%) because of the formation of Nd2O3 nanocrystals and the occurrence of disorder in the host matrix. The former participates in the concentration quenching mechanism because of cross relaxation processes, while the latter induces the occurrence of new non-radiative channels which are in competition with the energy transfer mechanism between Si-np and Nd3+ ions.
Abbreviations FTIR: Fourier transform infrared; LO: longitudinal optical; PL: photoluminescence; RE: rare earth; Si-np: silicon nanoparticles; SRSO: siliconrich silicon oxide; TO: transverse optical; XRD: X-ray diffraction. Acknowledgements The authors are grateful to the French Agence Nationale de la Recherche, which supported this study through the Nanoscience and Nanotechnology program (DAPHNES project ANR-08-NANO-005). Authors’ contributions OD fabricated the thin films and carried out the optical and microstructural characterizations. XP investigated the films by HRTEM. JC made significant contribution to the optical properties. FG conceived of the study and participated in the coordination and writing of the manuscript. All authors read and approved the final manuscript.
Debieu et al. Nanoscale Research Letters 2011, 6:161 http://www.nanoscalereslett.com/content/6/1/161
Competing interests The authors declare that they have no competing interests. Received: 24 September 2010 Accepted: 21 February 2011 Published: 21 February 2011 References 1. Kenyon AJ: Recent developments in rare-earth doped materials for optoelectronics. Prog Quant Electron 2002, 26:225. 2. Kępiński L, Zawadzki M, Miśta W: Hydrothermal synthesis of precursors of neodymium oxide nanoparticles. Solid State Sci 2004, 6:1327. 3. Lal B, Kumar S, Aghamkar P, Rohilla S, Singh D: Structural studies of annealed neodymia-silica composite synthesized by solgel technique. Physica B 2009, 404:3452. 4. Caird JA, Ramponi AJ, Staver PR: Quantum efficiency and excited-state relaxation dynamics in neodymium-doped phosphate laser glasses. JOSA B 1991, 8:1392. 5. Jacinto C, Oliveira SL, Nunes LAO, Myers MJ, Catunda T: Normalizedlifetime thermal-lens method for the determination of luminescence quantum efficiency and thermo-optical coefficients: Application to Nd3 +-doped glasses. Phys Rev B 2006, 73:125107. 6. Kenyon AJ, Trwoga PF, Federighi M, Pitt CW: Optical properties of PECVD erbium-doped silicon-rich silica: evidence for energy transfer between silicon microcIusters and erbium ions. J Phys Condens Matter 1994, 6:L319. 7. Franzo G, Iacona F, Vinciguerra V, Priolo F: Enhanced rare earth luminescence in silicon nanocrystals. Mater Sci Eng B 2000, 69-70:335. 8. Gourbilleau F, Levalois M, Dufour C, Vicens J, Rizk R: Optimized conditions for an enhanced coupling rate between Er ions and Si nanoclusters for an improved 1.54-μm emission. J Appl Phys 2004, 95:3717. 9. Franzó G, Vinciguerra G, Priolo F: The excitationmechanism of rare-earth ions in silicon nanocrystals. Appl Phys A Mater Sci Process 1999, 69:3. 10. Watanabe K, Tamaoka H, Fujii M, Moriwaki K, Hayashi S: Excitation of Nd3+ and Tm3+ by the energy transfer from Si nanocrystals. Physica E 2002, 13:1038. 11. Seo SY, Kim M-J, Shin J: The Nd-nanocluster coupling strength and its effect in excitation/de-excitation of Nd3+ luminescence in Nd-doped silicon-rich silicon oxide. Appl Phys Lett 2003, 83:2778. 12. MacDonald AN, Hryciw A, Lenz F, Meldrum A: Interaction between amorphous silicon nanoclusters and neodymium ions. Appl Phys Lett 2006, 89:173132. 13. Bréard D, Gourbilleau F, Dufour C, Rizk R, Doulan J-L, Camy P: Spectroscopic studies of Nd3+-doped silicon-rich silicon oxide films. Mater Sci Eng 2008, 146:179. 14. Bréard D, Gourbilleau F, Belarouci A, Dufour C, Rizk R: Nd3+ photoluminescence study of Nd-doped Si-rich silica films obtained by reactive magnetron sputtering. J Lumin 2006, 121:209. 15. Gourbilleau F, Belarouci A, Bréard D, Dufour C, Rizk R: Active emitters based on nanostructured Si. Int J Nanotechnol 2008, 5:574. 16. Podhorodecki A, Misiewicz J, Gourbilleau F, Cardin J, Dufour C: High Energy Excitation Transfer from Silicon Nanocrystals to Neodymium Ions in Silicon-Rich Oxide Film. Electrochem Solid State 2010, 13:K26-K28. 17. Ternon C, Gourbilleau F, Portier X, Voivenel P, Dufour C: An original approach for the fabrication of Si/SiO2 multilayers using reactive magnetron sputtering. Thin Solid Films 2002, 419:5. 18. Hinds BJ, Wang F, Wolfe DM, Hinkle CL, Lucovsky G: Study of SiOx decomposition kinetics and formation of Si nanocrystals in an SiO2 matrix. J Non-Cryst Solids 1998, 227-230:507. 19. Ono H, Ikarashi T, Ando K, Kitano T: Infrared studies of transition layers at SiO2/Si interface. J Appl Phys 1998, 84:6064. 20. Charvet S, Madelon R, Gourbilleau F, Rizk R: Spectroscopic ellipsometry analyses of sputtered Si/SiO2 nanostructures. J Appl Phys 1999, 85:4032. 21. Gourbilleau F, Dufour C, Levalois M, Vicens J, Rizk R, Sada C, Enrichi F, Battaglin G: Room-temperature 1.54 μm photoluminescence from Erdoped Si-rich silica layers obtained by reactive magnetron sputtering. J Appl Phys 2003, 94:3869. 22. Ono H, Katsumata T: Interfacial reactions between thin rare-earth-metal oxide films and Si substrates. Appl Phys Lett 2001, 78:1832. 23. Fidalgo A, Ilharco LM: The defect structure of sol-gel-derived silica/ polytetrahydrofuran hybrid films by FTIR. J Non-Cryst Solids 2001, 283:144. 24. Innoncenzi P: Infrared spectroscopy of sol-gel derived silica-based films: a spectra-microstructure overview. J Non-Cryst Solids 2003, 316:309.
Page 8 of 8
25. Kapaklis V: Structural characterization of silicon nanocrystals from amorphous silicon oxide materials. J Non-Cryst Solids 2008, 354:612. 26. Garrido B, López M, Pérez-Rodríguez A, García C, Pellegrino P, Ferré R, Moreno JA, Morante JR, Bonafos C, Carrada M, Claverie A, de la Torre J, Souifi A: Optical and electrical properties of Si-nanocrystals ion beam synthesized in SiO2. Nucl Instrum Meth. B 2004, 216:213. doi:10.1186/1556-276X-6-161 Cite this article as: Debieu et al.: Effect of the Nd content on the structural and photoluminescence properties of silicon-rich silicon dioxide thin films. Nanoscale Research Letters 2011 6:161.
Submit your manuscript to a journal and benefit from: 7 Convenient online submission 7 Rigorous peer review 7 Immediate publication on acceptance 7 Open access: articles freely available online 7 High visibility within the field 7 Retaining the copyright to your article
Submit your next manuscript at 7 springeropen.com