International Journal of Computational Intelligence and Informatics, Vol. 3: No. 3, October - December 2013
Effective Clustering Algorithm for Gas Sensor Array Drift Dataset E N Sathishkumar
K Thangavel
D Arul Pon Daniel
Department of Computer Science Periyar University, Salem, TamilNadu , India
[email protected]
Department of Computer Science Periyar University, Salem, TamilNadu, India
[email protected]
Department of Computer Science Periyar University, Salem, TamilNadu, India
[email protected]
Abstract-Much work has been done in the last fifteen years to develop adapted techniques and robust algorithms. The problem of data correction in presence of simultaneous sources of drift, other than sensor drift, should be also investigated since it is often the case in practical situations. To this, one idea could be combining semi-supervised methods able to learn the actual source of drift, which might clearly change with the measured samples, with adaptive drift correction strategies that can account for the continuous drift direction change in the feature space. Cluster validity checking is one of the most important issues in cluster analysis related to the inherent features of the dataset under concern. It aims at the evaluation of clustering results and the selection of the scheme that best fits the underlying data. This paper studies clustering methods K-Means, Fuzzy C-Means (FCM) and Rough K-Means algorithm have implemented for the Gas Sensor Array Drift Dataset without considering class labels. Then they obtained results are compared with the original class labels through the confusion matrix. It is found that the Rough K-Means is performing well comparatively to get the valid data from the drift dataset. Keywords-Clustering, FCM, Gas sensor array, K-Means, Rough K-means
I.
INTRODUCTION
The past decade has seen a significant increase in the application of multi-sensor arrays to gas classification and quantification. The idea to combine an array of sensors with a pattern recognition algorithm to improve the selectivity of the single gas sensor has been widely accepted and being used by researchers in this field. In fact, an array of different gas sensors is used to generate a unique signature for each gas [1]. A single sensor in the array should not be highly specific in its response but should respond to a broad range of compounds, so that different patterns are expected to be related to different odors [2]. So far, it has not been possible to fabricate chemical sensors without drift. Accordingly, sensor drift has to be treated in some way in order to achieve reliable measurement data from gas sensor arrays. One way of handling the drift of chemical sensors is by mathematical processing of the sensor signals. Different methods have been suggested recently to compensate for sensor drift in experiments for gas identification [3]. Chemical sensor arrays combined with read-out electronics and a properly trained pattern recognition stage are considered to be the candidate instrument to detect and recognize odors as gas mixtures and volatiles [4]. However, a strong limitation in sensor array technology, in addition to selectivity and sensitivity constraints, arise from sensor drift. This phenomenon degrades the stability of the device and makes obsolete the models built in order to recognize and quantify volatiles. The drift phenomena, in general, are defined as gradual changes in a quantitative characteristic that is assumed to be constant over time. The drift in chemical sensor array devices (also known as e-noses) is a rather complex and inevitable effect, which is generated by different sources. Sensor aging and sensor poisoning influence the device directly through a change in the sensing layer (reorganization of sensor material and contamination). Additionally, the drift of the sensor response is also implied by experimental operation, this includes thermal and memory effects of sensors, changes in environment and odor delivery system noise. Many efforts have been made in sensor technology and experimental design aiming to improve the stability of sensors with time. Other efforts have been focused on the data processing methods for drift counteraction that can assist these systems to enlarge their calibration lifetime. An important assumption for drift compensation methods in chemical sensor signal processing is that the drift observed in the data is considered to have a preferable direction, rather than a random distribution. This assumption reasonably conforms to the fact that the most disturbances in sensor array data are induced by the sensor side. Other sources of drift also contribute to principal directions of variance as sensors are also assumed to react similarly to the same changes in environment as temperature, humidity variations and others [5]. Clustering is an active research topic in pattern recognition, data mining, statistics, and machine learning with diverse emphasis. Clustering algorithms are probably the most commonly used methods in data mining. Data mining is the process of extracting unknown but useful information which from mass of data that is incomplete, ambiguous, noisy and random. Data mining technology is used to detect large-scale database and find an unknown model [6]. ISSN: 2231-0258
144
International Journal of Computational Intelligence and Informatics, Vol. 3: No. 3, October - December 2013
This paper has been organized into four sections. In Section 2, various methods andtechniques used so for are mentioned in brief. In Section 3, explains briefly about experimental analysis and results. Section 4 presents a conclusion for this paper.
II.
METHODS
A. Min-Max Normalization Min-max normalization performs a linear transformation on the original data. Suppose that minA and maxA are the minimum and maximum values of an attribute, A. Min-max normalization maps a value, v, of A to v0 in the range [new_ minA, new_ maxA] by computing. 𝑣′ =
𝑣−𝑚𝑖𝑛𝐴 𝑚𝑎𝑥𝐴 −𝑚𝑖𝑛𝐴
(𝑛𝑒𝑤𝑚𝑎𝑥𝐴 − 𝑛𝑒𝑤𝑚𝑖𝑛𝐴 ) + 𝑛𝑒𝑤𝑚𝑖𝑛𝐴
(1)
Min-max normalization preserves the relationships among the original data values. It will encounter an “outof-bounds” error if a future input case for normalization falls outside of the original data range for A. The Gas Sensor Array Drift Dataset is min-max normalization by setting minimum as 802.153878 and maximum as 670687.3477. B. K-Means The main objective in cluster analysis is to group objects that are similar in one cluster and separate objects that are dissimilar by assigning them to different clusters. One of the most popular clustering methods is K-Means clustering algorithm [9]. It is classifies objects to a pre-defined number of clusters, which is given by the user (assume K clusters). The idea is to choose random cluster centres, one for each cluster. These centres are preferred to be as far as possible from each other. In this algorithm mostly Euclidean distance is used to find distance between data points and centroids [10, 19]. The Euclidean distance between two multi-dimensional data points X = (x1, x2, x3, ..., xm) and Y = (y1, y2, y3, ..., ym) is described as follows, D(X, Y) =√(𝑥1 − 𝑦1 )2 + (𝑥2 − 𝑦2 )2 + ⋯ + (𝑥𝑀 − 𝑦𝑀 )2
(2)
Pseudocode for K-means clustering algorithm is described in Algorithm1. Algorithm 1: K-Means clustering algorithm [17] Require: D = {d1, d2, d3, ..., dn } // Set of n data points. K - Number of desired clusters Ensure: A set of Kclusters. Steps: 1. Arbitrarily choose K data points from D as initial centroids; 2. Repeat Assign each point di to the cluster which has the closest centroid; Calculate the new mean for each cluster; Until convergence criteria is met. C. Fuzzy C-Means Fuzzy clustering allows each feature vector to belong to more than one cluster with different membership degrees (between 0 and 1) and vague or fuzzy boundaries between clusters. This method (developed by Dunn in 1973 and improved by Bezdek in 1981) is frequently used in pattern recognition [16, 17].Pseudo code for the Fuzzy CMeans clustering algorithm is described in Algorithm2. Algorithm 2: Fuzzy C Means clustering algorithm [12] Require: D = {d1, d2, d3... dn} // Set of n data points. K - Number of desired clusters Ensure: A set of K clusters. Steps: 1. Randomly initialize the membership matrix using this equ ∑𝐶𝑗=1 𝜇𝑗 (𝑥𝑖 ) = 1 i = 1, 2,….., k 2. Calculate the Centroid using equation, ∑𝑖[𝜇𝑗 (𝑥𝑖 )]𝑚 𝑥𝑖 𝐶𝑗 = ∑𝑖 [𝜇𝑗 (𝑥𝑖 )]𝑚 3. Calculate dissimilarly between the data points and Centroid using the Euclidean distance.
145
International Journal of Computational Intelligence and Informatics, Vol. 3: No. 3, October - December 2013
4. Update the New membership matrix using the equation, 1
[ ]1⁄𝑚−1 𝜇𝑗 (𝑥𝑖 ) =
𝑑𝑗𝑖
∑𝑐𝑘=1[
1 𝑑𝑘𝑖
]1⁄𝑚−1
Here m is a fuzzification parameter, the range m is always {1.25, 2} 5. Go back to Step 2, unless the centroids are not changing. D. Rough K-Means In rough clustering each cluster has two approximations, a lower and an upper approximation. The lower approximation is a subset of the upper approximation. The members of the lower approximation belong certainly to the cluster; therefore they cannot belong to any other cluster. The data objects in an upper approximation may belong to the cluster. Since their membership is uncertain they must be a member of an upper approximation of at least another cluster. Algorithm 3: Rough K-Means clustering algorithm [13] Require: D = {d1, d2, d3, ..., dn } // Set of n data points. Steps: 1. Select initial clusters of n objects into K clusters. 2. Assign each object to the Lower bound (L(x)) or upper bound (U(x)) of cluster/ clusters respectively as: For each object v, let d (v,xi) be the distance between itself and the centroid of cluster x i. The difference between d (v,xi) / d(v,xj), 1≤ i, j ≤ K is used to determine the membership of v as follows: • If d (v,xi) / d(v,xj) ≤ thershold, then v ∈U(xi) & v ∈ U(xj). Furthermore, v will not be a part of any lower bound. • Otherwise, v∈L(xi),such that d(v,xi) is the minimum for 1≤ i ≤ k. In addition, v∈U(xi). 3. For each cluster xi re-compute center according to the following equations the weighted combination of the data points in its lower_bound and upper_bound.
where 1≤ j ≤ K. The parameters wlower and wupper correspond to the relative importance of lower and upper bounds. If convergence criterion is met, i.e. cluster centers are same to those in previous iteration, then stop; else go to step2. a) Rough properties of the cluster algorithm Property 1: a data object can be a member of one lower approximation at most. Property 2: a data object that is a member of the lower approximation of a cluster is also member of the upper approximation of the same cluster. Property 3: a data object that does not belong to any lower approximation is member of at least two upper approximations. E. Confusion Matrix A confusion matrix (Kohavi and Provost, 1998) contains information about actual and predicted classifications done by a classification system. Performance of such systems is commonly evaluated using the data in the matrix. Table I shows the confusion matrix for a two class classifier. TABLE I.
CONFUSION MATRIX FOR TWO CLASS PROBLEM Predicted Negative
Actual
Positive
Negative
a
b
Positive
c
d
146
International Journal of Computational Intelligence and Informatics, Vol. 3: No. 3, October - December 2013
Precision (P) is the proportion of the predicted positive cases that were correct, as calculated using the equation: 𝑑 𝑃= (3) 𝑏+𝑑
Recall or true positive rate (TP) is the proportion of positive cases that were correctly identified, as calculated using the equation: 𝑑 𝑇𝑃 = (4)
F-Measure is a derived effectiveness measurement. The resultant value is interpreted as a weighted average of the precision and recall. The best value is 1 and the worst is 0.
𝑐+𝑑
𝐹=
(𝛽 2 +1)∗𝑃∗𝑇𝑃
(5)
𝛽 2 ∗𝑃+𝑇𝑃
III. EXPERIMENTAL RESULTS A. Data Set This archive contains 13910 measurements from 16 chemical sensors utilized in simulations for drift compensation in a discrimination task of 6 gases at various levels of concentrations. The goal is to achieve good performance over time. The dataset was gathered within January 2007 to February 2011 (36 months) in a gas delivery platform facility situated at the Chemo Signals Laboratory in the Bio Circuits Institute, University of California San Diego. The measurement system platform provides versatility for obtaining the desired concentrations of the chemical substances of interest with high accuracy and in a highly reproducible manner, minimizing thereby the common mistakes caused by human intervention and making it possible to exclusively concentrate on the chemical sensors for compensating real drift. The resulting dataset comprises recordings from six distinct pure gaseous substances, namely Ammonia, Acetaldehyde, Acetone, Ethylene, Ethanol, and Toluene, each dosed at a wide variety of concentration values ranging from 5 to 1000 ppmv [7]. This dataset is available in this web link http://archive.ics.uci.edu/ml/datasets/Gas+Sensor+Array+Drift+Dataset. TABLE II. Batch Batch 1 Batch 2 Batch 3 Batch 4 Batch 5 Batch 6 Batch 7 Batch 8 Batch 9 Batch 10
DATA SET
No. of Objects 445 1244 1586 161 197 2300 3613 294 470 3600
No. of Classes 6 6 5 5 5 6 6 6 6 7
B. Classification Performance In this section the Gas Sensor Array Drift data set Batches are clustered by the K-Means, FCM and Rough KMeans algorithm without considering class labels. Then they obtained results are compared with the original class labels through the confusion matrix. Before the clustering, normalization was done using min-max normalization method. TABLE III. Batch 1 2 3 4 5 6 7 8 9 10
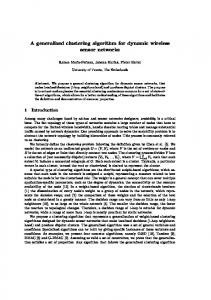
BATCH WISE PRECISION VALUE OF CLUSTERING ALGORITHMS K-Means 0.4438 0.1908 0.1262 0.2649 0.0947 0.1067 0.1353 0.2316 0.1676 0.2136
Fuzzy C Means 0.0202 0.2892 0.0882 0.3821 0.1915 0.1268 0.1896 0.1666 0.2029 0.1962
Rough K-Means 0.5241 0.4322 0.3582 0.5072 0.3614 0.3123 0.2442 0.3427 0.3126 0.4277
147
International Journal of Computational Intelligence and Informatics, Vol. 3: No. 3, October - December 2013
0.6 0.5
Precision
0.4 K-Means
0.3
Fuzzy C Means 0.2
Rough K-Means
0.1 0 1
2
3
4
5
6
7
8
9
10
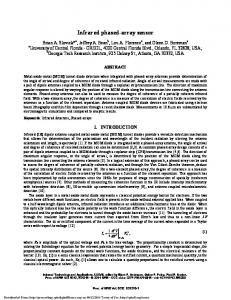
Batch Figure 1. Batch wise Precision value. TABLE IV.
BATCH WISE RECALL OF CLUSTERING ALGORITHMS
Batch
K-Means
Fuzzy C Means
Rough K-Means
1 2 3 4 5 6 7 8 9 10
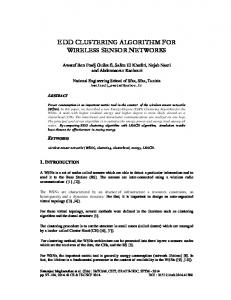
0.4035 0.0985 0.2294 0.2475 0.1833 0.0747 0.1077 0.3011 0.1697 0.1724
0.0370 0.1926 0.1046 0.5166 0.1243 0.2459 0.3273 0.0233 0.1151 0.2055
0.4112 0.2463 0.2681 0.6318 0.3692 0.2915 0.4033 0.3569 0.3241 0.2967
0.7 0.6
Recall
0.5 0.4
K-Means
0.3
Fuzzy C Means Rough K-Means
0.2 0.1 0 1
2
TABLE V.
3
4
5 6 7 8 9 Batch Figure 2. Batch wise Recall value
10
BATCH WISE F-MEASURE OF CLUSTERING ALGORITHMS
Batch
K-Means
Fuzzy C Means
Rough K-Means
1 2 3 4 5 6 7 8 9 10
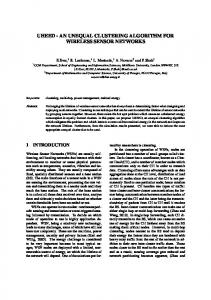
0.3692 0.1241 0.1616 0.1787 0.1241 0.0839 0.0995 0.2253 0.1681 0.1609
0.0235 0.2286 0.0937 0.4026 0.1472 0.1112 0.2293 0.0409 0.1436 0.1925
0.5622 0.3214 0.2631 0.5041 0.2215 0.2043 0.2841 0.3616 0.3141 0.3629
148
International Journal of Computational Intelligence and Informatics, Vol. 3: No. 3, October - December 2013
0.6 0.5
F-Measure
0.4 K-Means
0.3
Fuzzy C Means 0.2
Rough K-Means
0.1 0 1
2
3
4
5
6
7
8
9
10
Batch Figure 3. Batch wise F-Measure value.
Table III, IV and V and fig. 1, 2 and 3 represent the performance (Precision, Recall, F-measure) of clustering algorithms that shows Rough K-Means gives the better result rather than K-Means and Fuzzy C-Means.
IV. CONCLUSION In this paper, we studied and implemented the clustering methods K-Means, Fuzzy C-Means (FCM) and Rough K-Means algorithm for the Gas Sensor Array Drift Dataset. The performance was evaluated using confusion matrix with Precision, Recall and F-Measure. It was observed that the performance of the Rough KMeans is significant in removing drift in the Gas Sensor Array Drift Dataset. Rough K-Means outperforms for Gas Sensor Array Drift data set than other methods and has proven to be the best method for drift compensation. Therefore, finding solution to pre-processing of normalization select the different centroids as clusters seed points, various measures are used to improve the cluster performance is our future endeavor. ACKNOWLEDGMENT The first and third author immensely acknowledges the partial financial assistance under University Research Fellowship, Periyar University, Salem. The second author immensely acknowledges the UGC, New Delhi for partial financial assistance under UGCSAP (DRS) Grant No. F.3-50/2011.
REFERENCES [1]
[2]
[3] [4] [5]
[6]
[7]
[8] [9] [10] [11]
Sofiane Brahim-Belhouari, Amine Bermak and Philip C. H. Chan, “Gas Identification with Microelectronic Gas Sensor in Presence of Drift Using Robust GMM,” IEEE ICASSP 2004, 0-7803-8484-9/04/$20.00, pp. V-833 - V-836, September 2004. D. Arul Pon Daniel, K. Thangavel, and R. Subash Chandra Boss, “A Review of Early Detection of Cancers using Breath Analysis”, Proc. IEEE Conf. Pattern Recognition, Informatics and Mobile Engineering (PRIME 2012), IEEE Press, March 2012, pp. 433-438, DOI: 10.1109/ICPRIME.2013.6208385. John-Erik Haugen, Oliver Tomic, Knut Kvaal, “A calibration method for handling the temporal drift of solid state gassensors”, Analytica Chimica Acta, pp. 23–39, October 1999. K. Persaud, G. Dodd, “Analysis of discrimination mechanisms in the mammalian olfactory system using a model nose., Nature”, pp. 352–355. A. Ziyatdinov, S. Marco, A. Chaudry, K. Persaud, P. Caminal, A. Perera, “ Drift Compensation of Gas Sensor Array Data by Common Principal Component Analysis”, Preprint submitted to Sensors and Actuators: B, pp 1-23, October 6, 2009. W. Zhong, G. Altun, , R. Harrison, , P. C. Tai, & Y. Pan, “Improved K-means clustering algorithm for exploring local protein sequence motifs representing common structural property” , NanoBioscience, IEEE Transactions on. 4, 255265. Alexander Vergara and Shankar Vembu and Tuba Ayhan and Margaret A. Ryan and Margie L. Homer and Ramón Huerta, “Chemical gas sensor drift compensation using classifier ensembles”, Sensors and Actuators B: Chemical (2012) doi: 10.1016/j.snb.2012.01.074. Chris Ding and Hanchuna Peng, “Mininmum Redundancy Feature Selection from Microarray Gene Expression Data”, proceedings of the International Bioinformatic Conference, Date on 11-14, August - 2003. Chen Zhang and Shixiong Xia, “ K-Means Clustering Algorithm with Improved Initial center,” in Second International Workshop on Knowledge Discovery and Data Mining (WKDD), pp. 790-792, 2009. F. Yuan, Z. H. Meng, H. X. Zhangz, C. R. Dong, “ A New Algorithm to Get the Initial Centroids”, proceedings of the 3rdInternational Conference on Machine Learning and Cybernetics, pp. 26-29, August 2004. A. M. Fahim, A. M. Salem, F. A. Torkey and M. A. Ramadan, “An Efficient enhanced K-Means clustering algorithm”, journal of Zhejiang University, 10 (7): 1626 - 1633, 2006.
149
International Journal of Computational Intelligence and Informatics, Vol. 3: No. 3, October - December 2013
[12] Binu Thomas, Raju G., and SonamWangmo, “A Modified Fuzzy C-Means Algorithm for Natural Data Exploration”.
World Academy of Science,Engineering and Technology 49 2009. [13] P. Lingras, R. Yan, C. West, Comparison of conventional and rough k-means clustering, in: International conference on
[14] [15] [16]
[17]
Rough Sets, Fuzzy Sets, Data Mining and Granular Computing, Lecture Notes in Artificial Intelligence, vol. 2639, Springer, Berlin, pp. 130–137, 2003. D. L. Davies and D. W. Bouldin, “A cluster separation measure”, IEEE Trans. Pattern Anal. Machine Intell., vol. PAMI-1, pp. 224–227, 1979. Velayutham. C, Thangavel. K, “Unsupervised Feature Selection Using Rough Set”, Proceeding on International Conference, Emerging Trends in Computing (ICETC-2011), 17-18 Mar 2011. E. Elayaraja, K. Thangavel , B. Ramya and M.Chitralegha, “Extraction of Motif Patterns from Protein Sequence Using Rough- K-Means Algorithm”, in: International Conference on Communication Technology and System Design 2011, Elsevier SciVerse ScienceDirect Procedia Engineering, Vol. 30, no. 107, pp. 814 – 820, 2012. E.N.Sathishkumar, K.Thangavel and T.Chandrasekhar, “A New Hybrid K-Mean-Quick Reduct Algorithm for Gene Selection,” WASET, International Journal of Computer, Information Science and Engineering. Vol. 7 No. 2, pp. 150155, 2013.
150