1
Application of N-PLS calibration to the simultaneous determination of Cu2+, Cd2+ and Pb2+ using peptide modified electrochemical sensors Edith Chow, Diako Ebrahimi, J. Justin Gooding* and D. Brynn Hibbert∗ School of Chemistry, The University of New South Wales, Sydney, NSW 2052, Australia The simultaneous determination of Cu2+, Cd2+ and Pb2+ is demonstrated at four modified gold electrodes using N-PLS calibration. Three of the electrodes were modified with the peptides Gly-Gly-His, γ-Glu-Cys Gly and human angiotensin I which were covalently attached to thioctic acid self-assembled monolayers and the fourth electrode was modified with thioctic acid only. Voltammetry at the modified electrodes in the presence of the three metal ions revealed one peak due to the reduction of copper and another due to the overlapping peaks of cadmium and lead which made quantification using conventional methods difficult. N-PLS was used to calibrate and predict trace concentrations (100 nM to 10 µM) of mixtures of Cu2+, Cd2+ and Pb2+.
Introduction Classical methods such as atomic absorption spectroscopy (AAS) and inductively coupled plasma-mass spectrometry (ICP-MS) are highly accurate and reliable for the analysis of metal ions. However, the high cost of instrumentation and complexity of operation have challenged researchers to develop new techniques to better detect and quantify metals in a variety of matrices. Stripping analysis is one of the most sensitive electroanalytical techniques for monitoring metal ions.1 Its high sensitivity is attributed to the preconcentration step in which metals are accumulated at the working electrode. Potential scanning in a positive direction (anodic stripping voltammetry) or by applying a positive oxidative current (potentiometric stripping analysis) then allows the metal to be stripped and quantified. Work by Wang’s group on screen-printed electrodes for stripping analysis2 has shown the utility of the method for field applications3, 4. The use of square wave anodic stripping voltammetry has been demonstrated by Palchetti et al.5 in which screen-printed graphite electrodes modified with a cellulose-derivative mercury ∗
Corresponding authors. Tel.: +61-2-93854713; fax: +61-2-93856141 E-mail address:
[email protected] (Chemometrics) Tel: +61-2-93855834: fax: +61-2-93856141 E-mail address:
[email protected] (Electrochemistry)
Chow, Ebrahimi, Hibbert and Gooding
Draft 2008/09/07
2
coating were used for the determination of lead, cadmium and copper. The stripping method provides useful information on the total metal content with detection limits at the ppb level. Perhaps more useful for biological and environmental measurements are biosensors since the biological recognition component (located in close proximity to a transducer which can be either electrochemical, optical or gravimetric) could provide information on how metal ions interact with organisms and hence bioavailable content.6 Biosensors can be either highly specific towards a particular analyte7 or display a broad range of selectivities.8, 9 For example, Li and Lu7 have exploited catalytically active DNA as a biosensor for Pb2+ with over 80-fold selectivity over other metal ions. Hybridisation of the fluorophore labelled DNA with the complementary enzyme strand resulted in quenching of the fluorescence. In the presence of Pb2+, quenching was eliminated and this intensified the fluorescence output. In a less selective approach, Csöregi and co-workers8, 9 developed a conductivity sensor based upon a change in conformation of a metallothionein protein upon metal ion binding. The protein, GSTSmtA, was over-expressed in Escherichia coli and covalently attached to thioctic acid on a gold substrate for the detection of heavy metal ions. Upon recognition of the metal ion, the protein folded to form a more compact structure and the resultant capacitance of the electrode surface increased. GST-SmtA electrodes displayed a broad selectivity for Cu2+, Cd2+, Hg2+ and Zn2+ with detection limits at the femtomolar range. The drawback with these two extreme types of biosensors is that in the highly specific case, detection is limited to one analyte, whereas in the other case, low selectivity does not allow the determination of complex mixtures. Recently, sensor arrays, where each particular element in the array has some selectivity towards a range of analytes, have been introduced to overcome this problem.10, 11 The coating on each particular element of the array is chosen to provide different patterns of responses. These patterns can be deconvoluted using a chemometrics approach to obtain information about the individual components.12 Multivariate calibration is a useful technique for building a model of the relationship between independent and dependent variables. The calibration is posed in inverse mode with Y as the independent variable (e.g. concentration) and X as the dependent variable (e.g. voltammetric currents). The developed model is then used on new X data to predict unknown Y value(s). Partial least squares (PLS) regression13-20 is one of the more popular multivariate calibration procedures owing to its good prediction ability and ease of use. It follows from the fact that PLS searches for a compromise between better fitting (less error in X) and better prediction (less error in Y). In other words, the PLS model fitness is somewhat sacrificed in favour of its prediction ability. The PLS model can be viewed as consisting of “outer relations” of individual X and Y blocks and an “inner relation” linking both X and Y.13, 21 This can be represented graphically as shown in Fig. 1. The goal is to
Chow, Ebrahimi, Hibbert and Gooding
Draft 2008/09/07
3
minimise the error matrix F while maintaining the correlation between X and Y through the inner relation U = BT.
a
m X
=
n
a P’
m
m
T
+
E
n
n
“inner relation”
a
p
a Y n
=
“outer relation”
U = BT Q’
U n
p
p +
F n
Figure 1 PLS model consisting of “outer relations” (X and Y blocks) and an “inner relation” linking both blocks.
The matrix X is decomposed into a scores matrix, T, loadings matrix, P’, and an error matrix, E. The matrix, Y, is decomposed into a scores matrix, U, loadings matrix, Q’, and an error matrix, F.13 The extracted factors, T, are used to predict the Y scores, U, and these predictions are then used to construct predictions for the responses. N-PLS regression is the extension of ordinary PLS (i.e. two way PLS) to three or more (N) kinds of variables or objects.22 Two way data (e.g. voltammetric currents) can typically be represented in a data matrix with columns as variables (e.g. potential) and rows as objects (e.g. samples). By introduction of an extra mode (in the present example, different electrodes) we now have three-way data, which can be represented as a three way array (i.e. a box). The theory and mathematical details of different algorithms for fitting and calibrating multi-way data sets has been given elsewhere19 and reiterating the literature is not aimed in this manuscript; however the algorithm chosen here is known as N-PLS which has been developed by Bro.19 It is a sequential method that decomposes the data array X similar to Parallel Factor Analysis (PARAFAC)23 and then predicts Y. The reason to utilise a multi-linear (three-way in this case) calibration method in this study was the multi-way (three-way in this case: electrode × potential × solution) structure of voltammetric current data and the need to predict the concentration of three metal species.
Chow, Ebrahimi, Hibbert and Gooding
Draft 2008/09/07
4
In our work, we elect to use peptides as biorecognition molecules. Peptides are most compatible with the construction of arrays since the affinity for a particular metal ion can be easily tuned by changing the peptide sequence.24, 25 With twenty naturally occurring amino acids, there are many possible peptide sequences to form complexes with metals. Our research group has previously developed a simple, generic strategy towards the fabrication of peptide modified electrochemical sensors.26, 27 This approach involves the attachment of the amine end of a peptide to a carboxyl terminated selfassembled monolayer (SAM) on a gold electrode. The advantage of using electrochemistry is that the different redox potentials of metals can be exploited for enhanced selectivity. In earlier work, the copper binding tripeptide, Gly-Gly-His, was attached to a SAM of 3-mercaptopropionic acid (MPA) with low detection limits for Cu2+.27-29 Cu2+ was bound to Gly-Gly-His upon accumulation in copper solution at open circuit potential for 10 minutes and was quantified by reduction of complexed Cu2+ to form underpotential deposited (UPD) copper by Osteryoung square wave voltammetry (OSWV).29 The success of this strategy has also led to the development of sensors for Cd2+ using γ-Glu-Cys-Gly (glutathione)30 and His-Ser-Gln-Lys-Val-Phe31 coupled to MPA SAMs on gold based on the UPD/stripping principle. For Pb2+ detection, a thioctic acid (TA) SAM was used to link human angiotensin I (Asp-Arg-Val-Tyr-Ile-His-ProPhe-His-Leu). Thioctic acid was necessary for stable Pb2+/Pb0 electrochemistry although the sensitivity was lower than that at an MPA-angiotensin I modified electrode.32 Although the nature of the peptide can result in high selectivity towards a given ion (e.g. Gly-Gly-His and Cu2+), a peptide can often bind one or two other ions to a measurable extent. As a result, multiple peaks in the voltammogram were observed in the presence of electroactive interfering ions and it was difficult to quantify the amount of the analyte accurately unless there was prior knowledge of the amount of interferent present. In this paper, we describe a peptide based electrochemical sensor array for the simultaneous determination of Cu2+, Cd2+ and Pb2+. The sensor array consists of the peptides identified in the earlier work for Cu2+, Cd2+ and Pb2+ involving Gly-Gly-His, glutathione and angiotensin I, respectively. The design uses thioctic acid SAMs to link each peptide to the gold surface. Additionally, a fourth element in the array, modified with thioctic acid only was used. For calibration, the concentrations of Cu2+, Cd2+ and Pb2+ were chosen to encompass the dynamic range of the sensors using an experimental design. The resulting voltammograms were calibrated using N-PLS and the ability to predict test samples was investigated.
Experimental section Materials Gly-Gly-His, glutathione (reduced form, >98% purity), human angiotensin I, D,L-6,8thioctic acid (TA) and N-hydroxysuccinimide (NHS) were purchased from Sigma
Chow, Ebrahimi, Hibbert and Gooding
Draft 2008/09/07
5
(Sydney, Australia). 1-ethyl-3-(3-dimethylaminopropyl) carbodiimide hydrochloride (EDC), 2-(N-morpholino)-ethanesulfonic acid (MES), and perchloric acid were from Aldrich (Sydney, Australia). Sodium hydroxide, sodium chloride, sulfuric acid, nitric acid, ammonium acetate, ethanol, copper(II) sulfate and lead(II) nitrate were obtained from Ajax (Sydney, Australia). Cadmium(II) nitrate was purchased from Fluka (Sydney, Australia). All solutions were prepared with Milli-Q water (18 MΩ cm, Millipore, Sydney). Buffer solutions used in this work were 50 mM ammonium acetate (pH 7.0) and 0.1 M MES (pH 6.8). The pH was adjusted with either NaOH or HNO3 solutions. Stock metal solutions (0.1 M) were prepared in Milli-Q water and dilute metal solutions by serial dilution in ammonium acetate. All glassware was rinsed with 6 M HNO3 followed by Milli-Q water before use to avoid metal contamination. Preparation of modified electrodes Gold electrodes were prepared by sealing polycrystalline gold wire (>99.99% gold, Aldrich) in 4 mm diameter glass tubes with EPON Resin 825 and EPI-CURE curing agent 3271 from Shell (Sydney, Australia).33 The cut end of the wire was polished with 1.0 µm alumina, followed by 0.3 and 0.05 µm alumina slurry on microcloth pads (Buehler, Lake Bluff, IL). After removal of trace alumina from the surface, by rinsing with Milli-Q water and brief cleaning in an ultrasonic bath, the electrodes were further cleaned by cycling between -0.3 V and +1.5 V in 50 mM H2SO4 at a scan rate of 0.15 V s-1 until a reproducible scan was obtained. The electrochemical area of the electrode was determined from the reduction of gold oxide by the method of Hoogvliet et al. using a conversion factor of 482 µC cm-2.34 Gold electrodes were modified with TA-Gly-Gly-His, TA-glutathione, TAangiotensin I and TA (Fig. 2). Modification of the electrode with TA was performed by incubating a gold electrode overnight in 10 mM TA in 75% ethanol, 25% water. This was followed by rinsing with absolute ethanol.
Chow, Ebrahimi, Hibbert and Gooding
Draft 2008/09/07
6
Scheme 1 Steps in the fabrication of peptide modified sensors. A clean gold electrode is modified with a selfassembled monolayer of TA followed by activation of the carboxyl groups with EDC and NHS. Coupling of the N-terminus of the peptide results in the formation of the TA-peptide modified sensor.
Modification of the electrodes with peptides was performed as shown in Scheme 1. A TA SAM was formed on a gold electrode, followed by rinsing with ethanol and activating the carboxyl terminus by immersing in a stirred solution of 20 mM EDC and 4
Chow, Ebrahimi, Hibbert and Gooding
Draft 2008/09/07
7
mM NHS in 100 mM MES (pH 6.8) for 1 hour. After thorough rinsing with 25 mM MES buffer, the modified electrode was reacted overnight with the peptide in MES buffer to form the TA-peptide modified electrode. For modification with the peptides Gly-Gly-His and glutathione a concentration of 25 mg mL-1 was used, whereas for modification with angiotensin I a concentration of 10 mg mL-1 was used.
Figure 2: Gold electrodes modified with TA-Gly-Gly-His, TA-glutathione, TA-angiotensin I and TA.
Measurement procedure All measurements were made in a water-jacketed cell at 25°C after equilibration for at least one hour. Copper(II), cadmium(II) and lead(II) ions were accumulated at the TAGly-Gly-His, TA-glutathione, TA-angiotensin I and TA modified electrodes at open circuit potential by immersing all four electrodes into 10 mL of a stirred aqueous solution of a mixture of the metal ions in 50 mM ammonium acetate (pH 7.0) for 10 min. The electrodes were then removed, rinsed with metal-free ammonium acetate and transferred to a cell with electrolyte of 50 mM ammonium acetate (pH 7.0) and 50 mM NaCl for electrochemical measurements by OSWV. After the measurement, bound metal ions were eliminated from the electrodes at +0.5 V for 30 s in 0.1 M HClO4. Electrochemical measurements All electrochemical measurements were performed with an Autolab PGSTAT 12 potentiostat (Eco Chemie, Netherlands). Multiplexing of the working electrodes was accomplished using a 16 channel switch system of which 4 were used. The four working electrodes were plugged into the inputs of the multiplexer and the output of the multiplexer was connected to the working electrode lead of the Autolab. The instrument was controlled and automated with a program written in GPES software. OSWV and time base experiments were carried out at the working electrodes with a platinum flag
Chow, Ebrahimi, Hibbert and Gooding
Draft 2008/09/07
8
auxiliary electrode and a AgAgCl3.0 M NaCl reference electrode. OSW voltammograms for the reduction process were acquired at each working electrode sequentially (TA-Gly-Gly-His, followed by TA-glutathione, TA-angiotensin I and TA) between +0.40 and -0.45 V at a pulse amplitude of 0.025 V, a step of 0.004 V and frequency of 25 Hz. The duty cycle of the multiplexer was 42 s (2 s quiet time then 8.5 s for each OSWV). Calibration and test sets A 16 sample set was constructed for calibration with N-PLS modelling. The analyte concentrations of Cu2+, Cd2+ and Pb2+ corresponded to a central composite design: a full factorial design at two levels (23 = 8 samples), a star design (2 × 3 = 6 samples) and a centre point (2 replicates). Each sample contained one of five different concentration levels (relative concentrations = -1.68, -1, 0, +1 and +1.68) of each metal ion as shown in Table 1. The order of experiments was randomised to confound uncontrolled factors. The concentration of the analytes were in the range of 10 nM to 1 µM for Cu2+, 0.5 µM to 10 µM for Cd2+ and 50 nM to 1 µM for Pb2+ and were chosen to cover the dynamic range of the sensors. Three test samples were prepared at analyte concentrations different from those chosen for calibration but within the design parameters (see Table 2).
Chow, Ebrahimi, Hibbert and Gooding
Draft 2008/09/07
9
Table 1 Coded levels and corresponding concentrations of Cu2+, Cd2+ and Pb2+ used in a central composite design.
1
Level of Cu2+ (c / µmol L-1) -1 (0.21)
Level of Cd2+ (c / µmol L-1) -1 (2.4)
Level of Pb2+ (c / µmol L-1) -1 (0.24)
2
-1 (0.21)
-1 (2.4)
+1 (0.81)
3
-1 (0.21)
+1 (8.1)
-1 (0.24)
4
-1 (0.21)
+1 (8.1)
+1 (0.81)
5
+1 (0.80)
-1 (2.4)
-1 (0.24)
6
+1 (0.80)
-1 (2.4)
+1 (0.81)
7
+1 (0.80)
+1 (8.1)
-1 (0.24)
8
+1 (0.80)
+1 (8.1)
+1 (0.81)
9
-1.68 (0.01)
0 (5.3)
0 (0.53)
10
+1.68 (1.0)
0 (5.3)
0 (0.53)
11
0 (0.51)
-1.68 (0.5)
0 (0.53)
12
0 (0.51)
+1.68 (10.0)
0 (0.53)
13
0 (0.51)
0 (5.3)
-1.68 (0.05)
14
0 (0.51)
0 (5.3)
+1.68 (1.0)
15
0 (0.51)
0 (5.3)
0 (0.53)
16
0 (0.51)
0 (5.3)
0 (0.53)
Calibration solution
N-PLS modelling All calculations were performed using MATLAB 7.0 (The MathWorks Inc.) for Windows and the N-way Toolbox for Matlab version 2.11 (obtained from R. Bro at http://www.models.kvl.dk/source/.35). The software was validated using data sets available from http://www.models.kvl.dk/source/nwaytoolbox/download.asp. The files “claus.mat”, containing fluorescence excitation emission data from five samples of tryptophan, phenylalanine, and tyrosine; “brod.mat”, containing the assessments of eight judges over ten breads with respect to eleven attributes; and “sugar.mat”, with the fluorescence spectra of water-dissolved sugar, were run with the suite of programs used here and results verified against the published data.
Chow, Ebrahimi, Hibbert and Gooding
Draft 2008/09/07
10
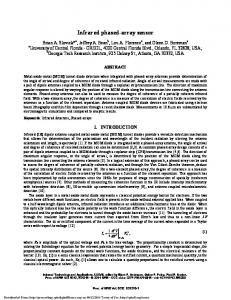
Results and discussion Osteryoung square wave voltammograms The voltammograms prior to metal ion accumulation are typically featureless in the potential range between 0.40 and -0.45 V. Occasionally, small peaks due to metal ion contamination do arise in the voltammogram during to the modification process or due to trace contamination in solutions. In this case, the currents of the blank voltammogram were subtracted from the voltammogram after accumulation. As a data preprocessing step, the difference voltammogram was also baseline subtracted prior to modelling. Illustrated in Fig. 3 are the baseline-subtracted voltammograms after accumulation of metal ions for 10 minutes at the four modified electrodes in calibration sample number 16 (the centre point of the central composite design which contains 0.51 µM Cu2+, 5.3 µM Cd2+ and 0.53 µM Pb2+). The OSW voltammograms obtained upon metal ion accumulation for all four modified electrodes displayed two peaks in the voltammogram. The more positive peak arising at ~0.1 V is due to the reduction of Cu2+ to Cu0. The more negative peak (in the region between -0.28 to -0.32 V) is due to both the reduction of Cd2+ to Cd0 and Pb2+ to Pb0 occurring at similar potentials. The reduction of Cu2+, Cd2+ and Pb2+ results in the underpotential deposition of each metal onto the gold electrode surface.29, 30, 32 All four modified electrodes displayed different levels of metal uptake upon accumulation in Cu2+, Cd2+ and Pb2+. As expected, the greatest peak current density for copper (5.0 µA cm-2) was obtained using the TA-Gly-Gly-His modified electrode (Fig. 3). This peptide is known to form a highly stable 4 N square planar complex.36, 37 The TA-Gly-Gly-His modified electrode was also able to bind Cd2+ and Pb2+ as illustrated by a smaller peak in the voltammogram at -0.315 V. For an electrode modified with TA only, smaller peak currents were obtained for Cu2+, Cd2+ and Pb2+ compared to all other electrode types owing to the weaker binding capacity of the single carboxyl group. These results using the four modified electrodes demonstrate the ability of peptides to bind metal ions with higher affinity than simple, unidentate ligands. The tuning of these amino acid sequences have led to sensors which display a broad range of selectivities for a range of metal ions. The resulting sets of voltammograms can then be used to calibrate Cu2+, Cd2+ and Pb2+ using a suitable regression method such as N-PLS.
Chow, Ebrahimi, Hibbert and Gooding
Draft 2008/09/07
11
potential / V -0.6
-0.4
-0.2
0
0.2
0.4
current density / mA cm -2
0 -1
(iv)
-2 (ii)
-3 (iii)
-4
(i)
-5 -6
Figure 3: Baseline subtracted OSW voltammograms of the difference between the voltammograms obtained before and after metal ion accumulation in calibration sample number 16 (level (0, 0, 0) of Cu2+, Cd2+ and Pb2+ in Table 1) in 50 mM ammonium acetate (pH 7.0) for 10 minutes at 25°C. The electrodes were modified with (i) TA-Gly-Gly-His, (ii) TA-glutathione, (iii) TA-angiotensin I and (iv) TA. OSW voltammograms were measured in 50 mM ammonium acetate (pH 7.0) and 50 mM NaCl at 25°C at a pulse amplitude of 0.025 V, a step of 0.004 V and frequency of 25 Hz.
N-PLS calibration and prediction N-PLS was used to correlate the variations in the voltammogram with the variations in the concentrations of Cu2+, Cd2+ and Pb2+. Regression models were fitted for Cu2+, Cd2+ and Pb2+ using 1 to 15 principal components (PCs) and the graphs in Fig. 4 illustrate the percentage of variation explained in the voltammogram currents and concentration with each PC. Fig. 4(a) shows an initial sharp rise in the percentage of variation explained in the sum of squares of the residuals of X (SSX) and the sum of squares of the residuals of Y (SSY) for Cu2+. This becomes almost constant after 2 PCs for both X and Y. For Cd2+, most of the variation in the voltammogram currents could be fitted using 4 PCs and most of the variation in concentration could be fitted using 7 PCs (Fig. 4(b)). Similarly for Pb2+, most of the variation in the voltammogram currents could be fitted using 2 PCs and most of the variation in concentration could be fitted using 5 PCs (Fig. 4(c)). Prediction of the concentrations of Cu2+, Cd2+ and Pb2+ for the calibration samples was made using the optimal number of PCs explaining the Y variance. These were 2, 7 and 5 PCs for Cu2, Cd2+ and Pb2+, respectively. The standard error of calibration (
SS y N−p
, N = 16, p = number of principal components) was 1.3×10⁻⁷,
7.0×10⁻⁷ and 8.8×10⁻⁸ M for Cu2+, Cd2+ and Pb2+, respectively. Fig. 5 shows the predicted concentrations versus the actual concentrations of the calibration solutions for
Chow, Ebrahimi, Hibbert and Gooding
Draft 2008/09/07
12
Cu2+, Cd2+ and Pb2+. The graph shows good correlations between the predicted and actual concentrations with the exception of samples at the extreme ends of the experimental design which show larger prediction errors. There is also some variation in prediction with the same analyte concentration from different samples due to the different extents of cross-interferences. To improve on the calibration of Cu2+, Cd2+ and Pb2+ a more suitable range of concentrations may be necessary. The concentrations chosen for this study covered a wide dynamic range which can be problematic as calibration samples in the lower or upper concentration range (samples 8-14) may not fall in the linear range. Note that PLS is a linear method and thus requires more principal components to model the non-linear data over the entire range. The results also suggest that central composite design might not be the best for calibration as there are only single points at the extremities. A more appropriate calibration set for future work would have concentrations corresponding to a box design so that there are multiple points at the extremes.
Chow, Ebrahimi, Hibbert and Gooding
Draft 2008/09/07
13
100
% variation explained
% variation explained
100
95
90
85
80
95
90
85
80 0
3 6 9 12 number of PCs (a)
15
0
3 6 9 12 number of PCs
15
0
3 6 9 12 number of PCs (b)
15
% variation explained
100
95
90
85
80
(c)
Figure 4: Percentage of variation explained in SSX () and SSY () after fitting a model to 1-15 PCs. X represents the voltammogram currents and Y represents the concentration of the analyte. The analytes are (a) Cu2+, (b) Cd2+ and (c) Pb2+. Arrows represent the optimal number of PCs.
Chow, Ebrahimi, Hibbert and Gooding
Draft 2008/09/07
1.0
10
0.8
8
conc (predicted) / mM
conc (predicted) / mM
14
0.6
0.4 0.2 0.0
6 4
2 0
0.0 0.2 0.4 0.6 0.8 1.0
0
conc (actual) / µM
2 4 6 8 10 conc (actual) / µM (b)
(a)
conc (predicted) / mM
1.0 0.8 0.6
0.4 0.2 0.0 0.0 0.2 0.4 0.6 0.8 1.0 conc (actual) / µM (c)
Figure 5: Predicted versus actual concentrations for samples 1-16 using N-PLS after fitting a model to 2, 7 and 5 PCs for (a) Cu2+, (b) Cd2+ and (c) Pb2+, respectively. The number of PCs used was determined from the Y variance explained in Fig. 4.
Prediction of three test samples was performed based on the calibrations for Cu2+, Cd2+ and Pb2+ using 2, 7 and 5 PCs, respectively (Table 2). Without N-PLS modelling, the concentrations of Cu2+, Cd2+ and Pb2+ in test samples would be very hard to predict from
Chow, Ebrahimi, Hibbert and Gooding
Draft 2008/09/07
15
the voltammograms. Not only do Pb2+ and Cd2+ voltammograms overlap, Pb2+ also reduces the copper peak in MPA-Gly-Gly-His when it competes for peptide.29 For the prediction of Cd2+ in test sample 1, the signal may be masked by the high concentration of Pb2+. The prediction error was largest at test samples where a particular analyte was at one of the extreme ends of the experimental design used for calibration, and reflect the nature of the central composite design. The deviations between actual and predicted concentrations are affected by the quality of the calibration set and the number of PCs chosen to explain the variance in the X and Y block. Table 2 Prediction of Cu2+, Cd2+ and Pb2+ in test samples using 2, 7 and 5 PCs, respectively. Concentration (actual) Concentration Analyte -1 / µmol L (predicted) / µ mol L-1 Test sample 1
Test sample 2
Cu2+
0.10
0.19
Cd2+
3.0
3.6
Pb2+
0.60
0.47
Cu2+
0.40
0.63
2+
5.0
6.5
2+
0.10
0.22
Cu
2+
0.60
0.64
Cd2+
4.0
5.6
Pb2+
0.70
0.53
Cd Pb
Test sample 3
Comparison between N-PLS and PLS-1 Until the advent of multi-way methods, when data was obtained in more than two dimensions, it was customary to unfold the data into a single vector containing all information about a given object (sample). Although this loses the correlations between different dimensions, two-dimensional PLS has been shown to be a powerful calibration method38. We calibrated the multielectrode system using PLS-1 and obtained comparable results. The standard errors of calibration for each ion were not significantly different between the two methods. This supports conclusions reached by Bro and others23.
Chow, Ebrahimi, Hibbert and Gooding
Draft 2008/09/07
16
Comparison with reported methods The method described here can be seen as complimentary to a number of stripping and data analytical approaches. Wang has shown that with under optimum conditions stripping analysis at a bare gold electrode can be effective for some combinations of metal ions (Cu2+, Hg2+)4, and screen printed graphite, with and without mercury, can also detect Cu2+, Cd2+ and Pb2+ 2. An electrode modified with peptides has two advantages. First, the choice of peptide allows enhanced selectivity which also improves sensitivity and detection limit27, and secondly, the peptide motif is a model of a bioreceptor, allowing estimation of metals that can be taken up by organisms. The N-way PLS calibration can be used with any system in which there are multianalytes and more than two data dimensions (here peptide x sweep potential), and it should provide a benefit, particularly as the systems become more complex, with overlapped signals.
Conclusions The simultaneous determination of Cu2+, Cd2+ and Pb2+ has been demonstrated using a four electrode sensor array. The results using TA-Gly-Gly-His, TA-glutathione, TAangiotensin I and TA have shown how ligands can be tuned to display a broad range of selectivities for Cu2+, Cd2+ and Pb2+. N-PLS was used for calibration and prediction of a 16 sample set with good results for Cu2+, Cd2+ and Pb2+ concentrations in the middle of the calibration and larger prediction errors for lower and higher concentrations. However, considering the extreme overlap of the voltammograms of lead and cadmium, the system has been successfully calibrated.
References 1 2 3 4 5 6 7 8
J. Wang, Stripping Analysis: Principles, Instrumentation, and Applications, VCH Publishers, Florida, 1985. J. Wang and B. Tian, 1992, 64, 1706-1709. K. B. Olsen, J. Wang, R. Setladji and J. M. Lu, 1994, 28, 2074-2079. S. Daniele, C. Bragato, M. A. Baldo, J. Wang and J. M. Lu, Analyst (Cambridge, UK), 2000, 125, 731-735. I. Palchetti, S. Laschi and M. Mascini, Anal. Chim. Acta, 2005, 530, 61-67. R. E. Williams, P. J. Holt, N. C. Bruce and C. R. Lowe, in Heavy metals, eds. U. Bilitewski and A. P. F. Turner, Harwood, Amsterdam, 2000, pp. 213-225. J. Li and Y. Lu, J. Am. Chem. Soc., 2000, 122, 10466-10467. I. Bontidean, C. Berggren, G. Johansson, E. Csöregi, B. Mattiasson, J. R. Lloyd, K. J. Jakeman and N. L. Brown, Anal. Chem., 1998, 70, 4162-4169.
Chow, Ebrahimi, Hibbert and Gooding
Draft 2008/09/07
17
9 10 11 12 13 14 15 16 17 18 19 20 21 22 23 24 25 26 27 28 29 30 31 32 33 34 35
I. Bontidean, J. R. Lloyd, J. L. Hobman, J. R. Wilson, E. Csöregi, B. Mattiasson and N. L. Brown, J. Inorg. Biochem., 2000, 79, 225-229. K. J. Albert, N. S. Lewis, C. L. Schauer, G. A. Sotzing, S. E. Stitzel, T. P. Vaid and D. R. Walt, Chem. Rev., 2000, 100, 2595-2626. R. I. Stefan, J. F. van Staden and H. Y. Aboul-Enein, Crit. Rev. Anal. Chem., 1999, 29, 133-153. D. B. Hibbert, Electroanalysis, 1998, 10, 1077-1080. P. Geladi and B. R. Kowalski, Anal. Chim. Acta, 1986, 185, 1-17. W. P. Carey, K. R. Beebe and B. R. Kowalski, Anal. Chem., 1987, 59, 15291534. Q. Chen, J. Wang, G. Rayson, B. M. Tian and Y. H. Lin, Anal. Chem., 1993, 65, 251-254. K. Murayama, K. Yamada, R. Tsenkova, Y. Wang and Y. Ozaki, Vib. Spectrosc., 1998, 18, 33-40. M. Otto and W. Wegschieder, Anal. Chem., 1985, 57, 63. G. Ragno, G. Ioele and A. Risoli, Anal. Chim. Acta, 2004, 512, 173-180. Y. Ni, P. Qiu and S. Kokot, Anal. Chim. Acta, 2004, 516, 7-17. N. W. Broad, R. D. Jee, A. C. Moffat, M. J. Eaves, W. C. Mann and W. Dziki, Analyst, 2000, 125, 2054-2058. H. Lohninger, Teach/Me Data Analysis, Springer-Verlag, Berlin, 1999. R. Bro, J. Chemom., 1996, 10, 47-62. R. Bro, Chemom. Intell. Lab. Syst., 1997, 38, 149-171. E. Chow, Aust. J. Chem., 2005, 58, 306. J. J. Gooding, D. B. Hibbert and W. R. Yang, Sensors, 2001, 1, 75-90. W. R. Yang, J. J. Gooding and D. B. Hibbert, Analyst, 2001, 126, 1573-1577. W. R. Yang, D. Jaramillo, J. J. Gooding, D. B. Hibbert, R. Zhang, G. D. Willett and K. J. Fisher, Chem. Commun., 2001, 19, 1982-1983. W. R. Yang, E. Chow, G. D. Willett, D. B. Hibbert and J. J. Gooding, Analyst, 2003, 128, 712-718. E. Chow, E. L. S. Wong, T. Böcking, Q. T. Nguyen, D. B. Hibbert and J. J. Gooding, Sens. Actuators, B, 2005, 111, 540-547. E. Chow, D. B. Hibbert and J. J. Gooding, Analyst, 2005, 130, 831-837. E. Chow, D. B. Hibbert and J. J. Gooding, Electrochem. Commun., 2005, 7, 101106. E. Chow, D. B. Hibbert and J. J. Gooding, Anal. Chim. Acta, 2005, 543, 167-176. J. J. Gooding, P. Erokhin and D. B. Hibbert, Biosens. Bioelectron., 2000, 15, 229-239. J. C. Hoogvliet, M. Dijksma, B. Kamp and W. P. van Bennekom, Anal. Chem., 2000, 72, 2016-2021. C. A. Andersson and R. Bro, Chemom. Intell. Lab. Syst., 2000, 52, 1-4.
Chow, Ebrahimi, Hibbert and Gooding
Draft 2008/09/07
18
36 37 38
E. Farkas, I. Sóvágó, T. Kiss and A. Gergely, J. Chem. Soc., Dalton Trans., 1984, 611-614. H. Aiba, A. Yokoyama and H. Tanaka, Bull. Chem. Soc. Jap., 1974, 47, 14371441. R. G. Brereton, Analytica Chimica Acta, 2000, 125, 2125-2154.
Chow, Ebrahimi, Hibbert and Gooding
Draft 2008/09/07
19
Captions for schemes
Captions for figures
Chow, Ebrahimi, Hibbert and Gooding
Draft 2008/09/07
20
Chow, Ebrahimi, Hibbert and Gooding
Draft 2008/09/07