Effective Testing and Debugging Techniques for a Group Communication System Eitan Farchi HRL, IBM Haifa, Israel
[email protected]
Gabi Kliot Technion, Haifa, Israel
[email protected]
Abstract View-oriented group communication is an important and widely used building block for constructing highlyavailable fault-tolerant systems. Unfortunately, groupcommunication based systems are extremely hard to test and debug due to a number of stateful complex algorithms deployed in parallel and the unique combination of distributed and concurrent programming paradigms that amplifies the non-determinism in the system behavior. In this work, we elaborate on the specific challenges we encountered during the process of testing DCS, a group communication component of the WebSphere (WAS) architecture, as well as on the methodology we have devised and employed in order to cope with these challenges. Our solution relies on a carefully compiled set of invariants that need to be preserved at every execution point and a log analyzer algorithm that performs cross-log verification for all the processes participating in the execution, as well as on of other techniques whose details are described in the paper.
1 Introduction View-oriented group communication is an important and widely used building block for constructing highlyavailable fault-tolerant systems. Group communication toolkits have been successfully deployed over fifteen years in mission-critical applications such as air-traffic control and handling emergency calls as well as in stock exchange and system management applications. However, being an inherently complex blend of stateof-the-art distributed algorithms with several software engineering paradigms, group communication systems are notoriously challenging to test and debug. The explosively large number of states in various algorithms that are employed in the system at the same time precludes the possibility of full state coverage. A great number of factors, such as the effect of execution timing in the operating system, hardware and software timers that are used for a variety of timeouts coupled with unpredictable latencies of message delivery, contribute to the non-deterministic system behavior that im-
Yoel Krasny, Alex Krits, Roman Vitenberg HRL, IBM Haifa, Israel {yoelk,krits,romanv}@il.ibm.com
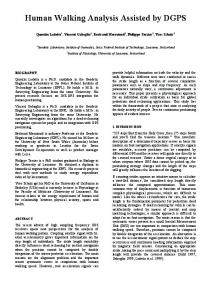
pedes system testing and debugging. Being highly concurrent, the system requires complex thread synchronization that potentially leads to elusive deadlocks and unexpected scheduling scenarios, which are hard to recreate in such a testing-hostile environment. In this work, we elaborate on the specific testing methodology we have developed and employed to address the challenges in testing DCS, a group communication component of the Java-based WebSphere (WAS) architecture. Figure 1 depicts the commonly known testing cycle. Our previous work [3] described the test generation procedure in detail. The main contribution of this paper is in the automated runtime test monitoring and post-mortem distributed log analysis that a) detect a significant portion of bugs while minimizing the manual tester involvement, and b) facilitate root cause analysis and reduce its time. In the heart of our solution lies a carefully composed set of invariants that need to be preserved at every execution point. The invariants are verified partly by the test monitor at runtime and partly at the stage of log analysis. To this end, the log analyzer performs cross-log verification of events that occur at different sites by utilizing both the real time of events and their logical timestamp. In addition, the test monitor facilitates root cause analysis by detecting deadlocks and identifying their participants. It should be noted that the problem of evaluating multiple distributed logs of programs has seen some attention in the past. Some work has been done on generating the traces in ways that have as little impact as possible on the execution timing. Others have concentrated on analyzing multiple traces looking for bug patterns. [4] provides an excellent survey of these techniques. The connection between distributed trace analysis and distributed debugging has been explored, e.g., in [6]. To create an effective solution one has to capitalize on the properties of the specific problem at hand and combine efficient trace generation with comprehensive analysis. As a result, while some of the principles remain the same (e.g. the use of the happened before relation), specific implementations tend to differ.
Test Generator
test
Test Monitor
logs
detected issue
Log Analyzer
Root Cause Analysis
bug
Developer
code fix
Figure 1. The testing process
2 The tested group communication system
Membership Application Layer Tester Layer Virtual Synchrony ▼ ↑ Underlying transport module
2.1 Background on group communication Group communication is a well-known programming paradigm for reliable many-to-many message-based communication (see, e.g., the survey in [2] for dozens of works that significantly contributed to this area). In the heart of the system lies the membership service that handles process joins and leaves while continuously monitoring connectivity of the communicating peers and maintaining views. At any given moment, a view at process p includes a) the list of all processes with which p may currently communicate, and b) a view identifier that mainly serves as an incarnation number and distinguishes between different views with the same list of members, which may occur at different points in the execution. In this paper we focus on partitionable membership service that allows co-existence of disjoint views at the same time, each view representing a different network component. In order to synchronize the views seen by different processes, the members-to-be must agree upon the view change, i.e., on both the member list and identifier of the new view. Agreement on views is also used to maintain uniqueness of view identifiers by keeping them monotonically increasing throughout the execution. In practice, group communication systems do not make view identifiers persistent (see [2] for details) so that the monotonic increase is preserved only as long as no failures occur. In addition to the membership service, group communication systems provide reliable message dissemination. Specifically, message delivery is synchronized with view change notifications so that the message is reliably delivered to all processes in the current view. The Virtual Synchrony (VS) model [1, 2] defines the synchronization semantics in a precise and rigorous way. Group communication systems allow sending messages with varying ordering and reliability guarantees that are called ordering and reliability QoS. In particular, most systems support a variety of semantics for FIFO, Causally, and Totally ordered message delivery.
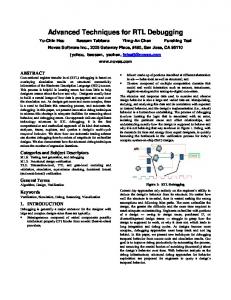
its location in the stack) whereas the bottommost layer is located directly on top of the underlying communication medium. An outgoing message is injected into the system by the application layer, propagated down through all the layers, and sent to other processes by the bottom layer. Upon reception, the message passes through the layers in the reversed order. When the stack sends or receives a message, it acquires a special lock (called DDLock) for the short duration of propagating the message through the stack layers. This lock is used in the deadlock detection mechanism described in Section 4.4. Figure 2 depicts the composition of layers in the DCS system, somewhat simplified for the sake of the presentation. The Membership layer implements the membership service by employing a view leader-based membership algorithm, the Virtual Synchrony (VS) layer is responsible for keeping the VS delivery guarantees, whereas the underlying transport module is used in order to disseminate messages to group members. The Tester layer is not part of DCS itself; it is rather added to the system as part of the testing architecture (cf. Section 4.1). The Membership layer maintains a complex internal state in order to handle Membership changes. The layer implements a four-dimensional state table (having 22×4×3×5 states), so that it has at least 1320 code paths. The Virtual Synchrony layer basically implements a state table with 14 different internal states and 16 different possible external events. Consequently, there are at least 224 code paths in the Virtual Synchrony layer. The combination of the state space across all DCS stack layers creates a very large number of different possible paths in the DCS implementation.
2.2 The general DCS architecture
3 Testing and debugging challenges
Similarly to most group communication systems, DCS employs the standard principle of a multilayered architecture: the system is built up as a stack of layers where every layer has a well-defined functionality. One of the layers represents the application (see [3] for the considerations on
The DCS implementation utilizes two programming paradigms: asynchronous message-based communication and concurrent multithreaded programming. The former has an intrinsic uncertainty in various aspects of message delivery while the latter adds a strong dependency on the
Figure 2. The layered architecture of DCS
2
JVM scheduling mechanisms in addition to those existing in the operating system. This combination, along with the use of timers, e.g., in the heartbeat-based failure detection creates a unique highly non-deterministic environment. This inherently complex nature of DCS lays the ground for potential bugs and hinders testing and debugging. We now present some of the difficulties we encountered during testing and debugging DCS. Although this paper focuses on test monitoring and log analysis (see Figure 1), we first briefly present the DCS test generation technique in order to characterize the testing and debugging environment. DCS internal modules and algorithms have a multitude of local and distributed states and allow large space of execution schedules. In order to cover the huge state space and expose rarely occurring bugs, we created an automatic random test generation engine, which brings processes up and down and sends various types of messages. Both the selected test operation (whether to bring up a new process or to kill an existing process) and the timing of that operation are random. Using a coverage tool, we have learned that the random test generation has a high probability to cover a substantial part of the state space if employed over long time (see [3] for details). Challenges in analyzing large distributed logs: The DCS random test generation technique creates a very large amount of traces over long time, which renders human analysis infeasible. Moreover, the produced traces may be dispersed over hundreds of participating processes because DCS supports large-scale clusters. Forming a unified global picture out of multiple distributed traces requires identifying corresponding events in different logs, which is challenging in an asynchronous environment. Challenges in debugging deadlocks: As a highly multithreaded system, DCS is prone to deadlocks. Some factors raise the probability of deadlocks in DCS: (1) DCS is committed to high-throughput messaging, hence it encourages concurrency among threads whenever possible, which requires complex thread synchronization mechanisms; (2) DCS interacts with the application on one hand and the transport module on the other. Since these two parties have different threading models, the risk of deadlocks is increased; (3) Using asynchronous message-passing exposes DCS to deadlocks that involve both locks on data items and cross-waits between the threads. For example, it may happen that one thread holds a lock and waits for a message to be received in order to release that lock. However, the thread supposed to deliver this message waits for the lock being held. If a deadlock occurs during the test yet the test completes and terminates, it is quite hard to detect that a deadlock has occurred during the test. Even if a deadlock has been discovered, it is still hard to pinpoint the problem based on the debugging traces.
Challenges in defining “correctness” of test results: After running a DCS test, the tester should be able to answer a fundamental question, namely, whether the test succeeded. Doing so requires to define correctness criteria. However, it is well-known that in the area of group communication, desirable properties can be elusive and some of them are only “best-effort”. Challenges in verifying messaging guarantees: It is possible to test and debug the DCS QoS messaging guarantees by writing specific tailored tests that track the number and order of messages sent and received by the cluster processes (see [3] for an example of testing the VS QoS). However, we are interested in verifying the messaging QoS guarantees of DCS not only in a specific test but also in all other tests that we and other testing teams run. Another difficulty is that logging each individual message send or reception is discouraged because of performance restrictions.
4 Testing and Debugging solution The goal of the testing and debugging tool we are going to present is to verify correctness of the DCS implementation and to assist in detecting and analyzing its bugs. The tool aims at maximally automating the tasks of test monitoring and log analysis as well as facilitating root cause analysis while striving to surmount the challenges presented in Section 3. In addition, our implementation is guided by the following design principles: • The testing system should be able to monitor all significant events that occur during the run. • It should have no semantic and minimal performance impact on the stack behavior. • It should ideally be able to analyze a bug as it occurs and capture as much relevant information as possible without recreating the bug at a later stage. This is because some DCS bugs are virtually impossible to recreate in a controlled way as they depend on a very specific event scheduling.
4.1 The Tester layer In order to implement test monitoring, we have chosen to add a Tester layer into DCS (see Figure 2). This layer does not initiate sending new messages but merely observes all messages and events passed through the stack and verifies the correctness of DCS operation as defined later in this section. The Tester layer is placed just below the application layer in the stack, thus observing the same group communication guarantees as the application.
4.2 Local and distributed execution invariants We tackle the problem of verifying correctness of the test outcome (as described in section 3) by capturing the most salient properties that every legal output must maintain. Our testing suite focuses on verifying that those invariants are preserved at any given moment of the execution. 3
From the verification point of view, invariants can be classified as either local or distributed. While local invariants may be verified by looking at the local execution of each individual process, preservation of distributed execution invariants may only be confirmed by cross-matching executions of different processes in the system. Consequently, local execution invariants are much easier to verify online without interfering with the system operation and imposing significant performance overhead. A characteristic example of a local invariant in our testing system is “view identifiers are monotonically increasing in absence of process crashes”. Checking local invariants online imposes no substantial communication or computation burden on the process. If we had opted for offline verification instead, we would have had to log a lot of additional information thereby inflating the traces and incurring significant overhead.
Assuming no additional failures occurred, the scenario represents a counter-intuitive situation in which A and B establish a separate view each rather than a single common view, as we would expect it to happen. The situation is mended afterwards since A and B eventually establish a view together. However, this short period of time when they establish separate views, could potentially signify an implementation bug. We call such a situation “unjustified split event”. The next section shows how the log analyzer operates in this scenario. 4.3.1 Distributed log analyzer After a system run, the log analyzer gathers all logs, extracts all relevant log entries, reconstructs a global execution of the system, builds helper data structures, and invokes various post-mortem checkers to verify that the aforementioned distributed invariants are preserved. By extracting only small amount of relevant information from all log files and checking the maintenances of DCS invariants based on this information, the log analyzer solves the problem of large amount of available distributed information that is hard to interpret (as explained in Section 3). Automatic analysis of the gathered information relieves the developer from the burden of interpreting and manually analyzing the traces. The post-mortem checking system finds a violation of the invariants, it supplies the developer with sufficient information to facilitate root cause analysis. The main challenge of reconstructing consistent global history is to correlate multiple log events from different logs. Log analyzer deals with the correlation problem by combining two approaches: logical clocks [5] and real clocks. Logical clocks are a standard technique for establishing correspondence and capturing the partial “happened before” order between distributed events. Their use for DCS is particularly facilitated by the fact that view identifiers (natively supported by group communication systems) essentially represent logical clocks for view-related events as long as processes do not crash. However, group communication systems do not maintain monotonic increase of view identifiers in face of process crashes, as explained in Section 2.1. Furthermore, there is still a need to implement logical clocks for events other than view installations, which may not be necessarily traceable by the testing system in a non-intrusive way. On the other hand, real clocks are inherently persistent and events can be easily tagged with them without introducing extra communication or computation overhead. Moreover, most implementation components not controllable by the test monitor autonomously log the time at which the most important events occur. Of course, it is commonly known that capturing the order of events based solely on real clocks is impossible to do reliably because of clock skew between different processes.
4.3 Distributed invariants Here are the most significant distributed invariants that DCS should maintain during its operation: (1) Membership layer guarantees: all view members agree on the same view members, id, and leader. Verification of this property provides an indication whether the occurred chain of view changes is legal or not. (2) Virtual synchrony, reliable delivery and Self-delivery guarantees - see Section 2.1. (3) Eventual process join and removal: If a new process has connected/disconnected to/from a group, a new view that includes/excludes this member is eventually established. In order to verify these invariants, we need to correlate and analyze events that occur at different processes. As constructing a distributed snapshot during the run changes the timing and imposes performance overhead, the testing system verifies distributed invariants by analyzing the logs after the test is completed. This post-mortem log analysis is done based on the information that the Tester layer records into the log file. While still non-trivial, the analysis is facilitated by the fact that group communication systems inherently use logical timestamps for certain events. Let us consider an example of a global event sequence that occurred in one of our tests. This example will be used throughout the paper to demonstrate the elements of our solution. • Members A, B, C are together in view with view id=100. There is a corresponding entry in the log of each member, which describes the view id, leader and members. • C crashes. As a result, A establishes a view with view id=101, view leader A, and no additional members. B establishes a view with view id=101, view leader B, and no additional members. • A and B establish a view with view id=102, view leader A and members A and B. Figure 3 depicts all relevant log entries for this scenario. 4
For member B: [19/09/04 22:49:20:560] Event: View (100:0.A) members [A B C] [19/09/04 22:49:22:560] Event: View (101:0.B) members [B] [19/09/04 22:49:24:560] Event: View (102:0.A) members [A B]
For member A: [19/09/04 22:49:20:260] Event: View (100:0.A) members [A B C] [19/09/04 22:49:22:260] Event: View (101:0.A) members [A] [19/09/04 22:49:24:260] Event: View (102:0.A) members [A B]
Figure 3. Log entries for the unjustified split example. Log analyzer employs both techniques to accomplish cross-log correlation. It is assumed that logical timestamps themselves are computed correctly by the DCS system (in fact, there is a local invariant that partly verifies their correctness). The analysis consists of two phases: in the first phase, the analyzer correlates only events in different logs that are tagged with both logical and real time (these are events related to view installations in our current implementation). The analyzer makes a single simultaneous scan over the logs of all processes in the execution and attempts to merge them: once a correlation for a single global event is found (typically a single corresponding event from each relevant log), the analyzer proceeds to search correspondence for the next global event. More specifically, correspondence is established based on logical timestamps as long as the real time difference does not exceed the maximal assumed clock skew (typically a few minutes). In the rare case that there exist several different views with the same view identifier within the clock skew, we employ additional sanity checks for resolving the conflict. Based on the gathered information, the log analyzer builds a view graph, which represents a global (rather than per-process) evolution of views in the system. Every node in this graph corresponds to a view whereas an edge between views V1 and V2 signifies that there is a process that establishes V1 and then V2 in a succession. Figure 4 depicts the view graph for the unjustified split example, which is constructed based on the log entries in Figure 3. Section 4.3.2 explains how this graph is used afterwards in post-mortem checks in order to find the problem.
View (A.101:0) members A
View (A.100:0) members A,B,C View (A.102:0) members A,B
every view node: (1) Each process that is reported as a view member by other processes, has a log record that corresponds to this view; (2) The above mentioned VS and reliable delivery guarantees; (3) Various test-related checks. For instance, the unjustified split in the above example should not have occurred in that particular test. In order to detect such split events, we introduce a test-specific check that there be at most a single outgoing edge from every node in the graph. When such a post-mortem check detects a problem, the developer will be supplied with all relevant information available in the logs: description of the problematic event, view number and names of the members involved, exact time of its occurrence at each participating member, lines in the log file from which the relevant log entries were extracted, etc. Afterwards, this information will be efficiently used in root cause analysis. An important trait of the post-mortem analyzer is that it is not tightly coupled with the specific DCS implementation and events. In fact, it may be used by any group communication system that logs sufficient view membership information (view id, view leader, view members and real time) and provides an appropriate log parser. Post-mortem analyzer already supports additional types of logs, such as the standard WAS logs, which include only a small part of DCS log events. This allows WAS system administrators to use it as an external tool at a client site.
4.4 Concurrency-related debugging techniques One of the most important tasks in our tests was deadlock elimination. This is by no means a trivial task in the multi-component environment of DCS, as explained in Section 3. When searching for the solution, we noticed that both SUN and IBM JDKs have a useful feature of detecting deadlocks during the JVM core dump, which can be triggered by sending a signal to the JVM process. Unfortunately, this is an extremely costly operation, which we could not afford to invoke periodically in a production release. In DCS, it is employed in conjunction with our own watchdog-based deadlock-detection mechanism (WDD), which is much more efficient but imprecise as it may raise false suspicions. When WDD suspects that a deadlock has occurred, it sends a signal to the JVM that records all the relevant information into the trace file. The WDD mechanism is based on a pair of timestamps and an independent watchdog thread that runs in parallel with the other threads in the system. The first timestamp
View (B.101:0) members B
Figure 4. View graph for the example. Once correspondence for view-related events is established, the analyzer starts the second phase and attempts to verify the correctness of all other events. This is done by separately considering each group of events that are enclosed by the preceding and succeeding view-related events. 4.3.2 Post-mortem checks Once the view graph is built, various post-mortem checks are executed on it. The following should hold for 5
(TS1) is updated by the DCS self-checking mechanism that periodically obtains the DDLock (recall from Section2.2 that this lock is obtained by the stack to propagate the message through its layers) and updates TS1.1 Deadlock in the system, which involves the DDLock, would make these periodic updates impossible. The second timestamp (TS2) is periodically updated by a watchdog thread. The watchdog thread checks when both timestamps were previously updated. If both timestamps have been recently updated, this thread does nothing. Otherwise, one of two cases could happen: 1. The watchdog timestamp (TS2) has not been updated for a considerable period of time. Since the watchdog thread does not obtain any lock, the only reason for not updating its timestamp is a JVM “freeze”, i.e., the user threads of the JVM do not get an adequate CPU time slice for a considerable period of time. In this case the watchdog thread issues a warning about a possible JVM freeze. 2. The watchdog timestamp (TS2) has been recently updated, but the self-checking timestamp (TS1) has not been updated for a considerable period of time. The fact that the watchdog thread succeeded to update its timestamp excludes the possibility of a JVM freeze, so the only obstacle that prevents the self-checking thread to update its timestamp is a continuous failure to obtain the lock. This situation typically implies that the system ran into a deadlock. The biggest advantage of this mechanism is that it eliminates the need to recreate deadlocks. Once a bug occurs during the test run, all the information needed for the developer to solve the problem is logged. Furthermore, the overhead of this mechanisms in term of runtime is less than one percent for the most frequently used code paths.
tool, manual examination of the night test results was taking frustrating four hours of two testers on average. Faster root cause analysis: using the testing suite significantly reduced the average time from the point a problem was exposed until the point the root cause was determined. This is attributed to the facilitating tools that the tester suite provides for the developer. In particular, it required an average of two days to pinpoint a deadlock problem without the testing suite, whereas with the testing tool, this task was usually achieved in less than two hours. During the last year we exposed 9 deadlocks in our system so that the testing suite saved us about two weeks of root cause analysis over that period. Consequently, the testing suite significantly enhanced the efficiency of our testing procedure. The automatic analysis of the test results enabled us to run more tests and find more bugs, some of which would not have been exposed without the tool. An indication for this is that the number of bugs exposed using our testing suite during the last year (about 190) was more than twice than the number of bugs exposed during external tests (about 85), which were conducted by several testing teams. In addition, faster root cause analysis allowed us to increase the rate of bug fixing, so that the overall number of bugs exposed and fixed in the system significantly increased. In the future, we will endeavor to generalize some of the techniques we have employed to render them applicable beyond the scope of the specific tested system. In particular, the view-based synchronization described in Section 4.3.1 bears the potential to be useful in any application that includes a group membership service. Acknowledgements: We would like to thank Eliezer Dekel, Gera Goft, Dean Lorenz, Shmuel Ur, and Alan Wecker for their contribution to the testing solution and their comments that helped us improve the paper.
5 Conclusions Using the testing suite significantly improved the testing quality and the overall code quality of DCS. From the standpoint of the testing process as presented in Figure 1, this work contributed to the test monitoring, log analysis, and root cause analysis:
References [1] K. Birman and T. Joseph. Reliable Communication in the Presence of Failures. ACM TOCS, 5(1):47–76, 1987.
Early detection of costly elusive bugs: the test monitor exposed bugs such as non-deterministic deadlocks and violation of the message delivery guarantees, that would be very costly to analyze and fix once reported in a production environment. This is attributed to the ability of the tester layer to perform checks “under the cover” and thereby expose bugs that have no external symptoms during the run.
[2] G. Chockler, I. Keidar, and R. Vitenberg. Group communication specifications: a comprehensive study. ACM Computing Surveys, 33(4):427–469, 2001. [3] E. Farchi, Y. Krasny, and Y. Nir. Automatic Simulation of Network Problems in UDP-Based Java Programs. In IPDPS’04, page 267, Apr. 2004. [4] J. Kundu. Integrating event- and state-based approaches to the debugging of parallel programs. PhD thesis, 1996.
Minimizing test results analysis time: the distributed log analyzer provides the ability to determine in a matter of seconds whether a long test, created by our test generator, completed successfully. This is attributed to the operation of the automatic post-mortem checkers. Without this 1 This
[5] L. Lamport. Time, Clocks and the Ordering of Event in a Distributed System. CACM, 21(7):558–565, 1978. [6] S. Shende, J. Cuny, L. Hansen, J. Kundu, S. McLaughry, and O. Wolf. Event and state-based debugging in TAU: a prototype. In SIGMETRICS, pages 21–30. ACM Press, 1996.
thread also responsible for the DCS layers health check.
6