ISSN 1392–1320 MATERIALS SCIENCE (MEDŽIAGOTYRA). Vol. 11, No. 2. 2005
Effects of Electrodeposition Periods and Solution Temperatures Towards the Properties of CdS Thin Films Prepared in the Presence of Sodium Tartrate Kassim ANUAR1∗, Zainal ZULKARNAIN1, Nagalingam SARAVANAN2, Muhammad NAZRI1, Razak SHARIN1 1
Department of Chemistry, Faculty of Science, University Putra Malaysia, 43400 Serdang, Selangor, Malaysia Faculty of Engineering and Science, University Tunku Abdul Rahman, Setapak, 53300 Kuala Lumpur, Malaysia
2
Received 06 August 2004; accepted 19 March 2005 Cathodic electrodeposition in the presence of tartrate ions as complexing agents in aqueous solution was used to prepare cadmium sulfide thin films deposited on titanium substrates. The effect of deposition periods and solution temperatures towards the crystallinity of the cadmium sulfide thin films were investigated. The thin films were characterized using X-ray diffractometry. The absorption properties, band gap energy and transition type was determined using UV-Vis Spectrophotometry. The thin films produced were polycrystalline in nature. The films showed good adherence towards the substrate in the presence of sodium tartrate. The band gap value was found to be 2.3 eV with direct transition. Keywords: CdS, thin films, electrodeposition, complexing agent, metal chalcogenide.
1. INTRODUCTION∗
of the films deposited. The use of additives in aqueous electroplating method is extremely important. The presence of complexing agents in the solution during the electrodeposition process of metal chalcogenide thin films was found to improve the lifetime of the deposition bath as well as the adhesion of the deposited film on the substrate [17]. In this paper we report the effects towards the CdS thin film properties prepared by varying the deposition periods and solution temperatures.
The II-VI semiconducting compounds, especially the cadmium chalcogenides have been extensively studied due to their potential applications, in semiconductor device technology and solar cells [1 – 5]. Metal-insulatorsemiconductor type solid-state solar cells based cadmium chalcogenide systems are known to yield respectable efficiencies. Solar cells from cadmium chalcogenide single crystals are very expensive; therefore the use of polycrystalline metal chalcogenide thin film is a desirable alternative for cost reduction [6]. Cadmium sulfide (CdS) film is a n-type material which has shown the potential to be used as a window material in the photovoltaic solar cells, electrochromic devices and display screens [7]. Thin-film research is extensively carried out as a mean of substantially reducing the cost of photovoltaic (PV) or photoelectrochemical (PEC) systems. The rationale for this is that thin-film products are cheaper to manufacture owing to their reduced material, energy, handling and capital costs [8]. Reduction of cost for the thin film cells is achieved by minimization of the amount of material used, the possibility of inexpensive materials, processing methods and the use of inexpensive mounting arrays [9 – 11]. Several methods such as vacuum evaporation, screen-printing, spray pyrolisis, chemical bath deposition and electrodeposition have been employed for the preparation of cadmium chalcogenide thin films. Electrodeposition is a perspective competitor in thin film preparation because of several advantages such as the possibility for large-scale production, minimum waste of components and easy monitoring of the deposition process [12 – 16]. This technique is generally less expensive than those prepared by the capital-intensive physical methods. The composition of the electrolytes and deposition condition play an important role in determining the quality
2. EXPERIMENTAL PROCEDURE Electrodeposition was performed in a conventional three-electrode cell. Ag/AgCl was used as the reference electrode to which all potentials were quoted. An Elchema model PS-605 potentiostat was used to control the electrodeposition process and to monitor the current and voltage profiles. The working and counter electrodes were made from titanium (Ti, 99.99 %) and platinum, respectively. The Ti substrates and counter-electrode was polished and cleaned with distilled water before the deposition process. The deposition process was carried out at –0.800 V by varying the deposition periods (15, 30, 45, 60 and 75 minutes) and solution temperatures (15, 27, 40 and 60 °C). The bath consists of Cd-tartrate complex (0.05 M) and Na2S2O3 (0.05 M). The pH of the bath was maintained at 2.5. The solutions were prepared using analytical grade reagents and deionised water (Alpha-Q Millipore). The substrate area to be deposited was fixed at 0.75 cm2. Nitrogen gas was flowed into the solutions prior to mixing to remove any dissolved O2. Immediately after deposition, the deposits were tested for adhesion by subjecting it to a steady stream of distilled water. XRD analysis was performed using a Shimadzu XRD-6000 Diffractometer for the 2θ ranges from 2° to 60° with CuKα (λ = 1.5418 Å) radiation. The absorption properties of the film were analyzed using Perkin Elmer Lamda 20 UV-Vis Spectrophotometer. The CdS film was deposited for
∗
Corresponding author. Tel.: +603-89466779; fax.: +603-8943580. E-mail address:
[email protected] (K. Anuar)
101
Table 1. Comparison between theoretical d-spacing data and experimentally observed values for films deposited at different periods (Bath temperature: 27 °C)
45 minutes at room temperature using indium doped tin oxide (ITO) glass substrate. The film-coated ITO glass was placed across the sample radiation pathway while the uncoated ITO glass was put across the reference path. The data obtained from the film was used to determine the band gap energy and the transition type of the semiconductor film
Deposition period (minutes)
3. RESULTS AND DISCUSSIONS
15
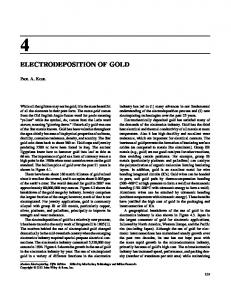
Figure 1 shows the XRD plot of CdS thin films deposited at different deposition periods. Upon 15 minutes deposition time, the XRD data indicated presence of two peaks at 2θ = 35.5° and 53.3° corresponding to orientation along (102) and (201) planes of CdS. The high intensity of the substrate peak (Ti) compared to the compound peak shows that the film thickness is low due to insufficient deposition time. As the deposition time was increased to 30 minutes, additional peak corresponding to (110) plane at 2θ = 43.9° was obtained. The highest peak corresponds to the orientation along (102) plane. The obtained dspacing values corresponds well the standard Joint Committee on Powder Diffraction Standard data (File No: 06-0314) (Table 1). When the deposition time was increased to 45 minutes, the intensity of the CdS peaks was higher than the substrate indicating more material deposition. The XRD results obtained indicated that the films were polycrystalline in nature. The films deposited for this period was smooth and adhered well towards the substrate. However when the deposition time was increased to 60 minutes and above, the presence of additional peaks, which does not correspond to CdS, was obtained. This is phenomenon may occur due to codeposition of elemental materials due to long immersion time in the deposition bath.
30
45
60
75
2θ (°)
d-spacing (Å) Obtained value
JCPDS value
hkl
35.5
2.5
2.5
102
53.3
1.7
1.7
201
35.4
2.5
2.5
102
43.9
2.0
2.0
110
53.1
1.7
1.7
201
35.6
2.5
2.5
102
43.9
2.0
2.0
110
53.4
1.7
1.7
201
35.6
2.5
2.5
102
43.9
2.0
2.0
110
53.1
1.7
1.7
201
35.4
2.5
2.5
102
43.9
2.0
2.0
110
53.2
1.7
1.7
201
Moreover, the XRD peak due to compound formation for the film deposited beyond 60 minutes indicates reduction in peak intensity. This confirms the very thin layer of film adhered over the substrate. This observation happens when there is an increase in the amount of materials deposited onto the substrate. The amount deposited however could not adhere well on the surface of the substrate and peels off into the solution. The grain diameter, D, of the deposit was determined using the Scherrer’s formula corresponding to the (102) plane [18, 19]: D=
Kλ , ω cos θ
(1)
where λ is the wavelength of X-rays, θ is the Bragg angle and ω is the full width at half maximum in radian. K varies with (hkl) and crystallite shape but usually nearly equal to 0.9. The variation of crystallite size with deposition is shown in Figure 2. The results indicated an increase in the grain diameter as the deposition time was increased from 15 (19.5 nm) to 45 minutes (21.6 nm). However the grain diameter decreased to 15.34 nm at 60 minutes deposition time. At longer deposition period, the grain formed could have dissolved into the bath due to the longer immersion time in the acidic medium. Apart form that deposition of elemental materials over long deposition time could also hinders the steady growth of CdS crystallites over the substrate. Figure 3 shows the XRD plot of CdS thin films deposited under different solution temperatures. At low temperature (15 °C), the intensity of the compound peaks is rather low compared to the substrate peak indicating formation of very thin layer of film. Four peaks corresponding to (102), (110), (103) and (004) planes were
Fig. 1. XRD plot of cadmium sulfide thin films deposited at different periods; titanium (Ti)
102
makes it possible for this material to be used in a photoelectrochemical cell or as semitransparent layer in high-speed detectors working in visible range.
22
21
Grain diameter (nm)
20
19
60 °C
18
Intensity (arbitary units)
17
16
15 10
20
30
40
50
60
70
Deposition time (min)
Fig. 2. Grain diameter versus deposition time for CdS thin films
40 °C
27 °C
obtained. The XRD data obtained for the film deposited at room temperature (27 °C) indicate higher peak intensities supporting the fact that compound formation is much favoured at room temperature. As the solution temperature was increased to 40 and 60 °C the peaks attributable to CdS compound formation were of lower intensity compared to the substrate peaks. Additional peaks not related to the CdS compound were also detected suggestion co deposition of elemental material at these temperatures. Fig. 3. XRD plot of cadmium sulfide thin films deposited at different solution temperatures; titanium (Ti)
Table 2. Comparison between theoretical d-spacing data and experimentally observed values for films deposited at different solution temperatures (deposition time: 45 minutes) Solution temperatures (°C)
15
27
40
60
2θ (°)
d-spacing (Å) hkl
Obtained value
JCPDS value
35.1
2.5
2.5
102
43.9
2.0
2.0
110
48.2
1.8
1.8
103
53.2
1.7
1.7
201
35.4
2.5
2.5
102
43.9
2.0
2.0
110
53.1
1.7
1.7
201
35.6
2.5
2.5
102
43.9
2.0
2.0
110
48.4
1.8
1.8
103
53.4
1.7
1.7
201
35.2
2.5
2.5
102
44.0
2.0
2.0
110
Band gap energy and transition type was derived from mathematical treatment of the data obtained from the optical absorbance vs. wavelength with the following relationship for near-edge absorption:
48.2
1.8
1.8
103
A = [k(hν – Eg)n/2] / hν
53.2
1.7
1.7
201
Wavelength, nm
Fig. 4. Absorbance versus wavelength properties of the CdS thin film deposited on ITO glass
(2)
where ν is the frequency, h is the Planck’s constant, k equals a constant while n carries the value of either 1 or 4. Figure 4 shows the plot of (Ahν)2/n as a function of hν of the film prepared at 2 hours. The bandgap, Eg, could be obtained from a straight line plot of (Ahν)2/n as a function
The optical absorbance of the as-deposited CdS thin film is shown in Figure 4. The spectrum shows a gradually increasing absorbance throughout the visible region, which
103
4. 12
10
5.
(Ahv )2/n
8
6. 6
4
7.
2
8. 0 0
0.2 0.4 0.6 0.8
1
1.2 1.4 1.6 1.8
2
2.2 2.4 2.6 2.8
3
3.2 3.4 3.6 3.8
4
hv (eV)
9.
Fig. 5. (Ahv)2/n versus hv of the CdS thin films deposited on ITO glass
10.
of hν. Extrapolation of the line to the base line, where the value of (Ahν)2/n is zero, will give Eg. If a straight-line graph is obtained for n = 1, it indicates a direct electron transition between the states of the semiconductor, whereas the transition is indirect if a straight line graph is obtained for n = 4. A linear trend is apparent where n in the relationship (2) equals 1. The straight-line behavior in this Figure 5 testifies a direct transition of the band structure. The line segments required to by pass the energy of the gap lies at about 2.30 eV for the CdS film.
11.
12.
13.
4. CONCLUSION
14. Sato, N., Ichimura, M., Arai, E., Yamazaki, Y. Characterization of Electrical Properties and Photosensitivity of SnS Thin Films Prepared by the Electrochemical Deposition Method Sol. Energy Mater. Sol. Cells (in press).
CdS thin films deposited in the presence of sodium tartrate are smooth and well adhered towards the substrate. The films were found to be polycrystalline in nature. Deposition for 45 minutes under room temperature is the optimum condition to prepare quality CdS thin films under the current condition. The film exhibits direct transition with an energy gap of about 2.30 eV.
15. Zainal, Z., Saravanan, N., Anuar, K., Hussein, M. Z., Mahmood, W. M. M. Effect of Annealing on the Properties of Tin Selenide Thin Films Sol. Energy Mater. Sol. Cells 81 2004: pp. 261 – 268. 16. Zainal, Z., Ali, A. J., Anuar, K., Hussein, M. Z. Electrodeposition of SnSe Thin Film Semiconductor: Effect of the Electrolytes Concentration on the Film Properties Sol. Energy Mat. Sol. Cells 79 2003: pp. 125 – 132.
Acknowledgments The authors would like to thank the Department of Chemistry, Universiti Putra Malaysia for the provision of laboratory facilities.
17. Zainal, Z., Saravanan, N., Anuar, K., Hussein, M. Z., Yunus,W. M. M. Chemical Bath Deposition of Tin Selenide Thin Films Mater. Sci. Eng. B 107 2004: pp. 181 – 185. 18. Padiyan, D. P., Marikani, A., Murali, K. R. Influence of Thickness and Substrate Temperature on Electrical and Photoelectrical of Vacuum-Deposited CdSe Thin Films Mater. Chem. Phys. 78 2002: pp. 51 – 58. 19. Saaminathan, V., Murali, K. R. Nano Cd(Se, Te) Thin Films Prepared by Pulse Plating Technique Solid State Ionics 2002: pp. 857 – 862.
REFERENCES 1.
2.
3.
Soliman, M., Kashyout, A. B., Shabana, M., Elgamal, M. Preparation and Characterization of Thin Films of Electrodeposited CdTe Semiconductors Renewable Energy 23 2001: p. 471 – 481. Sharma, R. K., Singh, G., Rastogi, A. C. Pulsed Electrodeposition of CdTe Thin Films: Effect of Pulse Parameters over Structure, Stoichiometry and Optical Absorption Sol. Energy Mater. Sol. Cells 82 2004: pp. 201 – 215. Swaminathan, V., Subramanian, V., Murali, K. R. Characteristics of CdSe Films Electrodeposited with Microprocessor Based Pulse Plating Unit Thin Solid Films 359 2000: pp. 113 – 117. Cui, H. N., Teixeira, V., Meng, L. J., Zhang, H. J. Studies on Microstructure Bilayer Film of Ultrasonic Dipped Cadmium Sulfide and d.c. Sputtered Indium Tin Oxide Thin Solid Films 447 – 448 2004: pp. 663 – 668. Zweibel, K. Thin Film PV Manufacturing: Materials Costs and Their Optimization Sol. Energy Mater. Sol. Cells 63 2000: pp. 375 – 386. Moss, T. S. Handbook Of Semiconductor. Elsevier NorthHolland Inc., New York, 1981. Calixto,M. E., Sebastian, P. J. Depth Profile Analysis of CuInSe2 Thin Films Grown by the Electrodeposition Technique Sol. Energy Mater. Sol. Cells 63 2000: pp. 335 – 345. Bhattacharya, R. N. Electrodeposited CdSe0.5Te0.5: Photoelectrochemical Solar Cells J. Appl. Electrochem. 16 1986: pp. 168 – 174. Chandramohan, R., Mahalingam, T., Chu, J. P., Sebastian, P. J. Preparation and Characterization of Sol. Energy Semiconducting Zn1-xCdxSe Thin Films Mater. Sol. Cells (in press). Anuar, K., Zainal, Z., Hussein, M. Z., Saravanan, N., Haslina, I. Cathodic Electrodeposition of Cu2S Thin Film for Solar Energy Conversion Sol. Energy Mater. Sol. Cells 73 (4) 2002: pp. 351 – 365.
Mathew, X., Thompson, G. W., Singh, V. P., McClure, J. C., Velumani, S., Mathews, N. R., Sebastian, P. J. Development of CdTe Thin Films on Flexible Substrates. A Review Sol. Energy Mater. Sol. Cells 76 2003: pp. 293 – 303. Kutzmutz, S., Lang, G., Heusler, K. E. The Electrodeposition of CdSe from Alkaline Electrolytes Electrochimica Acta 47 2001: pp. 955 – 965. Shen, C., Zhang, X., Li, H. Effect of pH on the Electrochemical Deposition of Cadmium Selenide Nanocrystal Films Mater. Sci. Eng. B84 2001: pp. 265 – 270.
104