Int. J. Electrochem. Sci., 6 (2011) 2632 - 2651 International Journal of
ELECTROCHEMICAL SCIENCE www.electrochemsci.org
Electrodeposition of Copper from Non-Cyanide Alkaline Solution Containing Tartrate J.C. Ballesteros1, E. Chainet2, P. Ozil2, Y. Meas1,* and G. Trejo1,* 1
Centro de Investigación y Desarrollo Tecnológico en Electroquímica (CIDETEQ), Parque Tecnológico Sanfandila, Pedro Escobedo, Querétaro, C.P. 76703 Querétaro, México 2 Laboratoire d’Electrochimie et de Physicochimie des Matériaux et des Interfaces, LEPMI, UMR 5631 CNRS-INPG-UJF, BP 75, 38402 Saint-Martin d’Heres Cedex, France * E-mail:
[email protected];
[email protected]
Received: 26 April 2011 / Accepted: 30 May 2011 / Published: 1 July 2011
A thermodynamic study of the aqueous copper(II)-tartrate-chloride system is presented in this work with the view to better understand the electrodeposition of copper from a non-cyanide alkaline solution. Additionally, an electrochemical study onto the initial stages of copper electrodeposition on glassy carbon electrode (GCE) is presented in this work. Upon scanning in the negative direction, two cathodic peaks were observed, which are associated with two reduction processes with different energies that involve the same species of copper (II). Analysis of chronoamperograms obtained indicates that the nucleation mechanism involved during the initial stages of Cu deposition is consistent with the model of 3D diffusion-controlled nucleation. The morphological study indicated that the potential plays a role on grain size and shape of the copper coating obtained. Non-linear fitting methods were applied to obtain the growth and nucleation kinetic parameters from theoretical equations proposed to describe this system.
Keywords: Electrodeposition, copper, glycine, alkaline non cyanide, kinetic parameters
1. INTRODUCTION Electrodeposition of copper from alkaline cyanide solutions have been widely used for industrial level production of coatings of high quality. Cyanide copper plating is used throughout the metal finishing industry for many applications, although not as extensively today as in the 1970s because of environmental issues [1]. Site contamination, worker safety considerations, and high waste treatment and reporting costs are some drawbacks. Alkaline noncyanide copper-plating solutions have found increasing popularity since mid-1980s because of environmental issues [1]. Disadvantages include higher operating costs, difficulty in using the process on zinc die castings, greater sensitivity to
Int. J. Electrochem. Sci., Vol. 6, 2011
2633
impurities, and a chemistry more difficult to control [1]. In recent years a large amount of research has been realized around the world and different alternatives have been proposed, such as: fluoborate, pyrophosphate, EDTA, citrate, ammonia, ethylenediamine, glycerol, glycine and tartrate, etc. [1-3]. The tartrate ion ( ) has been used as a complexing agent in the electrodeposition of copper and copper alloys. These studies show that the deposits obtained from these solutions containing tartrate are of high quality [4,5] Despite these many important contributions to the study of electrochemical reduction of copper–tartrate complexes, a detailed analysis on the nucleation and growth mechanism of copper is still not done. The aim of the present work is three-fold. In a first part, we present a thermochemical study on the copper-tartrate-chloride-water system by means of species distribution diagram and determination of the equilibrium potential for the redox couple Cu(II)/Cu(0) with the view to better understand the effect of the different parameters on the deposition process. In a second part, we present an electrochemical study in order to obtain the growth and nucleation kinetic parameters of the copper electrodeposition. Finally, in a third part, we present a morphological study of the copper coatings obtained.
2. EXPERIMENTAL The electrochemical study of the reduction of Cu (II) ions in the presence of tartrate was carried out in a conventional three-electrode cell from the solution S1 of chemical composition: 0.1 M CuCl2 + 1.0 M KCl + 0.3 M KC4H5O6 at pH 10. All solutions were prepared using analytic grade reagents (provided by Sigma-Aldrich Company) with ultra pure water (Millipore-Q system) and were deoxygenated by bubbling Ar for 20 minutes before each experiment. The working electrode was a glassy carbon disk, made of a glassy carbon rod embedded in Teflon. The exposed surface area (0.0707 cm2) was polished to mirror finish with different grades of alumina down to 0.05 μm and ultrasonically cleaned before experiments. A graphite bar with an exposed area greater than the working electrode was used as counter electrode. A saturated calomel electrode (SCE) was used as reference, and in this work all potentials are refer to this scale. The electrochemical experiments were carried out with a potentiostat/galvanostat PAR273A (EG&G) connected to a personal computer running the general purpose electrochemical system software Power Suite for control of experiments and data acquisition. The conditions for electrochemical experiments are chosen in where the ohmic drop is considered negligible. Copper coatings on GCE were obtained and this was realized in order to evaluate the quality and morphology of these deposits. The solution temperature was controlled and made constant with a circulating water thermostat (Bioblock Scientific). Coating morphology, such as shape and size, was evaluated using a scanning electron microscope (Jeol mod. DSM-5400LV). The kinematic viscosity of the solution was measured on a capillary viscosimeter (SchottGerräte GmbH) baring a capillary tube (538.10, Schott) at 25°C. The viscosity measurement consists of the determination of the time for a solution to flow through the capillary tube. The uncertainty in the flow time measurement is estimated to be 0.01 s. This little value leads to a relative standard
Int. J. Electrochem. Sci., Vol. 6, 2011
2634
uncertainty of less than 0.01% in the viscosity measurement and can therefore be neglected. The experimental kinematic viscosity values obtained are the average of ten successive measurements of the flow time. The obtained value was 0.0094 0.0003 cm2 s-1 at 25°C.
3. RESULTS AND DISCUSSION 3.1. Copper-glycine chemistry There is a well-defined aqueous chemistry of Cu2+, and a large number of salts of various anions, many of which are water soluble, exist in addition to a wealth of complexes. The aqua ion [Cu(H2O)6]2+ is tetragonally distorted both in crystals and in solution [6]. Tartaric acid, HO2CCH(OH)CH(OH)CO2H, is a white crystalline diprotic organic acid, which exists under two different forms in aqueous solutions depending on the pH value: and . These species are denoted as: and , respectively, for brevity. The equilibria between these may be depicted as [7-9]: (1)
which are characterized by the equilibrium constants:
The pK’s values of tartaric acid are: pKa1 = 2.60 and pKa2 = 3.77 at 25°C [7-9]. Depending on the copper concentration, the glycine concentration and pH, glycine molecules can successively replace water molecules in copper’s coordination sphere, forming copper-glycine complexes. An important point is to understand the deposition solution chemistry and especially the copper species involved in the deposition process. In aqueous solutions, Cu(II) soluble species are Cu2+, hydroxide complexes, chloride complexes, tartrate complexes. The concentration of the latter are related to Cu2+ concentration by the equilibrium reaction:
each complex is characterized by its stability constant
.
Int. J. Electrochem. Sci., Vol. 6, 2011 where represents a ligand, or number and n is the ligand charge. The values of reported in Table 1.
2635 , in the present work, and i the coordination were obtained from literature [7-9] and are
Table 1. Equilibrium constants for the overall formation of complexes for the copper-tartrate-chloridewater system and mixed-ligand complex obtained from the literature [7-9], Copper complex
.
Copper complex 6.1 13.0 14.7 15.8
0.06 0.67 0.20 -0.77
2.7 4.0
20.7
In addition, when the pH increases, there is an increasing tendency for the formation of mixedligand complexes or hydroxycomplexes. With copper cations, this equilibrium can be expressed by the following equilibriums:
characterized by the equilibrium constant
.
From the values of , it is possible to construction of species repartition diagram. The species repartition-pH diagram was computed using the definition of complexation coefficient of Cu(II), [10]. It is defined as: the ratio , where is the total concentration of copper including all complexes and copper cations Cu2+.
Combining Equations (5), (7) and (8),
; and
is the concentration of free
can be expressed as:
Int. J. Electrochem. Sci., Vol. 6, 2011
2636
Using this last equation, one can easily calculate the distribution of different species:
As a result, the key point of the calculation is the determination of establish the tartrate protonation coefficient , defined as:
. In a first step, we can
It must be pointed out that under our experimental conditions differs from the ratio, where is the overall-tartrate concentration, assuming that a significant part of tartrate ions is involved in the formation of complexes. Then, this ratio can be expressed as:
leading to a second degree equation:
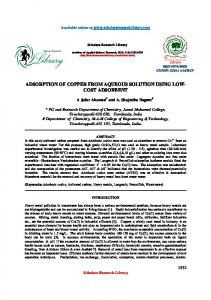
The determination of can be achieved by an iterative method involving Equations (13), (14) and (15). Then, using equations (10-12) one can easily obtain the distribution diagram for the copper-tartrate-chloride-water system. The Figure 1 shows the species repartition diagram obtained. Figure 1 shows the species repartition diagram obtained from Relations (11-13) and considering the conditions mentioned for solution S1. In this diagram it is possible to observe four characteristic pH regions. The first region is characterized by the complexes as the most stable species (pH region 0-2.7). In the second region, between pH 2.7 and pH 3.5, the predominant copper species are . In the third region, from pH 3.5 to pH 5.7, the predominant copper species are complexes. The fourth region, above pH 5.7, is characterized by the formation of mixed-ligand complexes and the predominant species are . These results clearly indicate that under our experimental conditions the dihydroxycomplexe was found to be predominant in the solution S1 at pH 10 and 25°C.
Int. J. Electrochem. Sci., Vol. 6, 2011
2637
100 4-
CuT 2 (OH) 2
80 CuT
60
CuCl
%
22
2
40 CuT CuCl
20
3 +
CuCl 2+ Cu 2CuCl 4
0 0
2
4
6
8
10
12
14
pH Figure 1. Species distribution diagram as a function of the solution pH for the copper-tartrate-chloridewater system at 25°C. This diagram was constructed under these conditions: 0.1 M Cu(II) + 1.2 M Cl- + 0.3 M tartrate.
Based on the information provided by the species repartition diagrams, we therefore assume that under our experimental conditions the overall reaction of copper electrodeposition process at pH 10 will be the following:
The equilibrium potential of the reaction (16) at 25°C is given by:
where: represents the equilibrium potential, in Volts vs. SCE, for the redox couple . The generalized notation Cu’ represents the free copper ions in the solution, the soluble copper-glycine complexes, or the metal hydroxide; T’ corresponds with the free concentration of tartrate: [T’] = [H2T] + [HT-]+ [T2-]…, etc. The Eq. (17) allows one to predict a displacement in the value of equilibrium potential when there is a change of pH, tartrate and/or copper ions concentration at 25°C.
Int. J. Electrochem. Sci., Vol. 6, 2011
2638
3.2 Voltammetric study Cyclic voltammetry study was performed in the potential range 0 to -1.1 V vs. SCE onto GCE from solution S1. The potential scan was initiated in the negative direction from the open circuit potential (EOCP) at different scan rates () between 10-500 mV s-1.
15
B''
0.0 -0.5
B'
A
10
j, mA cm
-2
-1.0 -1.5 -2.0
j, mA cm
-2
-2.5 -3.0 -3.5 -0.8
5
-0.6
-0.4
-0.2
0.0
0.2
0.4
E, V/SCE
A' 0
A -5
B -1.2
-0.9
E
N
-0.6
E
CO
-0.3
0.0
0.3
0.6
E, V/SCE
Figure 2. Typical cyclic voltammograms obtained onto GCE from electrolytic solution S 1. Scanning rate: 10 mV s-1.
Typical cyclic voltammogram obtained from solutions S1 is presented in Figure 2 at 10 mV s-1; this voltammogram presents the following characteristics: a negligible cathodic current was observed from the EOCP to -0.36 V vs. SCE indicated no reaction in this potential range; continuing with the potential scan in the negative direction is possible to observe the formation of two cathodic peaks, A and B, at the peak potentials EPA = -0.410 V and EPB = -0.751 V vs. SCE, respectively. We associate the peak A with the reduction of the chemical species , as was proposed in Eq. (16). In addition, the cathodic current density of peak A is less than that of peak B. Thus, the formation of peak A is associated with the electrodeposition of copper onto the active sites on the electrode surface that are not blocked by adsorbed tartrates and/or ions. At potentials more negative than EPA, peak B is observed. This peak is associated with the electrodeposition of copper onto the active sites
Int. J. Electrochem. Sci., Vol. 6, 2011
2639
that are liberated when the chemical species are desorbed from the surface of GCE. In addition, this result indicates that a favorable kinetic condition for the copper electrodeposition (peak B) on the substrate surface has been reached. Similar results were obtained by Vazquez-Arenas et al. [11], where they observed the formation of two cathodic peaks for copper reduction in the presence of ammoniachloride and these authors shown that the low current density obtained in the first cathodic peak is associated to a slow reduction process due to adsorbed species in the electrode surface. The behavior observed during the reduction of copper (II) ions in the presence of tartrate and chlorides ions is associated with the partial adsorption of these chemical species onto GCE. When chloride and/or tartrate ions are adsorbed on the electrode surface, they block a fraction of the active sites (θblock) at which the first reduction process occurs (potential zone in which peak A appears). As a result, the reduction of Cu(II) ions occurs only at the fraction of active sites that are not blocked (θ = 1 – θblock). Subsequently, an increase in the overpotential is required for the desorption of chemical species from the GCE surface, allowing the reduction of Cu(II) ions to take place (peak B) at the active sites vacated by the chemical species. When the scan direction was reversed in the switching potential E = -1.1 V vs. SCE, two crossovers (ECO and EN) between the current density anodic and cathodic are observed, a feature that is characteristic of the formation of a new phase [12, 13]. The EN potential is just a crossover potential at which nucleation and growth take place with a measurable rate. The ECO potential is known as the crossover potential and this is associated with . The faradic current efficiency for metal deposition was determined from ratio of the anodic (QA) to cathodic (QC) charges. The charges were obtained by integration from voltammetric curves and the results were: QA (329.5 mC cm-2)/QC (459.9 mC cm-2) = 72%. Such behavior can be ascribed to the low stability of the nuclei at less negative EN. Ramos et al. [14] have reported similar results for copper deposit in an alkaline medium containing ammonia, and they associated this behavior to the reaction of disproportionation on the electrodeposited copper. However, we propose that the low recoveries are due to the combined effect of the thermodynamically stability of the nuclei and reaction of disproportionation on the electrodeposited copper. To analyze the oxidation processes associated with peaks A’, B’’ and B’, we used the switching potential technique. In this technique, the switching potential (Eλ) was fixed at potential regions of the peaks A and B, and the potential scan was switched to the positive direction at E λ. The results obtained revealed that the current density of peaks A’, B’’ and B’ depends on both reduction peaks (Figure 3). When the Eλ value was low, Eλ = -0.720 V vs. SCE, peak B’ was the major anodic signal. With Eλ = 0.620 V vs. SCE, peak B’’ is not observed and the signal of peak A’ is kept constant. The three oxidation peaks are associated with different phases of pure copper electrodeposited. In addition, as shown the Figure 3, the value of ECO is independent of Eλ. Is important to mentioned that the value of ECO (-0.369 V vs. SCE) is approximately the predicted value from Eq. (17). The value obtained from of Eq. (16) is -0.275 V vs. SCE. Difference of 94 mV, between ECO and was found for S1. This difference might be associated to adsorption process or formation of chemical species in the interphase. Under the above conditions, we propose that there is a good approximation between ECO and , and that Eq. (16) represents the copper electrodeposition.
Int. J. Electrochem. Sci., Vol. 6, 2011
2640
B''
15
B'
E=-0.720 V E=-0.620 V
10
E=-0.480 V
j, mA cm
-2
E=-1.100 V
5
A' 0
A -5
B -1.2
-0.9
-0.6
-0.3
0.0
0.3
0.6
E, V/SCE
Figure 3. Cyclic voltammograms obtained onto GCE at different scan rates from solution S1 at 25°C. At potentials more positive than ECO, three anodic peaks, A’, B’’ and B’, are observed; these peaks could be associated with the oxidation of the previously Cu deposited in peaks A and B. The difference between the value and potential value (EN) at the onset of growth of copper crystals is known as the nucleation overpotential [2]. The difference between the EN and ECO values can be employed to estimate the experimental value of nucleation overpotential [2]. The value of the nucleation overpotential obtained is 240 mV. In our experiments, the difference between the anodic B’’ or B’ and cathodic B peak potentials (∆EP = EPB – EPB’’) or (∆EP = EPB – EPB’), for cyclic voltammogram in Figure 2, is 0.663 V and 855 V, respectively. The obtained values for ∆EP significantly exceed the quantity characteristic of a reversible process, ∆EP = 0.059/n at 25°C and n = 2 [12, 15]. Therefore, we could assume that a totally irreversible reaction might be the case, from the cyclic voltammograms recorded (Figure 2). From Figure 2 one can determine the magnitude of the product αcnα, where αc is the cathodic transfer coefficient and nα is the number of electrons transferred up to, and including, the rate determining steps. With this purpose, such a parameter of the mentioned cyclic voltammograms as the shape factor can be applied [12, 15]:
Int. J. Electrochem. Sci., Vol. 6, 2011
2641
where EPB/2 is the potential of a half-peak. It was found that αcnα ≈ 0.53, if the reaction (16) is considered as totally irreversible.
60
B''
40
B'
20 j, mA cm
-2
A'
0 10 mV s
-20
-40 -1.6
-1
scan rate
B -1.2
500 mV s
-1
-0.8
-0.4
0.0
0.4
0.8
E, V/SCE
Figure 4. Cyclic voltammograms obtained onto GCE at different scan rates from solution S1 at 25°C. 3.2. Effect of the potential scan rate The effect of scanning rate on cyclic voltammograms from solution S1 is given in Figure 4. The voltammograms, all initiated from the EOCP, were scanned in the negative direction at rates ranging from 10 to 500 mV s-1. According to Figure 4, all voltammograms are characterized, principally, by one cathodic peak (B) and two anodic (A’) peaks. The cathodic peak maximum currents (jPB) were found to increase and the cathodic peak potentials (EPB) shifted negatively when was increased during the scan.
Int. J. Electrochem. Sci., Vol. 6, 2011
2642
-5 -10
(a)
jPB, mA cm
-2
-15 -20 -25 -30 -35 -40 0.1
0.2
0.3
0.4
1/2
0.5 1/2
/V
0.6
0.7
0.8
-1/2
s
-0.7 -0.8
(b)
EPB, V/SCE
-0.9 -1.0 -1.1 -1.2 -1.3 -1.4 0.8
1.2
1.6
2.0
2.4
2.8
-1
log ( / mV s )
Figure 5. Variation of current density maxima jP and potential EP for peak B in cyclic voltammograms as a function of the scan rate. (a) iPB vs. 1/2 and (b) EPB vs. log .
In either case, the maximum current value of the peak B was found to be proportional to the square root of the sweep rate within the range of sweep rates applied (Figure 5(a)), indicating a diffusion-controlled process [12, 15].
Int. J. Electrochem. Sci., Vol. 6, 2011
2643
The cathodic peak potentials EP shift in the negative direction, as mentioned above, and are nearly linear with respect to the decimal logarithm of the sweep rate (Figure 5b), suggesting that the reaction (16) is not reversible and tentatively may be considered as irreversible. Then, from the variation of EP with log given by the following equation [12, 15]:
Where
Ks is the standard rate constant, and the other terms have their usual significance, it should be expected that EP shifts by 30/αcnα mV for each decade increase in . However, as is evident from curve (b) in Figure 5, the experimental shift of EP for the solution S1 with increasing from 10 to 100 mV s-1 is equal to 329 mV. Quite apparently, such values of the negative shift of EP for each decade increase in are in a considerable excess of that expected for the totally irreversible reaction [12, 15]. These features of cyclic voltammograms recorded in this work clearly show that the diagnostic criteria for a totally irreversible system reported in the literature [12, 15] are not wholly satisfied. Consequently, the reaction (16) could not be considered as a simple irreversible reaction. Table 2. Values of thermodynamic parameters characteristics obtained from voltammetric study. Solution S1
ECO V/SCE -0.437
EN V/SCE -0.609
EPB V/SCE -0.751
EPA V/SCE -0.410
EPB’ V/SCE 0.104
EPB’’ V/SCE -0.088
EPA’ V/SCE -0.225
QA/QC V/SCE 0.72
3.3.Diffusion coefficient calculation The electrochemical reduction of copper in the stationary diffusion regime was studied using the rotating disk electrode (RDE) voltammetry technique. For a given temperature, a constant potential scan rate (1 mV s-1) was imposed and the electrode rotation rate () was varied from 50 to 400 rpm. Before each run, a Cu predeposit was prepared in situ on glassy carbon electrode of 0.07 cm 2 visible surface area by applying 20 mA cm-2 for 20 s. The value of the diffusion coefficient (D) for the species was calculated using the well-known Levich equation Eq. (21) [12, 15]. It gives a relationship between the diffusion-convection limiting current density, iL, obtained on a rotating disk electrode (RDE), the electroactive species concentration, c, diffusion coefficient, D, the solution kinematic viscosity, , and the revolution rate of the RDE, .
Int. J. Electrochem. Sci., Vol. 6, 2011
2644
-4 -6
jL, mA cm
-2
-8 -10 -12 -14 -16 -18 -1
0
1
2
3
rad
4 1/2
5
6
7
-1/2
s
Figure 6. Variation in the cathodic limiting current density with agitation, obtained from solution S1 at 25°C.
From the slope of the line shown in Figure 6, the value of diffusion coefficient of was calculated using Eq. (21) and the value obtained is: D25°C = 1.7 ± 0.3 x 10⁻⁶ cm2 s-1. 3.4. Potentiostatic study The nucleation kinetics and growth of copper onto GCE electrode was studied with the chronoamperometry technique. This technique is frequently used to determine the mechanisms by which new phases are formed. Figure 7 shows a set of potentiostatic current transients recorded during the electrochemical deposition of copper onto GCE electrode from solution S1 in the potential range that corresponds to reduction process of complex, as was established in the previous studies. Hydrogen evolution does not interfere with the electrodeposition process under these conditions. As shown in each inset in Fig. 6, during the initial period, a decrease in the cathodic current is observed. Milchev et al. [16-18] reported that the falling cathodic currents could be related to the Cu2+ → Cu+ reduction. After of time associated to decrease in the cathodic current, the potentiostatic transients have the following characteristic features: an increase in cathodic current up to a maximum, which associated with crystal nucleation and growth processes, followed by a decaying in the cathodic
Int. J. Electrochem. Sci., Vol. 6, 2011
2645
current, converging to the limiting current corresponding to linear diffusion of the electroactive species to a planar electrode [13,19].
-10
Ed = -0.85 V/SCE
Ed = -0.80 V/SCE
-8
j, mA cm
-2
Ed = -0.75 V/SCE
-6 Ed = -0.70 V/SCE
-4
Ed = -0.65 V/SCE
-2
0 0
5
10
15
20
t/s Figure 7. Typical family of potentiostatic transients obtained at different potentials during the reduction of copper on GCE in solution S1
A preliminary analysis of the transients was performed by comparing the experimental transients to the dimensionless theoretical curves for instantaneous (Eq. 8) and progressive (Eq. 9) nucleation in order to determine the nucleation mechanism [19]. Comparison of experimental transients with nucleation models in dimensionless coordinates is showed in Figure 8. The results obtained show that the experimental data for the nucleation of copper lie between the two limiting cases, that is, between instantaneous and progressive nucleation model (Figure 8) and thus, do not conform to either of these models. Similar behavior was presented for others transients. On the basis of this result, we considered the use of the general model of diffusion-controlled nucleation and growth of crystals in 3D proposed by Heerman and Tarallo [20-23] in our analysis of the mechanism of Cu nucleation in presence of tartrate and chloride ions. To extract quantitative information on the kinetic parameters associated with crystal nucleation and growth processes from the current transients, we consider the contribution of the current density associated to the Cu2+ → Cu+ reduction (jet) and of the current density associated with the diffusion-
Int. J. Electrochem. Sci., Vol. 6, 2011
2646
controlled nucleation and growth of crystals in 3D (j3D-dc). In this analysis, we consider that jet is given by equation 22. Accordingly with Milchev et al. [16-18], the contribution of the initial current density decay (jet) in the transients was estimated by:
1.0
2
(i/im)Experimental
0.8
2
(i/im)3D-instantaneous 2
(i/im)3D-progressive
(i/im)
2
0.6
0.4
0.2
0.0 0
2
4
6
8
10
12
t/tm
Figure 8. Comparison between experimental transient normalized through the coordinates of its respective local maximum (tm, jm), obtained during the copper nucleation on GCE at different potentials, with the theoretical non-dimensional curves corresponding to 3D instantaneous and progressive nucleation.
where aR (A cm-2) and bR (s-1) depended on both the reduction and the oxidation frequencies. Thus, for analysis of transients we propose that the total current density can be represented as follows:
The contribution of the current density due to the effect of diffusion-controlled crystal nucleation and growth in 3D ( ), is represented by the theoretical model proposed by Heerman and Tarallo [20-23]:
Int. J. Electrochem. Sci., Vol. 6, 2011
2647
with
and
Here, A (s−1) is the nucleation rate constant, N0 (cm−2) is the number density of active sites on the substrate, D is the diffusion coefficient, c (mol cm−3) is the concentration of metal ions in the solution, and M (g mol−1) and ρ (g cm−3) are the molecular weight and density of the metal, respectively.
-10
jexperimental jR
j, mA cm
-2
-8
j3D-dc jtotal
-6
-4
-2
0 0
5
10
15
20
t/s Figure 9. Comparison between an experimental current transient recorded at -0.85 V vs. SCE, with the theoretical transient generated by non-linear fitting of equation (23) to the experimental data.
Int. J. Electrochem. Sci., Vol. 6, 2011
2648
Following the methodology employed by Milchev et al. [16-18] for the analysis of the experimental current transients, we started the fitting at t > 0.12 s in order to avoid the time region within which the electric double layer may be not fully charged and the nucleus formation may take place at a time-dependent supersaturation. Figure 9 shows a comparison between an experimental transient (E = -0.85 V vs. SCE), obtained from the solutions S1, and the non-linear fit of equation 23. The fit is good and similar behavior was observed for all the transients of Figure 7. It is clear from Figure 9 that the experimental data conforms to the model expressed by equation 23. Tables 3 list the values of the kinetic parameters obtained from the fit of equation 23.
Table 3. Potential dependence of the kinetic parameters describing copper nucleation on GCE in solution S1. E, V/SCE -0.65 -0.70 -0.75 -0.80 -0.85
jet aR (x 103 A cm-2) 2.90 3.59 3.88 7.29 9.06
j3D-dc bR (s-1) 0.13 0.56 0.92 2.07 3.95
A (s-1) 0.02 0.07 0.08 0.23 0.21
N0 (x10-7 cm-2) 1.59 5.75 6.34 18.48 24.29
The nucleation rate (A) and the numerical density of active sites (N0) both increase on application of pulses of more negative potential, behavior characteristic of a diffusion-controlled 3D nucleation process.
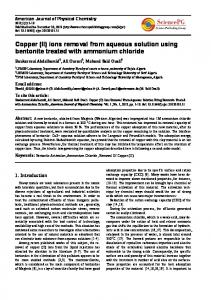
3.5. Characterization of the copper coatings A morphological study was carried out by scanning electron microscopy (SEM) to analyse the effects of potential in the different zones of the voltammetric deposition curves and to establish the relationship between the deposition potential and film morphology. The copper coatings obtained on GCE substrates from electrolytic solution S 1 were analyzed using SEM. The deposits were grown potentiostatically at different potential value, E = -0.410 V vs. SCE, E = -0.650 V vs. SCE and E = -0.750 V vs. SCE during ten, five and three minutes, respectively. The morphological features (Figure 10) of copper coatings are now presented and correlated to the results discussed before. Figures 10(a), (b) and (c) show micrographs of the copper deposits. When the potential was taken at -0.650 V (Figure 10(b)) and -0.750 V (Figure 10(c)) vs. SCE (potential zone of peak B), small crystallites with shape of circular flakes covering the substrate were obtained. Decreasingly negative potential, the size of crystallites decreased gradually and the deposits obtained were granular. These copper deposits were always golden. These results show the existence of copper deposit at potential
Int. J. Electrochem. Sci., Vol. 6, 2011
2649
region of peak A. Also, this corroborates the proposed mechanism of reduction of copper with different kinetic rate in peak A and B.
(b)
(a)
(c)
Figure 10. SEM images of deposits previously formed during 10, 5 and 3 minutes in the electrolytic solution S1 at different potentials: (a) -0.410 V vs. SCE, (b) -0.650 V vs. SCE and (c) -0.750 V vs. SCE, respectively
4. CONCLUSIONS Copper coatings were produced from non-cyanide alkaline solutions containing tartrate and chloride ions. The use of tartrate as a ligand produces stable copper complexes and homegeneous
Int. J. Electrochem. Sci., Vol. 6, 2011
2650
coatings. This organic compound seems to act not only as a leveling agent, but also as a new and efficient ligand, since it directly increases the quality of the coatings. The thermodynamic study has lead to the conclusion that the predominant chemical species of copper in the electrolytic solution are and the overall reaction involved in the copper electrodeposition process is proposed. Cyclic voltammetry results shown that the reduction of Cu(II) is carried out through two different reduction processes at different potential ranges, but involving the same copper chemical species, . Chronoamperometric studies allow to elucidate the effect of tartrate and chloride ions on the kinetics of copper electrocrystallization. The results suggested that at least two processes are involved: an electron transfer reaction, a 3D nucleation and growth process. Analysis of the transients allowed the obtaining of the nucleation parameters values, such as: the nucleation rate and the number of active nucleation sites, which are favored by the negative potential increment Micrographs SEM images of the deposits obtained on GCE substrate at different potential shown that the average grain size is smaller at potential more positives. However, the morphology of the coatings was affected by applied potential. It is important to note that golden electrodeposits were successfully obtained.
ACKNOWLEDGEMENTS The authors are grateful for financial assistance provided by CONACyT. J. C. Ballesteros is grateful to CONACyT for scholarship support.
References 1. M. Schlesinger and M. Paunovic, Modern Electroplating, John Wiley & Sons, Inc., New York (2000) 2. J.C. Ballesteros, E. Chainet, P. Ozil, G. Trejo and Y. Meas, J. Electroanal. Chem., 645 (2010) 94 3. J.C. Ballesteros, E. Chainet, P. Ozil, G. Trejo and Y. Meas, Int. J. Electrochem. Sci.,6 (2011) in press. 4. P. L. Cavallotti, D. Colombo, E. Galbiati, A. Piotti and F. Kruger, Plating Surf. Finish. 75 (1988) 78 5. S. Bharathi, S. Rajendran, V. N. Loganathan, C. Krishna and K. R. Ananndakumarannair, Proc. AESF SUR/FIN 96, Session G, (1996) 6. A.Cotton and G. Wilkinson, Advanced Inorganic Chemistry, John Wiley & Sons, Inc., New York (1972) 7. R. M. Smith and A. E. Martell, Critical Stability Constants, Plenum Press, New York (1989) 8. D. D. Perrin, Stability Constants of metal-ion complexes, Pergamon, Oxford (1979) 9. E. P. Serjeant and B. Dempsey, Ionization Constants of Organic Acids in Aqueous Solution. Pergamon, Oxford, (1972) 10. B. Tremillon, Electrochimie Analytique et Reactions en Solution, Masson, Paris (1993) 11. J. Vazquez-Arenas, R. Cruz, L. H. Mendoza-Huizar, Electrochim. Acta, 52 (2006) 892 12. Southampton Electrochemistry Group, Instrumental Methods in Electrochemistry, Ellis Horwood Ltd, Chichester (1985) 13. G. Gunawardena, G. Hills and I. Montenegro, J. Electroanal. Chem., 184 (1985) 357
Int. J. Electrochem. Sci., Vol. 6, 2011 14. A.Ramos, M. Miranda-Hernández and I. González, J. Electrochem. Soc. 148 (2001) C315 15. A.J. Bard and L. R. Faulkner, Electrochemical methods: fundamentals and applications, John Wiley & Sons, Inc., New York (2000) 16. A.Milchev and T. Zapryoanova, Electrochim. Acta 51 (2006) 2926. 17. A.Milchev and T. Zapryoanova, Electrochim. Acta 51 (2006) 4916 18. T. Zapryoanova, A. Hrussanova and A. Milchev, J. Electroanal. Chem. 600 (2007) 311 19. B. Scharifker and G. Hills, Electrochim. Acta, 28 (1983) 879 20. L. Heerman and A. Tarallo, J. Electroanal. Chem., 470 (1999) 70 21. L. Heerman and A. Tarallo, J. Electroanal. Chem., 451 (1998) 101 22. A.Milchev and L. Heerman, Electrochim. Acta, 48 (2003) 2903 23. L. Heerman and A. Tarallo, Electrochem. Commun., 2 (2000) 85
© 2011 by ESG (www.electrochemsci.org)
2651