Available online at www.notulaebiologicae.ro Print ISSN 2067-3205; Electronic 2067-3264
Notulae Scientia Biologicae
Not Sci Biol 2 (1) 2010, 81-83
Effects of Salinity on Yield and Component Characters in Canola (Brassica napus L.) Cultivars Ahmad BYBORDI Baku State University, Faculty of Biology, 23 Z. Khalilov Street, 370148 Baku, Azerbaijan;
[email protected]
Abstract Cultivars ‘Okapi’, ‘SLM046’, ‘Elite’, ‘Fornax’ and ‘Licord’ Brassica napus were tested for yield and component characters under different levels of salinity. The variations due to salinity levels, cultivars and cultivarxsalinity (interaction) were significant for different characters. The variable degrees of increase and decrease of regression coefficient estimate mates (curve estimation) showed the performance as influenced by different salinity levels. The performance of Brassica napus variety in plant height and days to first flowering was the best for ‘SLM046’, ‘Okapi’ ‘SLM046’ and ‘Okapi’ cultivars. ‘SLM046’ showed the best performance in days to maturity, followed by ‘Licord’ and ‘Elite’. ‘Okapi’ performed better than others regarding the increased number of seeds per plant and seed yield per plant, followed by ‘Fornax’. Considering all characters, the most tolerance ability was found in ‘SLM046’ and ‘Okapi’, against different levels of salinity. Keywords: Brassica napus, salinity, cultivars, yield Introduction
Materials and methods
Rapeseed is adaptive in Iran not only as a source of edible oil, but also for many other usages. Rapeseed is the third most important edible oil source in the world, after soybean and palm; it is the top ranking oilseed crop of Iran, covering 40.74 of the total oilseed production, out of 4.6 million hectares of the coastal and outsource landmass, out of which about 0.83 m ha are affected by different degrees of salinity in Iran. Among the oil seed crops, Brassica napus is the amphidiploids in origin. Saline soils and saline irrigation waters present potential hazards to canola production. Canola (Brassica napus L.) is one of the most important oil seed crops in the world, and even more in Iran, that its production has been notably extended in recent years. A major constraint to seed germination and seedling establishment of canola is soil salinity, which is a common problem in irrigated areas of Iran with low rainfall. This problem adversely affects growth and development of crop, and results into low agricultural production. Germination is one of the most critical periods for a crop subjected to salinity. Soil salinity may influence the germination of canola seeds either by creating an osmotic potential- external to the seed, preventing water uptake, or by the toxic effects of Na and Cl ions on the germinating seeds (Bybordi and Tabatabaei, 2009; Harris et al., 1978; Jones 1984). This experiment was conducted to identify the better cultivar of rapeseed which is tolerant to different salinity levels, considering yield and component characters. These identified cultivars are to be used as commercial ones at the costal belt or for farther improvement of the existing commercial cultivars.
This experiment was carried out at Baku State University, Faculty of Biology (Azerbaijan) in 2008. Five Brassica napus cultivar (‘Okapi’, ‘SLM046’, ‘Elite’, ‘Fornax’ and ‘Licord’) were evaluated. The plants were grown in plastic post containing six levels of salinity viz. 0, 4, 8, 12, 16, 20 dS.m-1 Electrical conductivity (EC) (Mass and Hoffman, 1977). Plastic post of 2L capacity were used and each pot was filled with (1:1:1) ratio perlit, vermiculite and sand, and the required amount of salt (sodium chloride) for each level of salinity. Six seeds were sown per pot; the timing of seedlings was done by keeping three for each pot at 15 days after sowing. The posts were irrigated with tap water, to grow crop without moisture stress. Data on plant height, days to first flowering, days to maturity, number of siliqua per plant, seeds per siliqua and seed yield per plant, were recorded. Plant height was measured from the base of the plant to the tip of the inflorescence, at harvest time. The total of 90 pots were prepared for six levels of salinity, on five cultivar and three replications. The pots were arranged in a factorial randomized block design, over factor A = salinity levels and factor B = cultivars. The analysis of variance for each of the studied character was performed by F- test (Cochran and Cox, 1957). Regression coefficient for each character was calculated using the mean values from different treatments for each cultivar; effect as dependant and treatment effect as independent variable less following the methods as cited by Zaman et al. (1982).
Received 29 September 2009; accepted 10 January 2010
Bybordi A. / Not Sci Biol 2 (1) 2010, 81-83
82
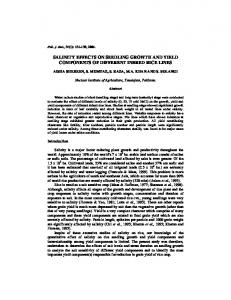
‘Licord’ showed the highest degrees of increase in days to the first flowering among the studied cultivars. These results show that ‘SLM046’ is more tolerant at higher salinity levels, while the ‘Elite’ was less tolerant than the rest of the cultivars. According to the regression coefficient values (Tab. 1) the best performance was found in ‘SLM046’ followed by ‘Okapi’. Except of ‘Elite’, all cultivars showed that days to maturity is in direct increase with the salinity levels (Fig. 3). This indicates that ‘Elite’ had a negative response to the increase of salinity for this character. The rate of increase
Results and discussion
The analysis of the variance showed significant variations between treatments (different salinity levels), cultivars and interaction (salinity-cultivars) regarding the effects over all characters. These results indicate that the levels of salinity had different influence, and the cultivars had distinctive responses. Plant height was found to decrease gradually with an increase of salinity levels for all five cultivars (Fig. 1). At control condition (0 dS.m-1), ‘Okapi’ showed the
Tab. 1. Regression coefficient values of five rapeseed cultivars of different characters grown under different salinity Cultivars
Height (cm)
Days of first flowering
Days of maturity
No. of siliqua/plant
No. of seeds/ siliqua
Seed yield/plant
‘SLM046’ ‘Okapi’ ‘Licord’ ‘Fornax’
-0.9476** -1.162** -1.241** - 1.6532**
0.2724** 0.3223** 0.4261* 0.5892**
0.3049** 0.0782 0.1282 0.0281*
0.418 0.397 0.385 0.121
- 0.3892** - 0.3562** - 0.2342** - 0.5941
- 0.0026 - 0.0048 - 0.047 - 0.0522
‘Elite’
-1.224**
0.6789
- 0.2468
0.211
- 0 .8421
- 0.064
Note : *and **indicate at 5% and 1% levels, respectively
highest plant height and ‘Elite’ the lowest one; this was due to the different genetical characteristic of the cultivars. In 20 dS.m-1 conditions, all five cultivars of Brassica napus showed almost the same plant height, but they had different plant height at control conditions and lower salinity levels. This result indicates that salinity affect the plant height at higher salinity levels. The Figs. clearly shows that among the Brassica napus cultivars, ‘SLM046’ was the best performer under different levels of salinity, considering the regression coefficient value (Tab. 1). This indicates that the regression coefficient values were slightly influenced by varietal characters, in reaction with salinity reaction. Kuhad et al. (1989); Sinha (1991); Shannon et al. (1993), reported similar results regarding the decrease of plant height along with the increase of salinity in rapeseed (Fig. 3). With an increase of salinity levels, the days to the first flowering were increased for all five cultivars of rapeseed (Fig. 2). Among the five Brassica napus cultivars, ‘Okapi’ and ‘SLM046’ were clearly found to have the slower increase in days to the first flowering than the others tested. ‘Elite’ showed sharp increase at 8 dS.m-1 medium, compared with static conditions of the higher salinity levels.
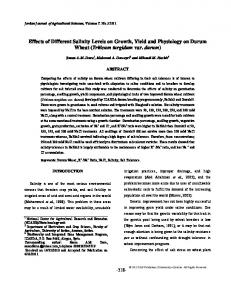
days to maturity for ‘SLM046’ and ‘Okapi’ was less than for the rest of the cultivars. Regarding this character ‘Fornax’ had the highest increase in days to maturity. Considering the regression coefficient values, the best performance was showed by ‘SLM046’. The total number of siliqua per plant found that most of the cultivars showed higher in number up 12 dS.m-1 than control, then decline (Fig. 4.). It shows hat most of the cultivars had a positive response of the increase of total number of siliqua in lower salinity levels, while in higher levels of salinity they drastically decline. ‘SLM046’ showed the highest value both in control and 20 dS.m-1 salinity levels. This demonstrates that ‘SLM046’ has the genetical capability to produce a high number of siliqua per plant, followed by the other cultivars. Regarding the increase of seeds per siliqua, ‘SLM046’ and ‘Okapi’ were more or less static in all levels of salinity (Fig. 5). These results indicate a tolerant response of the current feature in different salinity levels for all cultivars taken into the study. All five cultivars had a decreasing trend in yield performance while increasing the salinity levels (Fig. 6). Among the five cultivars, ‘SLM046’ showed more static trend than the rest. The yield performance of
Tab. 2. Ranking score of different varieties against different levels of salinity on the basis of regression coefficient values Cultivars
Ranking Score Plant Height (cm)
Days to first flowering
Days to maturity
No.of siliqua/plant
No.of seeds/siliqua
Seed yield/plant
‘Okapi’
4
4
4
4
4
4
‘SLM046’
5
5
5
5
5
5
‘Licord’
3
3
3
2
1
2
‘Fornax’
1
1
2
3
4
3
‘Elite’
2
2
1
1
1
1
Note: the lowest value for each trait indicates the best
Bybordi A. / Not Sci Biol 2 (1) 2010, 81-83
Fornax Licord Elite
80 75 70 65
SLMO46 Okapi Fornax Licord Elite
50
40
0
4
8
12
16
Okapi
92
Fornax
90
Licord
88
Elite
86 84 82
30
60
SLMO46
94 Day to maturity
Plant hight (cm)
85
Day to firest flowering
83 SLMO46 Okapi
80 0
20
4
8
12
16
20
0
4
-1
8
12
16
20
-1
Salinity level(ds.m )
-1
Salinity level(ds.m )
Salinity level(ds.m )
Fig. 1. Plant height performance of five Fig. 2. Days to first flowering performance Fig. 3. Days to maturity performance of canola cultivars under different salinity of five canola cultivars under different sa- five canola cultivars under different salinlevels ity levels linity levels 37
Licord Elite
35 33 31 29 27
SLMO46 Okapi Fornax Licord Elite
22 20 18 16 14 12 10
25 0
4
8 12 16 -1 Salinity level(ds.m )
20
0
4
8
12
16 -1
Salinity level(ds.m )
20
SLMO46
0.55
Seed yield/plant(g)
Okapi Fornax
No.of seeds/siliqua
No.of siliqua/plant
SLMO46
Okapi Fornax
0.5
Licord
0.45
Elite
0.4 0.35 0.3 0
4
8
12
16
20
-1
Salinity level (ds.m )
Fig. 4. Number of silliqua/plant perfor- Fig. 5. Number of seed/siliqua perfor- Fig. 6. Seed yield per plant performance of mance of five canola cultivars under dif- mance of five canola cultivars under differ- five canola cultivars under different salinferent salinity levels ity levels ent salinity levels
‘SLM046’ was probably influenced by the higher number of seeds per siliqua, low sterility percentage and higher number of siliqua per plant. Ranking score was given for all five cultivars on the basis of regression coefficient (curve estimation) values, for all the characters (Tab. 2). The mean score was calculated, and mentioned as varietal position in respect of tolerance ability of all five cultivars. Considering all characters studied for the five the cultivars, ‘SLM046’ and ‘Okapi’ jointly stood on the first position in the means of salinity tolerance ability, followed by ‘SLM046’ which showed better response in plant height, days to first flowering and days to maturity, number of siliqua per plant and seed yield per plant. Refrences Ashraf, M., T. McNeilly and A. D. Bradshaw (1987). Selection and heritability of tolerance to sodium Chloride in four forage species. Crop Sci. 27:232-234. Bybordi, A. amd S. J. Tabatabaei (2009). Effect of Salinity Stress on Germination and Seedling Properties in Canola Cultivars (Brassica napus). Notulae Botanicae Horti Agrobotanici Cluj-Napoca. 37(1):71-76. Chhabra, M. L. and T. P. Yadava (1997). A new modified technique for simulating salinity in pot culture experiments. Cruciferae News Letter. 19:17-118. Chauhan, C. P. S., S. P. Singh and D. C. Pathak and Bhudyal (1988). Nitrogen and phosphorus requirement for mustard crop under irrigation with saline waters. Annals of Arid Zone 27: 293-296. Cochran, W. G. and G. M. Cox (1957). Experimental Desighn.2nd Edn. Asia publishing House, Bombay, London, New York. p.148-181. Hamdy, A., S. Abdel Dayem and M. Abu-zeid (1993).
Saline water management for optimum crop production. Agricultural water Management 24:189-203. Karim, Z., S. G. Hussain and M. Ahmed (1990). Salinity problem and crop intensification in the coastal region of Bangladesh. BARC Soils publication. No.33. p.63. Kuhad, M. S., I. S. Sheoran and N. R. Bishnoi (1989). Variability in Brassica genotypes under simulated salt and osmotic stress at iso osmotic level duting germinati on. Haryana Agric. J. Res. 19:193-196. Kumar, D. (1990). Screening of related Brassica species for seedlinf emergence and seed yield under saline conditions. National Symposium on Genetics of Brassica’s , Durgapur, India, 8-9 August 1990. p.5. Kumar, D. (1993). Variability study in Indian mustard on normal and saline soils. Annals of Arid Zone 32:25-28. Rana, R. S., K. N. Singh and P. S. Ahuja (1980). Hromosomal variations and plant tolerance to sodic and saline soils. Proceedings of international symposium on salt Affected soils. Central soil salinity Research Institute. (Karnal, India). p.198-204. Shannon, M. C., C. M. Grieve and L. E.Francois (1993). Whole plant response to salinity. Plant Response Mechanism to the Environment. New York, USA, Marcel Dekker. Sinha, T. S. (1991). Genetic adaptation of Indian mustard to semiarid saline conditions.Indian Journal of Agricultural Sci. 61:251-254. Zaman, S. M. H., K. Rahim and M. Hawlader (1982). Simple lesson from Biometry.Bangladesh Rice Research Institute. Joydebpur. Gazipur p.171.